Sample Category Title
USD/JPY Daily Outlook
Daily Pivots: (S1) 111.85; (P) 112.23; (R1) 112.73; More...
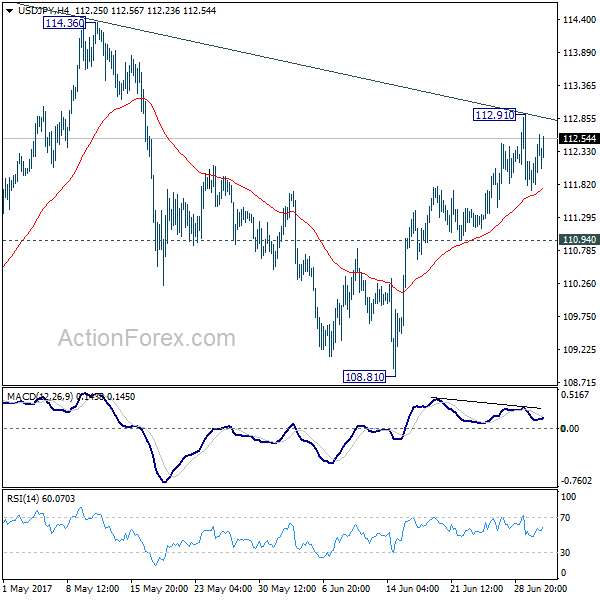
Intraday bias in USD/JPY remains neutral as it's consolidating below 112.91 temporary top. On the upside, Sustained break of the medium term channel resistance will argue that whole pull back from 118.65 has completed at 108.12 already. In such case, further rise should be seen to 114.36 resistance for confirmation. However, break of 110.94 will argue that rebound from 108.81 has completed and will turn bias back to the downside for this support instead.
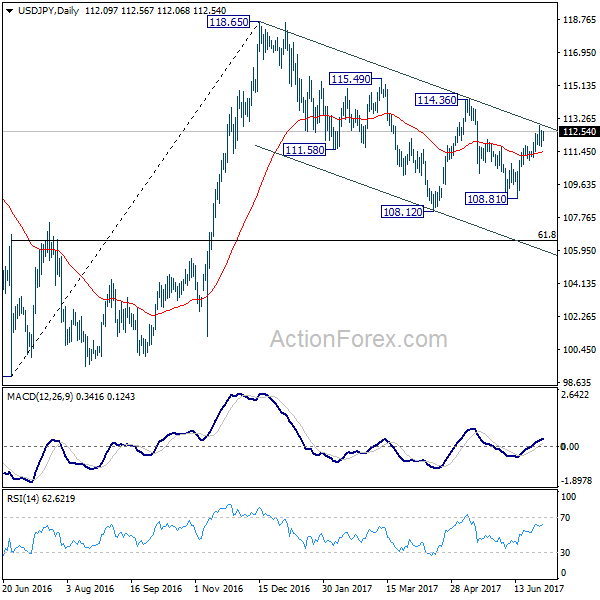
In the bigger picture, the corrective structure of the fall from 118.65 suggests that rise from 98.97 is not completed yet. Break of 118.65 will target a test on 125.85 high. At this point, it's uncertain whether rise from 98.97 is resuming the long term up trend from 75.56, or it's a leg in the consolidation from 125.85. Hence, we'll be cautious on topping as it approaches 125.85.
Dollar Recovers in Steady Markets as Focus Turns to ISM, NFP and FOMC Minutes
The forex markets open the week rather steadily. Dollar recovers as it's digesting last week's steep selloff. The greenback will look into the key events including ISM indices, NFP and FOMC minutes for reasons to rebound. On the other hand, there are important economic data from UK and Canada, as well as ECB accounts that could trigger further rises in respective currency. Meanwhile, additional focus will also be on whether the selloff in global equities last week would extend. It isn't too bad at the timing of writing as Nikkei is trading up 0.28%, above 20000 handle. An eye will also be on oil price while WTI is consolidating above 46 handle, looking for strength to extend the rebound in the last two weeks.
Japan large manufacturers sentiment hits 3 year high
Japan Tankan large manufacturers index jumped to 17 in Q2, up fro 12, and beat expectation of 15. That's the highest reading in three years. Large manufacturers outlook improved to 15, up from 11, above expectation of 14. Non-manufacturing index rose to 23, up from 20, and met consensus. Non-manufacturing outlook rose to 18, up from 16, but missed expectation of 21. The survey was generally consistent with recent upgrade of economic assessment by BoJ. But still, the positive developments in the economy is not being translated into price pressure yet. And BoJ is far from stimulus exit.
Rebound in China manufacturing may be temporary
The Caixin China PMI manufacturing rose to 50.4 in June, up from 49.6 and beat expectation of 49.8. That's back in expansion territory and was the highest level in three months. However, a CEBM Group economist noted in the accompany statement for the release that "based on the inventory trends and confidence around future output, the June reading was more like a temporary rebound, with an economic downtrend likely to be confirmed later."
Elsewhere, Australia TD Securities inflation rose 0.1% mom in June. Building approvals dropped -5.6% mom in May.
PMI data as the focus on the day
As for today, PMI data will be the main focus. UK will release PMI manufacturing in European session. Eurozone will release unemployment rate and PMI manufacturing final. Swiss will release retail sales and SVME PMI. Later in US session, US will release ISM manufacturing and construction spending.
Fed minutes and non-farm payroll keys for the week
For the week ahead, US events will be the major focuses. Dollar was the second weakest major currency last month as many of global central banks turned hawkish. There are a lot of doubts on whether Fed will deliver another rate hike in September. So far, comments from FOMC officials are divided. And the markets will be eager to look deeper into the discussion regarding the rate hike in June, from the FOMC minutes. In addition, ISM manufacturing and non-manufacturing indices, and more importantly, the non-farm payroll report will be important in shaping up the chance for the September decision.
Elsewhere, ECB monetary policy meeting accounts will also be watched for indication on how ready are policymakers on stimulus exit. UK data including PMIs and productions will be watched as BoE will start debating rate hikes in the coming months. Canadian employment data will also be important in shaping the chance for a July hike by BoC. RBA rate decision on Tuesday will likely be a non-event.
Here are some highlights for the week ahead:
- Tuesday: Australia retail sales, RBA; UK construction PMI, BRC shop price; Eurozone PPI
- Wednesday: Eurozone PMI services final, retail sales; UK PMI services; US factory orders, FOMC minutes
- Thursday: Australia trade balance; German factory orders, ECB meeting accounts; Swiss CPI; US ADP employment, trade balance, ISM services, jobless claims; Canada building permits, trade balance
- Friday: Japan labor cash earnings; Swiss unemployment, foreign currency reserves; German industrial production; UK productions, trade balance; Canada employment, Ivey PMI; US non-farm payrolls
USD/JPY Daily Outlook
Daily Pivots: (S1) 111.85; (P) 112.23; (R1) 112.73; More...
Intraday bias in USD/JPY remains neutral as it's consolidating below 112.91 temporary top. On the upside, Sustained break of the medium term channel resistance will argue that whole pull back from 118.65 has completed at 108.12 already. In such case, further rise should be seen to 114.36 resistance for confirmation. However, break of 110.94 will argue that rebound from 108.81 has completed and will turn bias back to the downside for this support instead.
In the bigger picture, the corrective structure of the fall from 118.65 suggests that rise from 98.97 is not completed yet. Break of 118.65 will target a test on 125.85 high. At this point, it's uncertain whether rise from 98.97 is resuming the long term up trend from 75.56, or it's a leg in the consolidation from 125.85. Hence, we'll be cautious on topping as it approaches 125.85.
Economic Indicators Update
| GMT | Ccy | Events | Actual | Forecast | Previous | Revised |
|---|---|---|---|---|---|---|
| 23:50 | JPY | Tankan Large Manufacturers Index Q2 | 17 | 15 | 12 | |
| 23:50 | JPY | Tankan Large Manufacturers Outlook Q2 | 15 | 14 | 11 | |
| 23:50 | JPY | Tankan Non-Manufacturing Index Q2 | 23 | 23 | 20 | |
| 23:50 | JPY | Tankan Non-Manufacturing Outlook Q2 | 18 | 21 | 16 | |
| 23:50 | JPY | Tankan Small Mfg Index Q2 | 7 | 7 | 5 | |
| 23:50 | JPY | Tankan Small Mfg Outlook Q2 | 6 | 4 | 0 | |
| 23:50 | JPY | Tankan Small Non-Mfg Index Q2 | 7 | 6 | 4 | |
| 23:50 | JPY | Tankan Small Non-Mfg Outlook Q2 | 2 | 3 | -1 | |
| 23:50 | JPY | Tankan Large All Industry Capex Q2 | 7.20% | 0.60% | ||
| 0:30 | JPY | Manufacturing PMI Jun F | 52.4 | 52 | 52 | |
| 1:00 | AUD | TD Securities Inflation M/M Jun | 0.10% | 0.00% | ||
| 1:30 | AUD | Building Approvals M/M May | -5.60% | -1.30% | 4.40% | |
| 1:45 | CNY | Caixin PMI Manufacturing Jun | 50.4 | 49.8 | 49.6 | |
| 5:00 | JPY | Consumer Confidence Jun | 43.9 | 43.6 | ||
| 7:15 | CHF | Retail Sales (Real) Y/Y May | -0.80% | -1.20% | ||
| 7:30 | CHF | SVME PMI Jun | 56.3 | 55.6 | ||
| 7:45 | EUR | Italy Manufacturing PMI Jun | 55.3 | 55.1 | ||
| 7:50 | EUR | France Manufacturing PMI Jun F | 55 | 55 | ||
| 7:55 | EUR | Germany Manufacturing PMI Jun F | 59.3 | 59.3 | ||
| 8:00 | EUR | Eurozone Manufacturing PMI Jun F | 57.3 | 57.3 | ||
| 8:30 | GBP | PMI Manufacturing Jun | 56.3 | 56.7 | ||
| 9:00 | EUR | Eurozone Unemployment Rate May | 9.30% | 9.30% | ||
| 14:00 | USD | ISM Manufacturing Jun | 55 | 54.9 | ||
| 14:00 | USD | ISM Prices Paid Jun | 58.5 | 60.5 | ||
| 14:00 | USD | Construction Spending M/M May | 0.20% | -1.40% |
Market Morning Briefing: Stock Indices Are All Mixed
STOCKS
Stock indices are all mixed. Dow and Dax are in a downward corrective phase and may continue so just now while the Shanghai looks sideways. Nikkei looks bullish and Nifty could test lower levels this week.
Dow (21349.63, +0.29%) tried to recover slightly from the sharp fall seen on 29th June from levels near 21487 to 21197 in a single session. Momentum could be slow and movements narrow in the near term. The sideways phase may continue for some more sessions. We could possibly see a fall towards 21000 before it starts to move up again.
Dax (12325.12, 0.73%) is trading below our expected 12400 on the downside and while the index moves lower we may expect a test of 12000 in the near term. the downward correction may continue for the next 2-3 sessions at least.
Shanghai (3182.82, -0.30%) seems to be ranged just now within 3170-3195 region and could spend a couple of more sessions in the same region. Thereafter, there is some scope of testing 3160 on the downside before again trying to rise towards 3200 or higher.
Nikkei (20060.21, +0.13%) looks bullish while above immediate support near 19950 and has a potential to rise towards 20500 in the near term.
While Nifty (9520.90, +0.18%) is trying to come up towards 9600 but while the resistance zone of 9580-9600 holds, it could be difficult for the index to rise sharply just now. In that case, the index could possible test lower levels of 9400-9380 in the coming sessions before bouncing back towards 9580-9600.
COMMODITIES
In the smaller time frame, Gold (1237) is oversold and needs a pause before attempting lower levels. We have been talking about 1230 for the last few days as a strong support. Now a break below 1230 is required before the lower levels of 1193 can be seen.A pause in the range of 1230-1260 can provide the necessary bearish momentum in Gold.
In Silver (16.58), the daily close took place close to the immediate support of 16.45. A failure to rise above 16.70 levels may trigger a sharp fall towards 16.20 regions.
Copper (2.68) moved higher in line with our expectation and trading within a range of 2.66-80. The scrip is overbought thus upside could be limited but in the medium term 2.55-57 are going to be a strong support and we will remain bullish while it is trading above those levels.
There is 40% probability that Brent (47.92) and WTI (46.25) could rise a bit more towards 50 and 48 regions respectively but this recent bounce hasn’t affected their midterm bearishness much. We think the immediate resistances of 50 (Brent) and 48 (WTI) are expected to hold as the they are in overbought territory and may see range trade between 46-50 in Brent and 44-48 in WTI. But a failure to hold above 46 and 44 may push them towards 43 and 40 levels respectively.
FOREX
Dollar Index (95.73) has managed to stay above the support of 95.50-40 in the last 2 sessions but it has to rise above 96.00-50 to trigger even a little bit of short covering,. The trend remains firmly down but keep an eye on Euro (1.1415). If Euro fails to rise above 1.1450-70 this week, Dollar may see a corrective bounce to 96.40-80.
Dollar Yen (112.41) is searching for direction after the defeat of the ruling party in the Tokyo election. 113.00 may be retested as long as the support of 111.70 holds but failure to extend the rise above 113.00 can drag it down once again.
Pound (1.3004) is trading very close to the 10-month high of 1.3047 and a successful break above it may push it towards 1.3200. Immediate support comes around 1.2930-00.
Aussie (0.7673) is struggling after meeting our initial target/resistance of 0.7700. The probability of the resistance band of 0.7700-0.7800 holding for the next few sessions are considerably higher and while the resistance holds, the currency may test the support near 0.7630.
Dollar-Rupee (64.58) is expected to trade in the modified range of 64.40-80 for the next few sessions.
INTEREST RATES
The German-Us 2YR (-1.98%) has already come off sharply from near term resistance near -1.91% while the German-Us 10Yr (-1.84%) is trading just below resistance at -1.80% and could come off from there in the coming sessions. If the resistance holds, we could see a fall in the yield spreads which could pull down the Euro a bit towards 1.14-1.1350 possibly.
German-Japan 10YR (0.38%) has also come up to test the sideways horizontal resistance which could push it back towards 0.15% in the near term. This could possible indicate an upcoming correction in Euro.
The US yields continue to rise and could possibly pause in the next couple of sessions to see a slight dip before continuing to rise further. The 10Yr (2.30%) may test 2.40% in the near term.
Daily Technical Analysis: EURUSD, GBPUSD, USDJPY, USDCHF
EURUSD
The EURUSD had a strong bullish momentum last week topped at 1.1445. As you can see on my H4 chart below, price has been moving convincingly above the EMA 200 and the trend line support suggests a valid and strong bullish trend. The bias remains bullish in nearest term testing 1.1500 – 1.1530 region before targeting 1.1615 key resistance. Immediate support is seen around 1.1350. A clear break below that area could lead price to neutral zone in nearest term testing 1.1285 but overall I remain bullish and any downside pullback should be seen as a good opportunity to buy.
GBPUSD
The GBPUSD had a strong bullish momentum last week topped at 1.3029. The bias remains bullish in nearest term testing 1.3050 key resistance which remains a good place to sell with a tight stop loss as a clear break and daily close above that area would activate my bullish mode targeting 1.3350 – 1.3500 region. Immediate support is seen around 1.2950 area. A clear break below that area could lead price to neutral zone in nearest term testing 1.2900 region.
USDJPY
The USDJPY had a bullish momentum last week topped at 112.92. As you can see on my H4 chart below, price has been moving consistently above the EMA 200 after broke above the trend line resistance, suggests a valid bullish trend. The bias is neutral in nearest term probably with a little bullish bias testing 113.00 area. A clear break and daily close above that area would expose 114.30 region. Immediate support is seen around 111.75. A clear break below that area could trigger further bearish pullback testing 111.30/00 region but as long as stay above 110.65 price is still in a bullish phase.
USDCHF
The USDCHF had a bearish momentum last week bottomed at 0.9550. The bias remains bearish in nearest term but note that from a daily chart perspective, 0.9550 – 0.9450 area remains a key support and good place to buy with a tight stop loss below 0.9450. Immediate resistance is seen around 0.9650/75. A clear break above that area could lead price to neutral zone in nearest term testing 0.9765 region. On the downside, a clear break below 0.9450 would expose 0.9250 area this week.
GBP/USD At Swing High Resistance
I hope your weekend was a productive one, even if it was just time away from your charts. We all need to recharge the batteries from time to time and the fact that markets aren't open on the weekend can sometimes be a bit of a blessing in disguise for the trading addict within us.
But it's back into the full swing of things again today, as focus turns back to the majors with a look at GBP/USD. If you've been following the blog, you'll have levels drawn showing price stuck within a 1500 pip GBP/USD range that formed after the Brexit low was broken and retested as resistance.
We had been trading this support/resistance level in the middle of the range from the long side, but price has now come back to retest previous swing high resistance:
GBP/USD Daily:
As you can see on the daily chart above, it's just a simple previous high that price has come back up to. There's nothing more to this level and there's nothing special about it while in the middle of that overall range.
With the bullish momentum behind that little push and the level having no significance other than a previous swing high, the level isn't as strong as it could be. However, if you do like the level and the risk reward that trading around it offers, step into an intraday chart like the hourly:
GBP/USD Hourly:
EURGBP – Closes Lower On Higher Price Rejection
EURGBP - The cross closed lower the past week after rejecting higher prices. This development now leaves risk lower as we enter a new week. Support lies at the 0.8700 level where a violation will turn focus to the 0.8650 level. A break will expose the 0.8600 level. Resistance resides at the 0.8800 level where a violation if seen will turn risk towards the 0.8850 level. Further up, resistance resides at 0.8900 level followed by the 0.8950 level. All in all, EURGBP remains biased to the downside on price rejection.
EURUSD – Rallies, Remains On Bullish Offensive
EURUSD - The pair closed higher on a rally the past week leaving risk of price extension on the cards. Resistance comes in at 1.1500 level with a cut through here opening the door for more upside towards the 1.1550 level. Further up, resistance lies at the 1.1600 level where a break will expose the 1.1650 level. Its weekly RSI is bullish and pointing higher suggesting further strength. Conversely, support lies at the 1.1400 level where a violation will aim at the 1.1350 level. A break of here will aim at the 1.1300 level. All in all, EURUSD faces further upside pressure.
GOLD – Bearish, Risk Remains Lower With Eyes On 1,236.02
GOLD - The commodity continues to face downside pressure leaving risk to the downside. On the downside, support comes in at the 1,230.00 level where a break will turn attention to the 1,220.00 level. Further down, a cut through here will open the door for a move lower towards the 1,210.00 level. Below here if seen could trigger further downside pressure targeting the 1,200.00 level. Conversely, resistance resides at the 1,250.00 level where a break will aim at the 1,260.00 level. A turn above there will expose the 1,270.00 level. Further out, resistance stands at the 1,280.00 level. All in all, GOLD looks to weaken further.
Central Bank Hangover
Could be an exciting week as the market deals in the afterglow of a recognised global shift by central banks to withdraw emergency accommodation. But so far in the early trade market is tending to a bit of a hangover at the beginning of Asia after a pivotal week for G10 currencies.
Hawkishness is very contagious and while there may be a lull in price action due to the US holiday-shortened week and of course Presidents Trumps first G-20 around the corner. I expect the central bank theme to remain the primary focus as the markets start to gauge the intensity of this apparent policy shift as well as what other global central banks will join the party.
Top side fervour on the on the EUR and CAD has a abated as dealers turn cautious waiting to see if the central bank hawkish push continues or is challenged by incoming data.
Looking between the lines, for the Feds at least, it appears there's a gradual transition afoot beyond data dependence to a greater concern about the adverse financial market impact from elevated asset prices.
Australian Dollar
With the RBA on tap, everyone is focused on hawkish prospects for Tuesday's RBA meeting. There's been a subtle bid in the Australian Dollar since the Bank of Canada hawkish surprise.But demand accelerated last Wednesday when the street started to price in concerted efforts by Global Central Banks to withdraw accommodations The seduction to catch a policy shift is far too high and predictable given the string of recent hawkish surprises But in reality, it's difficult to see where this hawkish RBA shift is justified. Traders could be in for a reality check if the RBA sits neutral and would likely dent the official coordination narrative that the markets have been building on.
Japanese Yen
Japan Prime Minister Abe's Liberal Democratic Party suffered an epic defeat in an election in Tokyo this weekend. Obviously, the market has bigger fish to fry as USDJPY remains very resilient trading slightly lower than Friday NY close.
Euro
The Euro is taking a breather in early APAC trade. But we ended the week on a cautious note as some thought the ECB might want to soften the rhetoric after the market's initial reaction to the Draghi Taper announcement. Perhaps traders are putting more credibility behind that mysterious ECB source that reminded the market it ‘overreacted' to a misunderstood Draghi,
EUR/USD Weekly Outlook
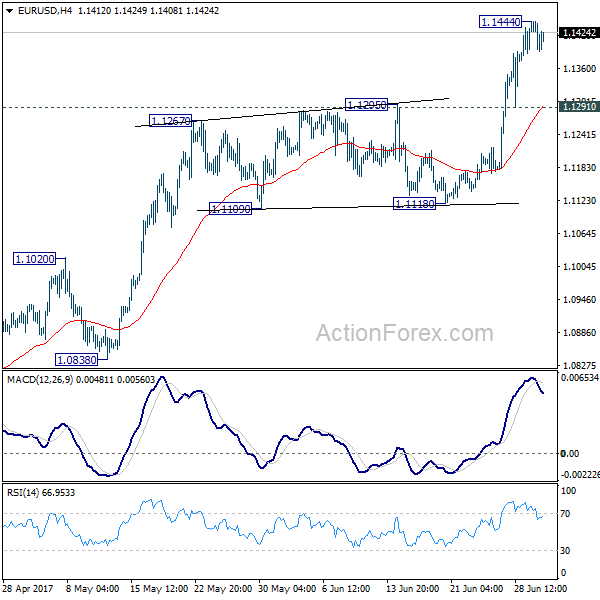
EUR/USD's rally resumed last week and powered through 1.1298 resistance to as high as 1.1444. With a temporary top in place, initial bias is neutral this week for consolidation. But downside of retreat should be contained by 1.1291 support to bring another rise. Break of 1.1444 will extend the rally from 1.0339 low to 1.1615 resistance next.
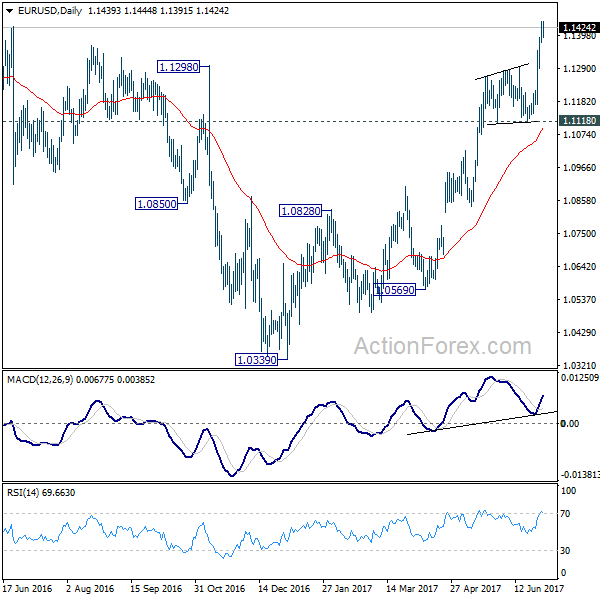
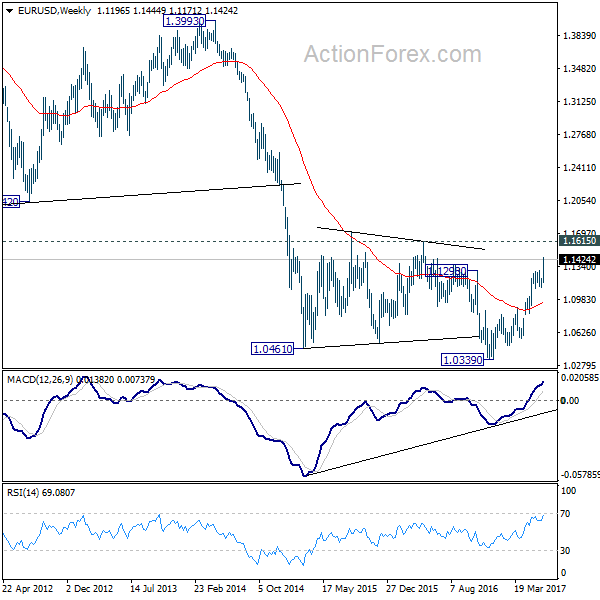
In the bigger picture, the firm break of 1.1298 resistance further affirm medium term reversal. That is an important bottom was formed at 1.0339 on bullish convergence condition in weekly MACD. Further rise would be seen to 55 month EMA (now at 1.1776). Sustained break there will pave the way to 38.2% retracement of 1.6039 (2008 high) to 1.0339 (2017 low) at 1.2516 next. This will now remain the favored case as long as 1.1118 support holds.
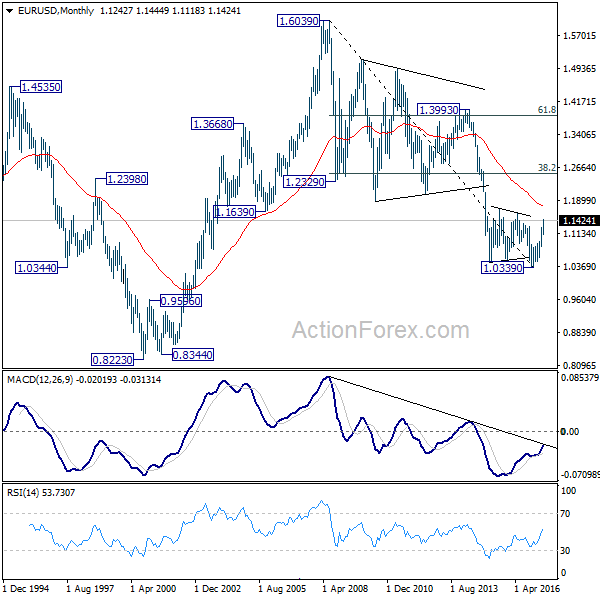
In the long term picture, 1.0339 is now seen as an important bottom as the down trend from 1.6039 (2008 high) could have completed. It's still early to decide whether price action form 1.0339 is developing into a corrective or impulsive move. But in either case, further rally would be seen to 38.2% retracement of 1.6039 to 1.0339 at 1.2516