Sample Category Title
Foreign Exchange Market Commentary: EUR/USD, USD/JPY, GBP/USD, GOLD, WTI CRUDE, DJIA, FTSE100, DAX
EUR/USD
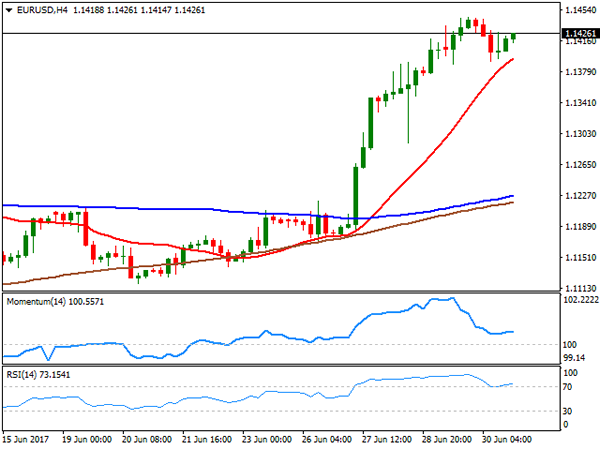
The EUR/USD pair closed the week at 1.1426, retreating modestly on Friday after setting a weekly high at 1.1445, amid prospects that several major central banks will join the Fed in the tightening path. The common currency found further support on Friday on local macroeconomic data, as German Retail Sales rose by more than expected in May, up by 0.5% in the month, and by 4.8% when compared to a year earlier, whilst European inflation advanced in June according to preliminary estimates, up 1.3% yearly basis, beating expectations of 1.2%. Core inflation rose 1.2%, also above market's forecast of 1.0%. In the US, the PCE index declined 0.1% for May following a 0.2% gain in April, whilst core PCE rose 0.1%, in line with market's expectations, although the year-on-year rate advanced 1.4%, from previous 1.5%, weighing on the greenback, as despite hawkish policy makers, soft inflation will delay tightening measures in the country.
During the weekend, German's Bundesbank Jens Weidmann, also a member of the ECB, said that the Central Bank is working on moving away from its easing monetary policy, which may add fuel to the fire, and trigger further EUR gains ahead. At the beginning of the week, the EU will see the release of the final revisions of June Markit PMIs, while later on the week, the ECB will release the minutes of its latest meeting. In the US, attention will focus on employment, with the Nonfarm Payroll report to close the week.
Technically, the pair is quite close to a major long-term resistance, the 1.1460 region that contained advances pretty much since January 2015, which may indicate some corrections ahead, although a break beyond it should favor additional advances towards 1.1615, May 2016 high first, and later towards 1.1713, August 2017 high. Indicators in the daily chart have reached overbought territory, rather a consequence of the sharp rally seen last Tuesday and after five weeks of consolidation than a sign of upward exhaustion. Indicators are barely retreating, but the price is well above all of its moving averages, maintaining the risk towards the upside. Shorter term, and according to the 4 hours chart, the upside is also favored, as the price holds well above a bullish 20 SMA, whilst the Momentum indicator corrected from extreme overbought levels but settled above its 100 level, while the RSI indicator retreated partially, but bounced from the 70 level, in line with further gains ahead.
Support levels: 1.1380 1.1345 1.1300
Resistance levels: 1.1460 1.1495 1.1530
USD/JPY
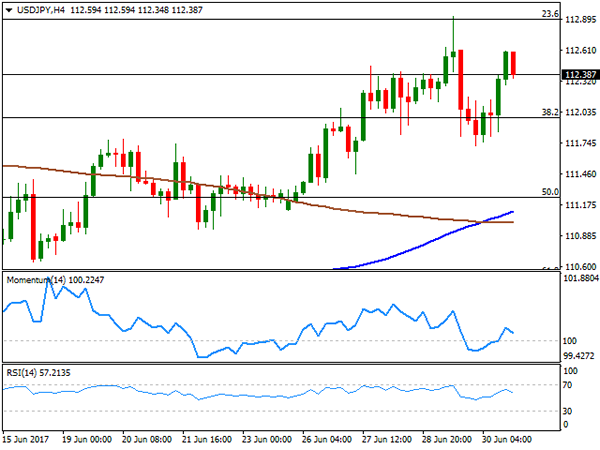
The USD/JPY pair closed with gains for a third consecutive week, despite broad dollar's weakness, finding support in surging US Treasury yields. Early Friday, Japan released its May inflation, with core CPI up 0.4% when compared to a year yearly, increasing for a fifth consecutive month, but still vastly below BOJ's 2% target, limiting possibilities of tapering in the Asian country. In the US, yields advanced for a fourth consecutive session, with a notable advance in shorter-term ones, as the 2-year note benchmark advanced 0.62% to 1.385%, while the 10-year note yield ended the week at 2.30%. Despite the immediate effect over the pair was positive, the US yield-curve kept flattening, reflecting investors' concerns over lagging US inflation, which long term, is dollar's negative. From a technical point of view, the daily chart for the pair maintains a bullish bias, as technical indicators advance above previous highs and near overbought levels, although the price was unable to settle above a bullish 200 SMA, currently at 112.60. A stronger resistance comes at 112.90, where the pair topped for the week and the 23.6% retracement of its latest bullish run. In the 4 hours chart, the 100 SMA has crossed above the 200 SMA, both in the 111.000 region, while technical indicators turned lower within positive territory, suggesting the pair may need to surpass the mentioned high to gain enough upward strength to extend its advance this Monday.
Support levels: 112.00 111.60 111.20
Resistance levels: 112.50 112.90 113.30
GBP/USD
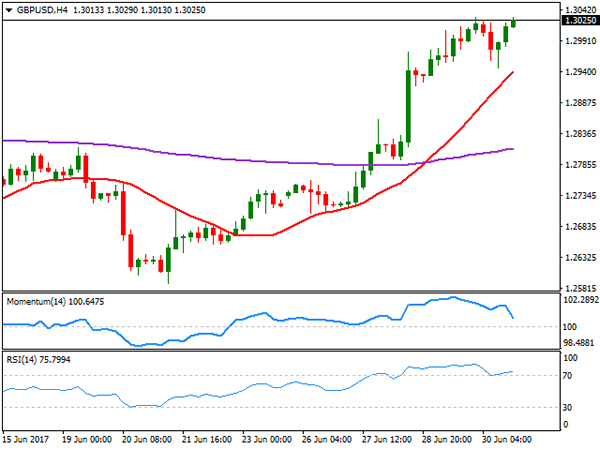
The GBP/USD pair closed the week with strong gains, settling at 1.3025, its highest since mid May, backed by dollar's weakness and the surprise change in BOE's Carney stance towards monetary policy. Two weeks after saying that rate raises were not on the table yet, Carney said that hikes may be "necessary" should the economy and wages recovery. Pound's recovery was also supported by the fact that PM May has finally managed to form a government, with no fresh Brexit headlines last week denting investors' sentiment. On Friday, the UK released its final revision of Q1 GDP, unchanged at 0.2% for the quarter. On Monday, attention will center on the Markit Manufacturing PMI for June. In the meantime, the daily chart for the picture shows that technical indicators pared gains amid an intraday correction on Friday, but remain near overbought levels, whilst the 20 DMA is barely gaining upward strength far below the current level. In the 4 hours chart, the Momentum indicator eased within positive territory, but the RSI indicator bounced after correcting to 70, maintaining its bullish slope, while the 20 SMA continues heading north below the current level, maintaining the risk towards the upside. Still, the pair has a major resistance in the 1.3040/50 region, where rallies were contained last May, and would need to clearly break above it to continue advancing.
Support levels: 1.2990 1.2965 1.2920
Resistance levels: 1.3045 1.3090 1.3130
GOLD
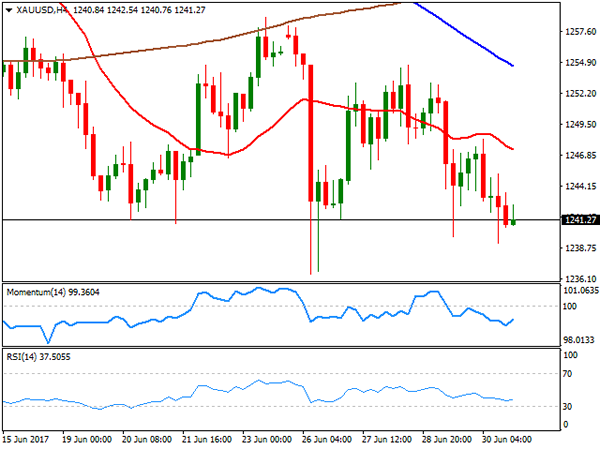
Gold prices closed the week in the red, with spot ending at $1,241.27 its lowest settlement in six weeks, undermined by gains in bold yields worldwide. The safe-haven metal came under selling pressure amid a shift in monetary policies' stances among central bankers, with rising speculation that most G10 banks are considering scaling back their monetary easing programs. Sluggish physical demand in Asia also weighed on the precious metal. The bearish stance is clear in the daily chart, as the price was contained by selling interest around the 100 DMA, while the 20 DMA accelerated its slide and is about to cross the longer one towards the downside. Technical indicators in the same time frame head lower within bearish territory, with the RSI indicator now at 39, anticipating some further slides ahead, moreover on a break below 1,236.48, the weekly low. In the 4 hours chart, the price develops below bearish moving averages, whilst technical indicators have pared their declines, but remain around their weekly lows, also in line with another leg lower ahead.
Support levels: 1,236.45 1,229.35 1,220.80
Resistance levels: 1,257.20 1,265.10 1,273.80
WTI CRUDE OIL
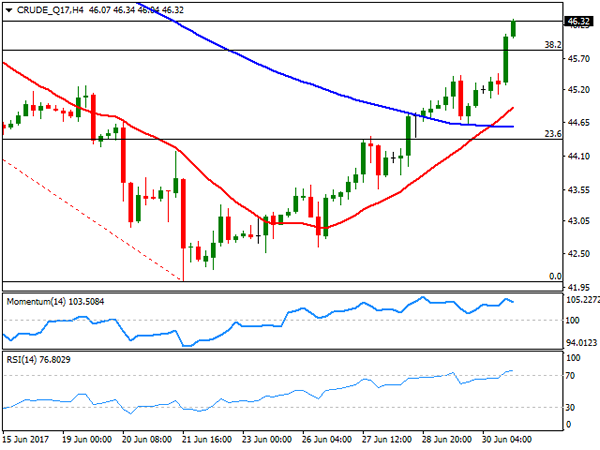
Crude oil prices continued advancing on Friday, closing at their highest in over two weeks, helped by signs of easing output in the US, as the Baker Hughes report showed that the number of active oil rigs fell by 2 last week, the first decline in January. The news added to the EIA report released mid-week, which showed that US crude output dropped 100,000 barrels per day in the week ended June 23rd. West Texas Intermediate crude oil prices ended the week at $46.32 a barrel, heading into the weekly opening with a bullish stance, as the price extended beyond the 38.2% retracement of its June slump, a 45.80, now the immediate support, whilst technical indicators head strongly higher above their mid-lines, as the price broke above its 20 SMA for the first time in almost a month. Shorter term, the 4 hours chart technical indicators have lost upward strength but remain within overbought readings, whilst the 20 SMA crossed above the 100 SMA below the current level, reflecting the ongoing upward strength and supporting some further advances on a break above 47.00, the 50% retracement of the mentioned decline and the immediate resistance.
Support levels: 45.80 45.20 46.60
Resistance levels: 47.00 47.60 48.10
DJIA
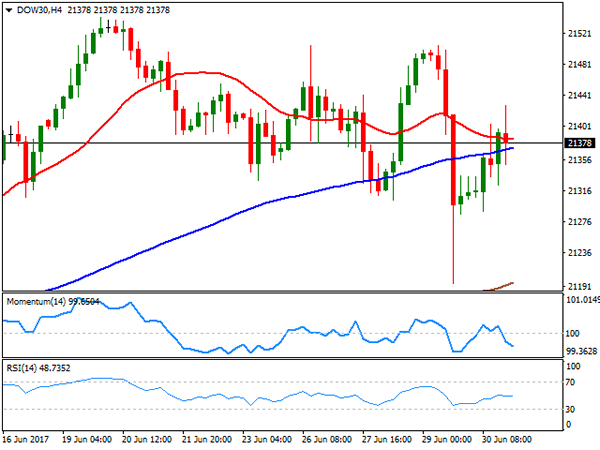
Wall Street closed mixed on Friday, with the Nasdaq Composite down 4 points to 6.140.42, but the Dow un 62 points, to 21,349.63 and the S&P adding 0.15%, to close at 2,423.31, on a recovery in tech sector and an advance in industrial-related equities. Also, higher oil prices sent the energy sector up 0.4%. US indexes closed the second quarter with a positive note, although momentum eased on the back of political uncertainty and the June's sell-off in tech equities. Within the Dow, most members closed higher, with Nike leading advancers, up 10.96%, followed by Caterpillar that added 1.72%. Goldman Sachs led decliners, down 1.12%, as banks followed the lead of their European counterparts, followed by Visa that shed 0.68%. The index presents a neutral-to-bullish stance in its daily chart as it settled right above a bullish 20 DMA, whilst technical indicators pared their retracement around their mid-lines, lacking directional strength into the weekly opening. In the 4 hours chart, the index is hovering around its 20 and 100 SMAs, both in a tight 20 points range, whilst technical indicators have retreated from their mid-lines, heading modestly lower and maintaining the risk towards the downside short term.
Support levels: 21,351 21,289 21,243
Resistance levels: 21,403 21,457 21,505
FTSE100
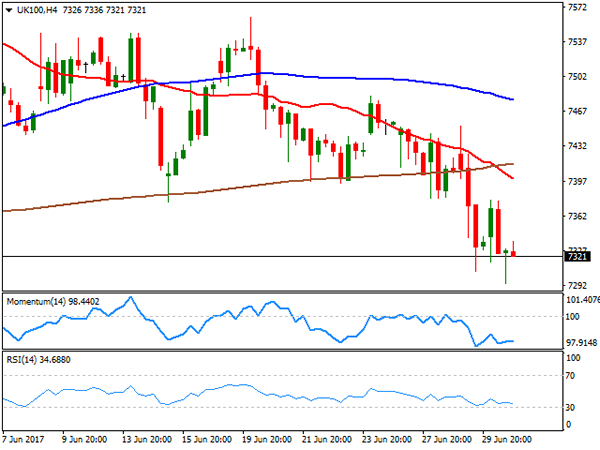
The FTSE 100 fell 37 points or 0.51% on Friday, to close at 7,321.72, with UK shares undermined by a resurgent Pound. Across the region, a setback in utilities and banks' shared weighed on investors' mood, and within the Footsie, United Utilities was the worst performer, down 3.45% after Credit Suisse cut its rating on the stock to "underperform" from "outperform." Royal Bank of Scotland was 2.25%. Mondi was the best performer, up 1.61%, followed by Smurfit Kappa that added 1.53%. From a technical point of view, the daily chart shows that the index settled below its 100 DMA, while the 20 DMA keeps gaining downward traction above it. Technical indicators in the same chart extended their slides, maintaining their bearish slopes near oversold territory. In the 4 hours chart, the technical picture is also bearish, with the benchmark developing below all of its moving averages, and technical indicators consolidating within negative territory, unable to bounce from near oversold levels.
Support levels: 7,294 7,256 7,210
Resistance levels: 7,336 7,361 7,402
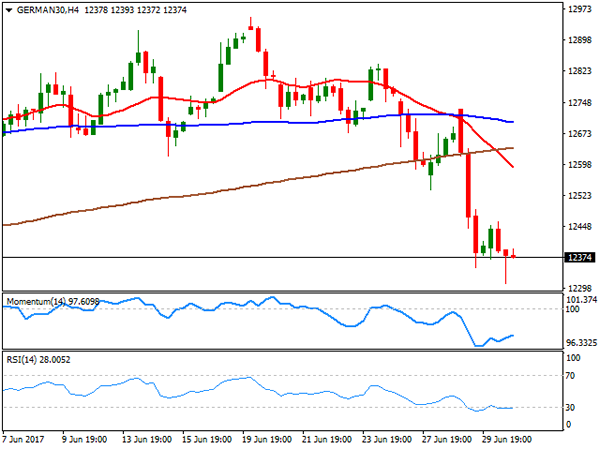
DAX
European equities closed in the red for a fourth consecutive day on Friday, with the German DAX down 90 points or 0.73%, to 12,325.10. Easing banks and chemical stocks offset a recovery in technology equities, with Bayer being the worst performer in Germany, down 3.69% after warning profit is under pressure. Deutsche Bank followed, with a 1.39% decline, while Adidas led advancers with a 2.67% gain. A stronger EUR weighed on local equities, reducing possible overseas revenues for local companies. The index settled at its lowest in two months, with the technical outlook increasingly bearish, as in the daily chart, it stands barely above its 100 DMA, currently at 12,310, while technical indicators pared losses, but are unable to bounce, remaining near oversold readings. In the 4 hours chart, the 20 SMA heads sharply lower after breaking below the 100 and 200 SMAs, all far above the current level, while technical indicators consolidate near oversold territory.
Support levels: 12,310 12,249 12,184
Resistance levels: 12,443 12,490 12,542
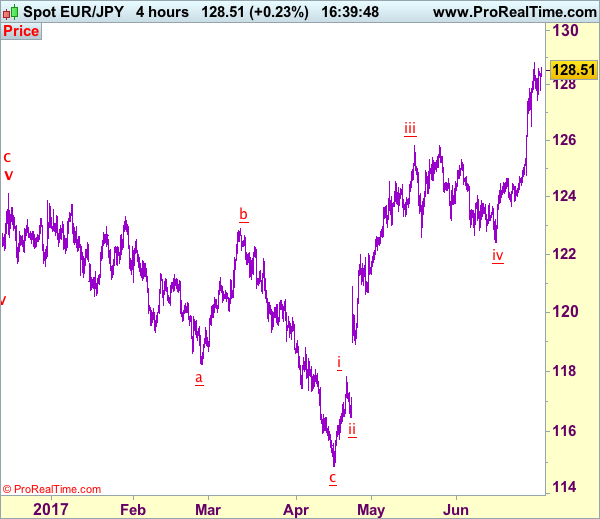
Trade Idea: EUR/JPY – Buy at 127.00
EUR/JPY - 128.44
Recent wave: wave v of (C) ended at 94.12 and major correction in wave A has ended at 149.79
Trend: Near term up
Original strategy:
Buy at 127.00, Target: 129.00, Stop: 126.40
Position: -
Target: -
Stop: -
New strategy :
Buy at 127.00, Target: 129.00, Stop: 126.40
Position: -
Target: -
Stop:-
The single currency ran into resistance at 128.83 last week and retreated, retaining our view that consolidation below this level would be seen and pullback to 127.50 is likely, however, reckon 127.00 would limit downside and bring another rise later, above said resistance at 128.83 would extend recent upmove to 129.00-10 but near term overbought condition should prevent sharp move beyond 129.50-60 and reckon psychological level 130.00 would hold from here, risk from there has increased for a retreat later.
In view of this, we are looking to reinstate long on pullback as 127.00 should limit downside. Below support at 126.49 would defer and suggest top is possibly formed, risk correction to 126.00 and later towards 125.40-50.
Our latest preferred count is that wave (ii) is ABC-X-ABC which ended at 123.33 and wave (iii) is unfolding with wave iii ended at 100.77, followed by wave iv at 111.57 and wave v as well as the wave (iii) has ended at 97.04, followed by wave (iv) at 111.43 and wave (v) has ended at 94.12 which is also the end of the larger degree v, this also implied the major wave (C) has also ended there, hence major correction has commenced from there with (A) leg unfolding in its lower degree wave c which has possibly ended at 145.69. Under this count, A-B-C wave (B) has commenced with A leg ended at 136.23, wave B at 143.79 and wave C has possibly ended at 149.79.
Our larger degree count is that the decline from 139.26 is wave (C) and is sub-divided into a diagonal triangle i-ii-iii-iv-v with wave i - 105.44, wave ii- 123.33, wave iii - 97.03, wave iv - 111.43, followed by the final wave v as well as the end of wave (C) at 94.12, this also mark the bottom of larger degree wave B. Under this count, major rise in wave C has commenced as an impulsive wave with minor wave III ended at 145.69, wave V is still in progress for further gain to 150.00. Having said that, this so-called wave V could well be the first leg of larger degree 5-waver wave C and this wave C should bring at least a retest of wave A top at 169.97 (July 2008).
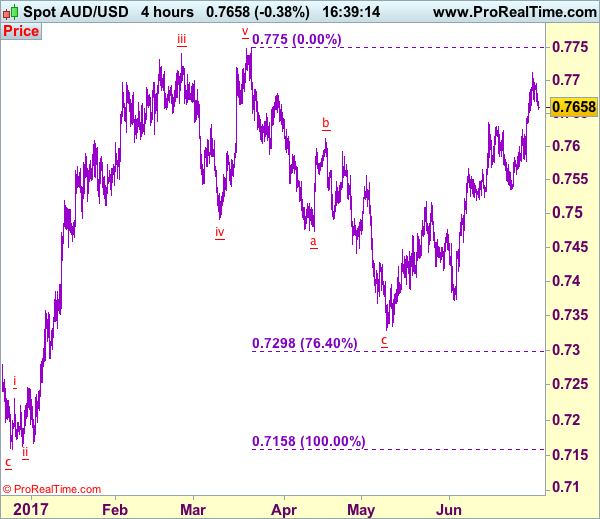
Trade Idea: AUD/USD – Stand aside
AUD/USD – 0.7659
Recent wave: Wave 5 ended at 1.1081 and major correction has commenced for fall to 0.7000 and then towards 0.6500-10
Trend: Near term up
Original strategy :
Exit long entered at 0.7595
Position: - Long at 0.7595
Target: -
Stop: -
New strategy :
Stand aside
Position: -
Target: -
Stop:-
Despite rising to 0.7712 late last week, the subsequent retreat has retained our view that minor consolidation below this level would be seen and pullback to 0.7635-40 is likely, however, a break below previous resistance at 0.7625 would suggest a temporary top is possibly formed, further all to 0.7575-80 but break there is needed to add credence to this view, bring correction of recent rise to 0.7535 support which is likely to hold from here.
In view of this, would be prudent to stand aside for now and look to reinstate long on pullback. Above said resistance at 0.7712 would extend recent upmove to chart resistance at 0.7750 but overbought condition should limit upside and price should falter below 0.7785-90.
On the 4-hour chart, the move from 0.8066 is the wave 5 with i: 0.8860, ii: 0.8315, wave iii is an extended move ended at 1.0183, iv: 0.9706 and wave v has ended at 1.1081 (also the top of entire wave 5). The subsequent selloff is the major correction which is unfolding as ABC-X-ABC and 2nd A leg has ended at 0.8848, followed by a-b-c wave B which ended at 0.9758, hence, 2nd C wave is now in progress and indicated downside target at 0.7000 and 0.6950 had been met, so further fall to 0.6710-20 cannot be ruled out.
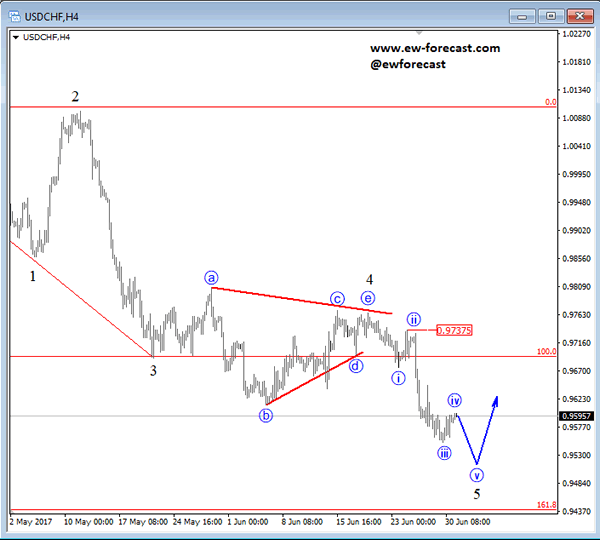
Elliott Wave Analysis: USDCHF Trading Lower Into Wave Five
USDCHF looks to have completed a bigger triangle correction in wave 4, from where a new drop followed recently. We now expect a new five wave movement to develop within black wave 5, before bears slowdown and make a new pullback higher. Ideally we will see Fibonacci ratio of 161.8 reached, before a new recovery starts to unfold. That said, at the moment we see minor wave iv unfolding.
USDCHF, 4H
EUR/USD Candlesticks and Ichimoku Analysis
Weekly
• Last Candlesticks pattern: Shooting star
• Time of formation: 03 May 2016
• Trend bias: Down
Daily
• Last Candlesticks pattern: Shooting star
• Time of formation: 3 May 2016
• Trend bias: Sideways
EUR/USD – 1.1384
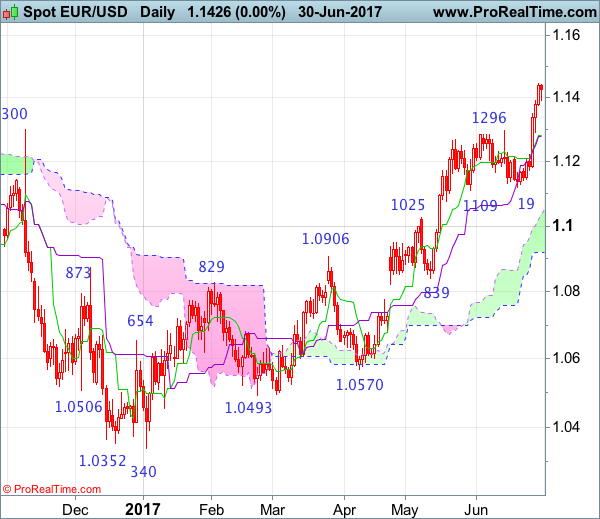
The single currency has surged again after brief pullback to 1.1172, suggesting recent upmove is still in progress and may extend further gain to 1.1450, then 1.1480-85 (50% projection of 1.0570-1.1296 measuring from 1.1119, however, loss of upward momentum should prevent sharp move beyond 1.1565-70 (61.8% projection) and reckon previous chart resistance at 1.1616 would hold from here, risk from there has increased for a retreat to take place later this month.
On the downside, whilst initial pullback to 1.1325-30 and possibly 1.1292 support cannot be ruled out, reckon the Kijun-Sen (now at 1.1278) would limit downside and bring another upmove later to our aforesaid upside targets. Below said support at 1.1172 would defer and suggest a temporary top is possibly formed, bring correction towards support at 1.1109-19 but only a daily close below there would provide confirmation, bring further fall to 1.1050 and then test of previous resistance at 1.1025.
Recommendation: Buy at 1.1270 for 1.1470 with stop below 1.1170.
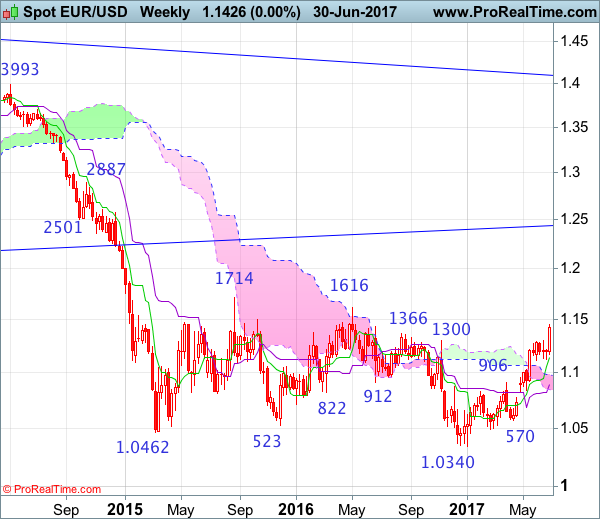
On the weekly chart, last week’s rally above previous resistance at 1.1296 confirms recent upmove from 1.0340 low is still in progress and a long white candlestick was formed, hence bullishness remains for this move to extend further gain to 1.1500-10, then 1.1565-70 (61.8% projection of 1.0570-1.1296 measuring from 1.1119), however, near term overbought condition would prevent sharp move beyond previous chart resistance at 1.1616 and price should falter below 1.1700-10, risk from there is seen for a retreat later.
On the downside, expect pullback to be limited to 1.1260-70 and support at 1.1172 should hold, bring another upmove later. A drop below 1.1172 would risk test of 1.1109-19 support but a weekly close below there is needed to signal a temporary top is formed, bring retracement of recent upmove to 1.10000, then test of the Kijun-Sen (now at 1.0950) but downside should be limited to 1.0900 and previous support at 1.0839 should remain intact.
British GDP Confirmed At 0.2% In March Quarter
'Fresh official data reveal how the economy slowed sharply at the start of the year as higher prices squeezed households.' — Chris Williamson, IHS Markit
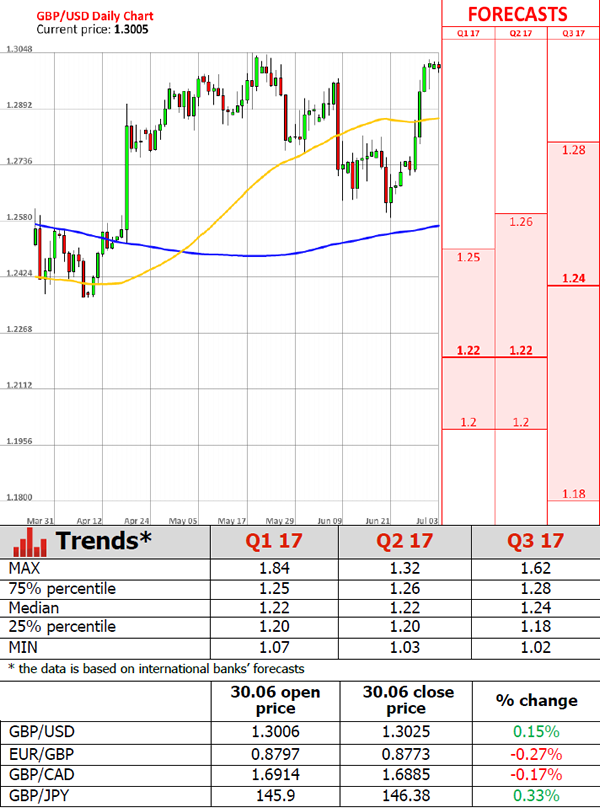
The UK economy showed a slow growth pace in the first quarter of the year, the weakest performance among European and G7 countries. The ONS reported that the country's GDP growth matched previous estimates of 0.2% in the Q1 of 2017, compared to a 0.7% increase in the Q4 of 2016. Both business services and construction sectors contributed to the Q1 UK economic expansion. The British economy, which successfully withstood in the Brexit vote aftermath, started to lag behind other developed countries. Economic growth in the Q1 weakened amid a slowdown in the consumer-focused industries, such as accommodation and retail sales, as well as diminished household spending power. Consumers' real income faced the most prolonged squeeze as price growth beat wage growth. Overall, trends in the main areas of the country's economy are set to be crucial for the Bank of England to decide whether to raise its key interest rates in the second half of the year or not. However, higher demand for UK exports and stronger manufacturing activity can potentially offset weak consumer spending.
Canadian Economy Grows 0.2% In April
'Canadian growth is slowing from a blistering end to last year and start of 2017, but is still in healthy enough territory to chew up what's left of economic slack.' —Nick Exarhos, CIBC
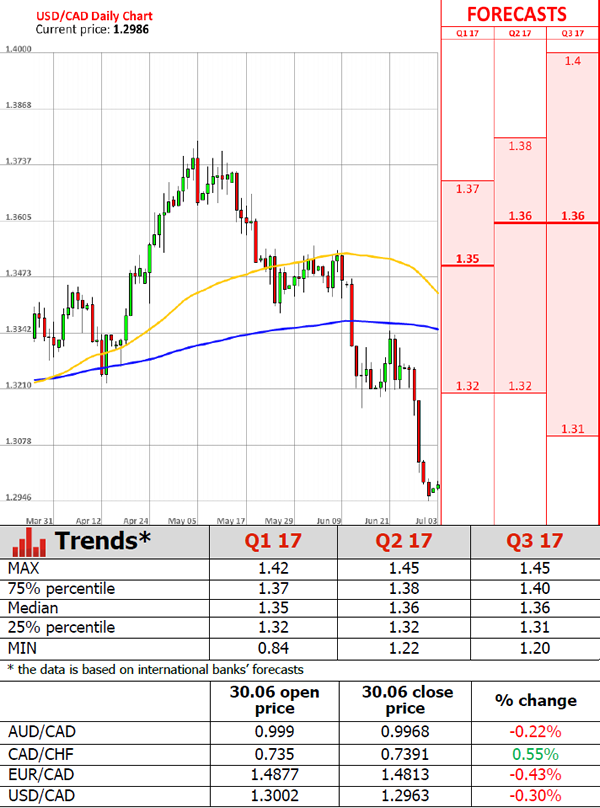
Canada's economic output posted the sixth straight month of expansion in April, contributed by improvements in most sectors. Statistics Canada reported on Friday that the country's GDP rose 0.2% in the fourth month of the year, following March's 0.5% gain and matching analysts' forecasts. The increase was mainly driven by services activity, with a 0.5% advance in both retail sales and wholesale trade. The report showed that 14 of 20 sectors expanded in April. On a yearly basis, the Canadian economy expanded 3.3% in the reported month, its strongest growth pace in almost three years. The largest annual increase of 5.6% was registered in the warehousing and transporting sector, supported by a rise in rail transport. Strong data suggested the Bank of Canada would be more optimistic amid the country's strong economic performance. Moreover, the economy is expected to reach full employment by the end of the year, which is one more reason to lead to a rate hike. Stephen Poloz, the BoC Governor, pointed out that two previous rate cuts did their job and the economy was now on a firmer ground despite lower oil prices.
Daily Technical Analysis: EUR/USD Bullish Breakout Suggests A Possible Continuation
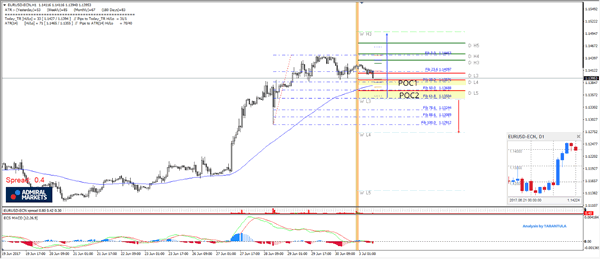
The EUR/USD has made 3 consecutive bullish candles on daily(see the mini chart on the main chart) and the first candle from those 3 is a bullish marubozu that usually suggests a continuation. We see that the continuation has already happened but the W H3 hasn't been reached so we might see a pullback before the next leg up. We have 2 POC zones where the price could possibly reject. POC 1.3370-84 (D L4, 38.2, EMA89, ATR pivot) marks the important L4 camarilla support zone while POC2 1.1350-65 ( 61.8, ATR Low, D L5 historical buyers) marks the final support zone before we see a deeper retracement towards W L4 camarilla that might slow the uptrend continuation. If the price rejects from any POC watch for 1.1445 and 1.1500.
Technical Outlook: GBPUSD – Hanging Man Candle Warns Of Deeper Pullback
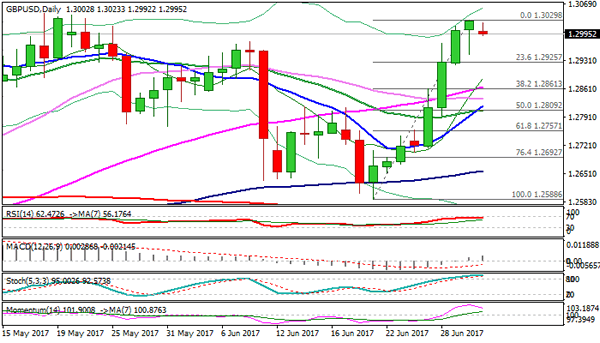
Cable is consolidating under fresh high at 1.3029, where last week's steep ascend peaked. Today's action is still holding within narrow range, so far contained by psychological 1.3000 support (top of thick hourly cloud), but stronger correction of 1.2588/1.3029 could be anticipated. Strongly overbought slow stochastic on daily chart suggests further easing, with notion being supported by Hanging Man candle formed on Friday. Loss of 1.3000 handle would open at 1.2944 (Friday's low) and strong support at 1.2910 (daily cloud top). Dips should ideally find support here, however, deeper pullback towards 1.2860 (Fibo 38.2% of 1.2588/1.3029) and 1.2836 (30SMA) cannot be ruled out. Bull-cross of 10/20SMA's underpins the action at 1.2808.
Res: 1.3029, 1.3047, 1.3081, 1.3120
Sup: 1.2990, 1.2977, 1.2944, 1.2910
Forex Technical Analysis: EUR/USD, USD/JPY, GBP/USD
EUR/USD
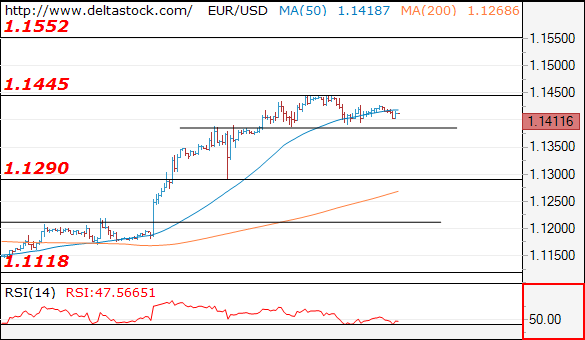
Current level - 1.1411
The intraday outlook is bearish below 1.1445 peak, for a break through 1.1385, towards 1.1290 major support. The latter is expected to provide a reliable base for another leg upwards, to 1.1550 area.
| Resistance | Support | ||
| intraday | intraweek | intraday | intraweek |
| 1.1450 | 1.1450 | 1.1385 | 1.1020 |
| 1.1550 | 1.1610 | 1.1290 | 1.0838 |
USD/JPY
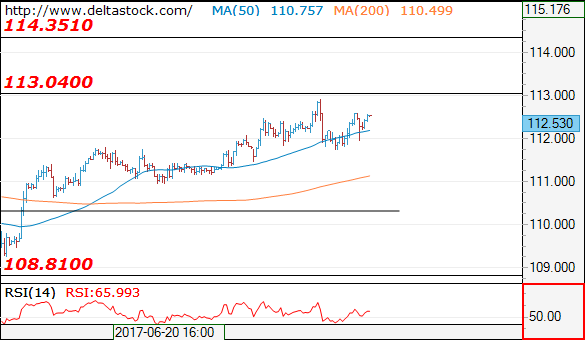
Current level - 112.53
My outlook here is bearish below 113.00 resistance, for another corrective leg to 111.30 before advancing towards 114.35.
| Resistance | Support | ||
| intraday | intraweek | intraday | intraweek |
| 113.10 | 113.10 | 111.70 | 110.30 |
| 113.10 | 114.30 | 111.30 | 108.81 |
GBP/USD
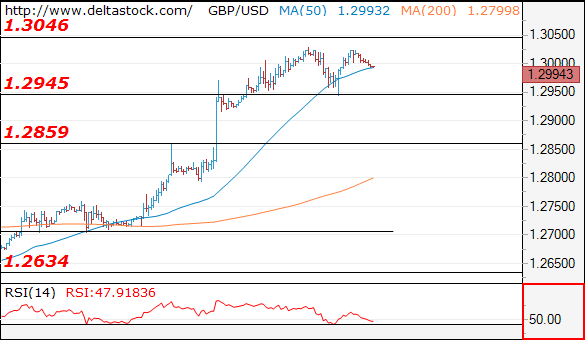
Current level - 1.2994
The pair is in a consolidation pattern between 1.3050 and 1.2950 and a break through the lower bounday will target 1.2860 static support.
| Resistance | Support | ||
| intraday | intraweek | intraday | intraweek |
| 1.3050 | 1.3130 | 1.2950 | 1.2635 |
| 1.3130 | 1.3500 | 1.2850 | 1.2480 |