Sample Category Title
EUR/USD Elliott Wave Analysis
EUR/USD – 1.1381
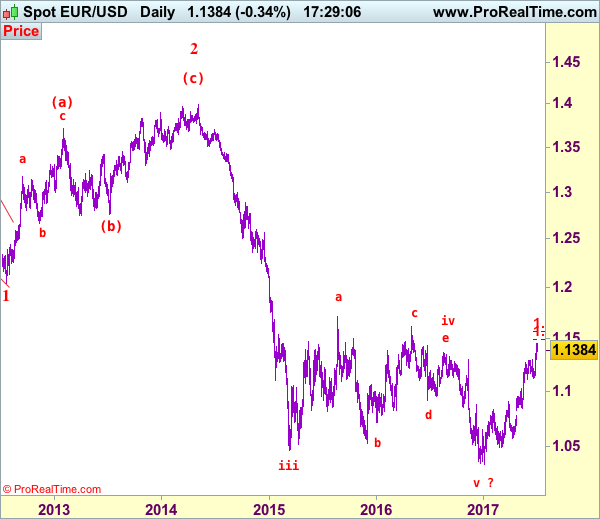
EUR/USD: Wave (c) of 2 ended at 1.3993 and wave 3 of III has commenced for weakness to 1.0411 (1.236 of wave 1), then 1.0000.
Last week’s rally above previous resistance at 1.1296 (now support), adding credence to our bullish view that the upmove from 1.0340 low is still in progress and may extend further gain to 1.1480-85 (50% projection of 1.0570-1.1296 measuring from 1.11190, then towards 1.1565-70 (61.8% projection), however, loss of upward momentum should prevent further sharp move and minor wave v is likely to be limited to previous chart resistance at 1.1616, risk from there is seen for a retreat later.
Our preferred count on the daily chart remains that a wave (II) from 1.2329 ended at 1.5145 with A-leg ended at 1.4720, followed by wave B at 1.2457, the wave C from there was also a 3 legged move and is labeled as (a): 1.3739, (b): 1.2885, the wave iii of the 5-waver (c) from 1.2885 has ended at 1.4339 and wave iv is a triangle ended at 1.3878 and wave v formed a top at 1.5145. The decline from there is a 5-waver (C) with minor wave (i) of I of (C) ended at 1.4218 with wave (ii) ended at 1.4580, wave (iii) ended at 1.3267 and wave (iv) ended at 1.3692 and wave (v) ended at 1.1876, this is also the low of wave I of (C) and wave II ended at 1.4940, hence wave III is now in progress with a diagonal wave 1 ended at 1.2042, the breach of previous support at 1.1876 (wave I trough) adds credence to our view that the wave 2 has ended at 1.3993, wave 3 has commenced for further weakness to 1.0411, then towards 1.0000.
On the downside, whilst initial pullback towards said previous resistance at 1.1296 cannot be ruled out, reckon downside would be limited to 1.1200-10 and bring another rise later. Below 1.1170-75 would defer and risk test of support at 1.1109-19, however, a daily close below there is needed to signal a temporary top is formed instead, bring correction of recent upmove to previous resistance at 1.1025 but only a firm break below there would provide confirmation, bring further fall to 1.0975.
Recommendation: Buy at 1.1200 for 1.1400 with stop below 1.1100
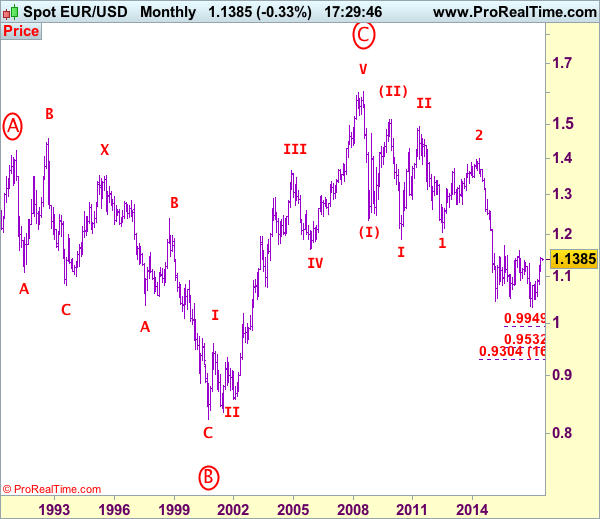
Euro's long-term uptrend started from 0.8228 (26 Oct 2000) with an impulsive structure. The rise from 0.8228 to 0.9593 (5 Jan 2001) is labeled as wave I, the retreat to 0.8352 (6 Jul 2001) is wave II and the rally to 1.3670 (31 Dec 2004) is wave III. Wave IV from there ended at 1.1640 (15 Nov 2005), the subsequent upmove to 1.6040 (July 15, 2008) is treated as wave V, the major selloff from the record high of 1.6040 to 1.2329 (October 27, 2008) signals a reversal has taken place with (I) leg ended at 1.2329 and once (II) ended at 1.5145, wave (III) itself is an extended move with I: 1.1876 and complex wave II ended at 1.4902, wave III has commenced with wave 1 and 2 ended at 1.2042 and 1.3993 respectively, wave 3 of III is now unfolding for weakness towards parity.
USD: Biggest Quarterly Drop In Almost 7 Years
USD recovered marginally on Friday, but had its biggest quarterly decline against several currencies in nearly 7 years following hawkish signals from many central banks last week that put additional downward pressure on USD.
The markets had higher expectations of tighter monetary policies following various comments from officers at the European Central Bank, Bank of England and the Bank of Canada. Current US economic data is adding further doubts as to the likelihood that the Federal Reserve will be able to increase interest rates further this year, which further adds to USD being less attractive to investors.
The Dollar Index declined approximately 4.6% in the second quarter – the largest quarterly decline since Q3 2010. On Friday, the Dollar Index closed at 95.638 a 0.1% increase on the day. Currently the index is trading at 95.76
EURUSD gained more than 7% in the quarter – it's largest quarterly increase since Q3 2010. EURUSD reached levels last week not seen since last year's Brexit vote trading up to 1.14445 – fueled by expectations that the ECB will move away from its 'ultra-easy' monetary policy. Currently EURUSD is trading just above 1.1400.
GBPUSD continued to show strength after breaking 1.3000 last week to trade as high as 1.30291 on Friday. For the second quarter GBPUSD was up nearly 3.5%. Currently GBPUSD is trading just below 1.3000 with traders awaiting this morning's PMI report for further guidance.
USDJPY ended the week with a small 0.2% loss to close at 112.38. JPY briefly gained on concerns that Japanese PM Shinzo Abe's reflationary policies may suffer following the weekend defeat of his Liberal Democrat Party defeat in local elections – although this was a short lived as USDJPY is currently trading above 112.50.
Gold experienced its first monthly decline of the year to close on Friday at $1,242 (which is down $15 from last weeks close). Gold has slipped further over the weekend to currently trade just below $1,237.
WTI rose approximately 2.8% on Friday to close at $46.35pb. Oil gained more than 5 % on the week, helped by government data showing a drop in U.S. gasoline supplies that had remained high at the start of the summer driving season. However, Oil prices are down 15% this year – marking Oil's worst H1 performance in 19 years. The markets will now be looking to see if the typical summer demand helps bolster prices. WTI is currently trading round $46.35pb with Brent trading just below $49.00pb.
This week will be somewhat 'condensed' with the July 4th holiday tomorrow. Markets will be looking for more indications as to the 'state' of the US economy with Employment Data, Unemployment and, the always volatile, Non-Farm Payroll report all due out later this week. Today, at 9:30 BST sees the UK's Markit Manufacturing PMI released. The figure is expected to show a slight decrease to 56.4 from the previous release of 56.7. At 15:00 BST, ISM Manufacturing PMI for June be released. Expectations call for a figure of 55.0 (previously 54.9), at the same time ISM Prices Paid for June will be released, with the market expecting a figure of 58.8, slightly below the previous 60.5.
USD/JPY Elliott Wave Analysis
USD/JPY - 112.86
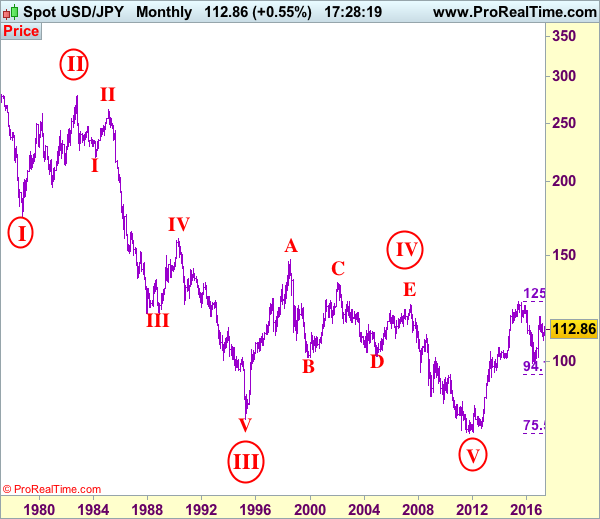
USD/JPY – Wave V of larger degree circle V has possibly ended at 75.31 and major correction has commenced and already met indicated target at 125.00.
Although the greenback has risen again after brief pullback on cross-selling in yen and initial mild upside risk remains for marginal gain from here, as this move is viewed as retracement of the fall from 114.39, reckon upside would be limited to 113.00-10 and bring retreat later. Below 111.70-75 would bring weakness to 111.00, however, break of 110.95 support is needed to signal top is formed, bring further fall to 110.35 and possibly towards 110.00 but reckon downside would be limited to 109.50-60 and indicated support at 108.82 would continue to hold, bring another rebound later.
Our preferred count is that, triangle wave IV (with circle) ended at 101.45 and the circle wave V brought dollar down to the record low of 75.31 in 2011 and the subsequent rebound signal major correction has commenced with A leg ended at 84.19, followed by wave B at 77.14 and impulsive wave C is now unfolding (indicated upside target at 125.00 had been met) for gain towards 127.00 level. In the event dollar drops below support at 99.01, this would confirm medium term decline from 125.86 top (2015 high) has resumed for subsequent weakness to 98.00 and possibly 97.00.
Under this count, this wave C is unfolding as impulsive waves with (1) (2), 1 2 ended at 80.67, 79.07, 82.84 and 81.69 respectively, hence the extended wave 3 has ended at 103.74 and wave 4 correction of recent upmove should bring weakness to 92.57, then towards 90.88 but psychological support at 90.00 should limit downside and bring another rally later in wave 5, indicated target at 125.00 had been met and gain to 127.00 cannot be ruled out but reckon price would falter below 130.00.
On the upside, whilst initial marginal gain from here cannot be ruled out, reckon upside would be limited to previous support at 113.12, bring another decline later. A daily close above this level would abort and suggest the fall from 114.39 has ended, risk further gain to 113.85-90, however, said resistance at 114.39 should remain intact, bring another decline later.
Recommendation: Hold short entered at 112.50 for 110.50 with stop above 113.50.

On the monthly chart, we have changed our preferred count that an impulsive wave is unfolding with major wave III with circle ended at 79.75, then followed by wave IV with circle and is labeled as a triangle with A: 147.64 (11 August, 1998), B: 101.25, C: 135.20, D: 101.67 and E leg ended at 124.14 to end the wave IV with circle. Hence, wave V with circle commenced from there and hit a record low of 75.31, however, the subsequent strong rebound signals this circle wave V has possibly ended there, hence gain to (indicated upside target at 122.00 and 125.00 had been met), the retreat from 125.86 suggests wave A of major correction has ended there and wave B correction back to 99.00, then 95.00 would be seen, however, reckon downside would be limited to 90.00, bring another rebound in wave C next year.
GOLD Strong Bearish Momentum, SILVER Weakening, CRUDE OIL Pushing Lower.
GOLD Strong bearish momentum.
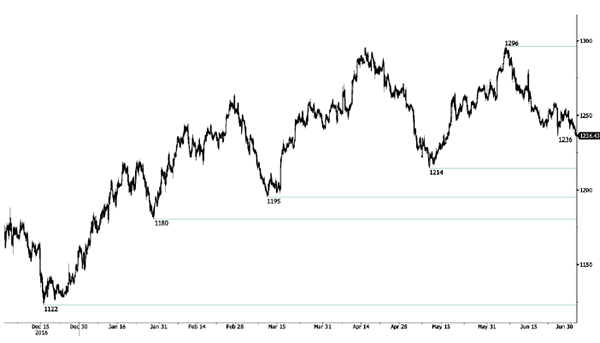
Gold's is trading lower. The commodity has broken hourly support located at 1236 (26/06/2017 low). Stronger support is given at 1214 (09/05/2017 low). Hourly resistance can be found at 1258 (23/06/2017 high). Expected to show renewed bullish pressures.
In the long-term, the technical structure suggests that there is a growing upside momentum. A break of 1392 (17/03/2014) is necessary ton confirm it, A major support can be found at 1045 (05/02/2010 low).
SILVER Weakening.
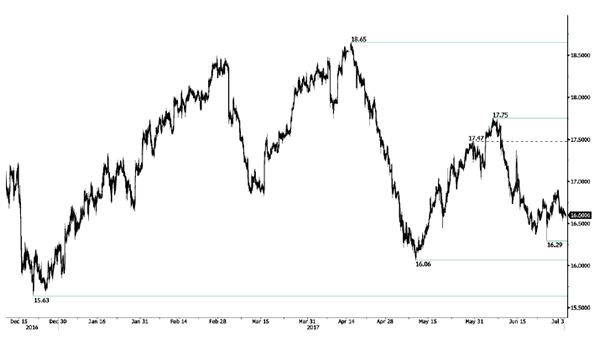
Silver's bullish bounce quickly faded. Closest support is given at 16.29 (26/06/2017 low). Strong support is given at 16.06 (09/05/2017 low). Key resistance is given at a distance at 17.75 (06/06/2017 high). The road seems wide open for further decline.
In the long-term, the death cross indicates that further downsides are very likely. Resistance is located at 25.11 (28/08/2013 high). Strong support can be found at 11.75 (20/04/2009).
CRUDE OIL Pushing lower.
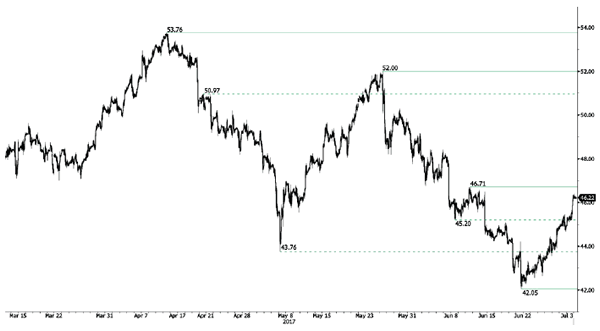
Crude oil is now consolidating higher since the commodity hit 11-month low towards resistance at 46.71 (12/06/2017 high). Support is given at 42.05 (21/06/2017 low). Expected to show renewed weakness.
In the long-term, crude oil has recovered after its sharp decline last year. However, we consider that further weakness are very likely. Strong support lies at 35.24 (05/04/2016) while resistance can now be found at 55.24 (03/01/2017 high).
EUR/JPY Bullish Consolidation, EUR/GBP Slight Weakness, EUR/CHF Recovery Gains Strength.
EUR/JPY Bullish consolidation.
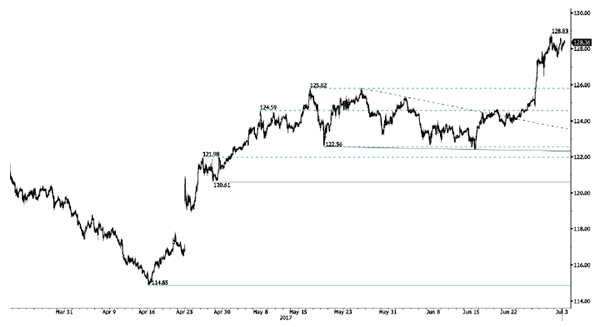
EUR/JPY is now consolidating after its recent rally. Key resistance is located at 128.83 (30/06/2017). Hourly support can be found at 127.10 (30/06/2017). Next support is given at 122.56 (18/05/2017 low). Further upside is favored.
In the longer term, the technical structure validates a medium-term succession of lower highs and lower lows. As a result, the resistance at 149.78 (08/12/2014 high) has likely marked the end of the rise that started in July 2012. Strong support at 94.12 (24/07/2012 low) looks nonetheless far away.
EUR/GBP Slight weakness.
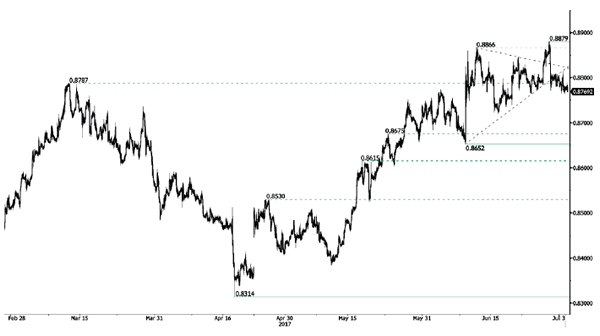
EUR/GBP has broken downtrend resistance triggering a move towards 1.0987. Hourly support can be located at Support can be found at 0.8652 (08/06/2017 low). Expected to show further consolidation.
In the long-term, the pair has largely recovered from recent lows in 2015. The technical structure suggests a growing upside momentum. The pair is trading above from its 200 DMA. Strong resistance can be found at 0.9500 psychological level.
EUR/CHF Recovery gains strength.
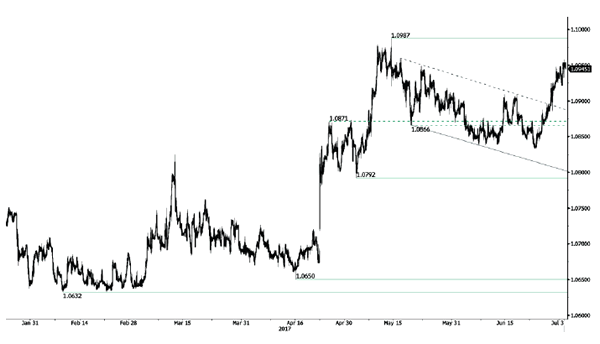
EUR/CHF's short-term bullish pressures are definitely on after clear break of downtrend channel. Hourly support is located at a distance at 1.0792 (03/05/2017 low) while the pair is heading towards resistance given at 1.0987 (12/05/2017 high).
In the longer term, the technical structure is mixed. Resistance can be found at 1.1200 (04/02/2015 high). Yet,the ECB's QE programme is likely to cause persistent selling pressures on the euro, which should weigh on EUR/CHF. Supports can be found at 1.0184 (28/01/2015 low) and 1.0082 (27/01/2015 low).
USD/CHF Bullish Consolidation, USD/CAD Bearish Breakout, AUD/USD Consolidating.
USD/CHF Bullish consolidation.
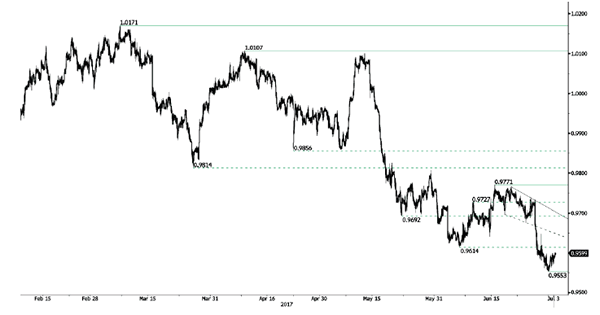
USD/CHF remains weak as long as prices remain below the key resistance at 0.9647 (28/06/2017 high). Hourly resistance can be found at 0.9771 (09/06/2017 high). Strong resistance is given at 1.0107 (10/04/2017 high). Hourly support is given at 0.9553 (intraday low). Expected to show continued bearish pressures.
In the long-term, the pair is still trading in range since 2011 despite some turmoil when the SNB unpegged the CHF. Key support can be found 0.8986 (30/01/2015 low). The technical structure favours nonetheless a long term bullish bias since the unpeg in January 2015.
USD/CAD Bearish breakout.
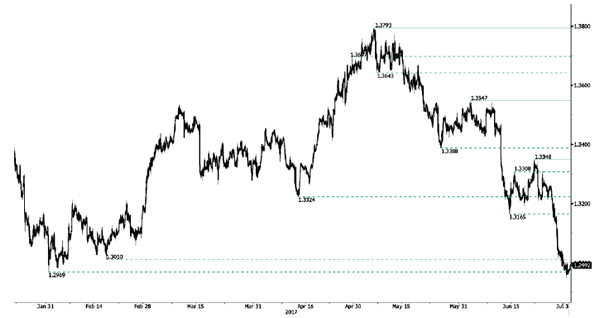
USD/CAD is way into bearish mode. Strong support given at 1.2969 (31/01/2017 low) has been broken. Resistance is located at 1.3010 (02/15/2017). Expected to show continued downside pressures.
In the longer term, the pair lies in a bullish channel since a year. Strong resistance is given at 1.4690 (22/01/2016 high). Long-term support can be found at 1.2461 (16/03/2015 low).
AUD/USD Consolidating.
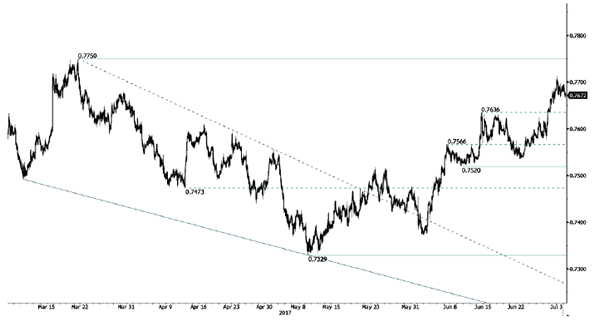
AUD/USD's technical structure is bullish since early May. Recovery bounce near former resistance at 0.7636 is gaining momentum. The pair is heading towards strong resistance at 0.7750 (21/03/2017 high).
In the long-term, we are waiting for further signs that the current downtrend is ending. Key supports stand at 0.6009 (31/10/2008 low) . A break of the key resistance at 0.8295 (15/01/2015 high) is needed to invalidate our long-term bearish view.
EUR/USD Starting A Consolidation Phase, GBP/USD Stalling Below Support Given At 1.3046, USD/JPY Strengthening Again.
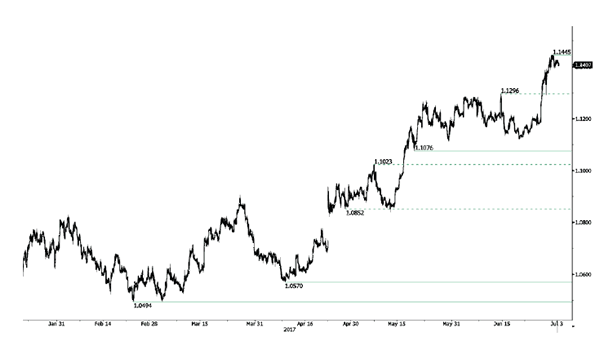
EUR/USD Starting a consolidation phase.
EUR/USD is now consolidating after its recent rally above 1.1400. Hourly support can be found at 1.1076 (18/05/2017 low). Stronger support lies at 1.0842 (11/05/2017 low).
In the longer term, the momentum is clearly negative. We favour a continued bearish bias towards parity. Key resistance holds at 1.1714 (24/08/2015 high) while strong support lies at 1.0341 (03/01/2017 low).
GBP/USD Stalling below support given at 1.3046.
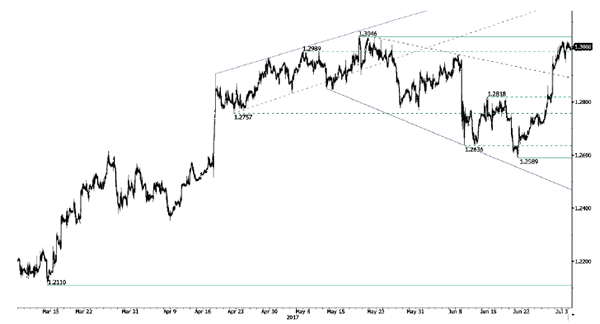
GBP/USD's momentum is higher than expected and the pair is now targeting key resistance give at 1.3046 (18/05/2017 high). Hourly support is given at 1.2589 (21/06/2017 low). Hourly resistance at 1.2818 (14/06/2017 high) has been broken. Expected to show further continued buying pressures.
The long-term technical pattern is even more negative since the Brexit vote has paved the way for further decline. Long-term support given at 1.0520 (01/03/85) represents a decent target. Long-term resistance is given at 1.5018 (24/06/2015) and would indicate a long-term reversal in the negative trend. Yet, it is very unlikely at the moment.
USD/JPY Strengthening again.
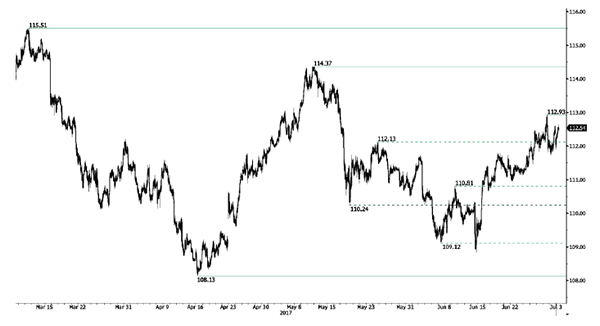
USD/JPY is back to bullish after strong bullish rally while remaining within an uptrend channel. Hourly support can be found at 111.73 (30/06/2017 low). Strong support is located at 108.13 (17/04/2017 low). Expected to show continued pressures.
We favor a long-term bearish bias. Support is now given at 96.57 (10/08/2013 low). A gradual rise towards the major resistance at 135.15 (01/02/2002 high) seems absolutely unlikely. Expected to decline further support at 93.79 (13/06/2013 low).
USD Bounces Back As Investors Refocus On Tightening
AUD extends losses as the greenback bounces back
After a painful week, the US dollar started the week on the front foot, extending gains against most of its peers. The dollar index tumbled 2% last week amid a sharp appreciation of the single currency (+2.07%), the loonie (2.34%) and the pound (+2.41%). The Japanese yen was the sole G10 currency to lose ground (-1%) as investors returned to riskier assets, searching for yields.
Despite a solid performance last week, the Australian dollar was no exception this morning as it slid 0.22% against the greenback. The Aussie has been trading within a compact upside channel since May 9th, with AUD/USD rising from 0.7329 to 0.7712, a 5.20% ride. However, it seems the party is coming to an end.
Building approvals figures, which were due earlier this morning, came in well below estimates, contracting -19.7% y/y, or -5.6% on a monthly basis, signalling that the cooling in Australia's residential housing market has become a trend. This contraction in new homes approval has two main effects.
On the one hand, the slowdown in construction will weigh on the economy in H2, while it was a solid growth driver over the last few years. On the other hand, it gives a breath of fresh air to the Reserve Bank of Australia, giving it the freedom to adjust freely its monetary policy, without having to worry about fuelling the housing bubble.
A key resistance lies at 0.7750 (high from March 21st), then 0.7849 (high from June 18th 2015). On the downside, the closest support can be found at 0.7566 (Fibo 38.2% on May-June rally). As reported by the CFTC, net long speculative position reached 21.95% of total open interest as of June 27th. A potential unwinding of those positions creates significant downside risk in AUD/USD.
Political upset in Japan
The global wave of populism has finally reach Japan's shores. In an historic upset, Tokyo Governor Yuriko Koike's Tokyo Citizens First Party and its partners won a clear victory at Sunday's Tokyo Metropolitan assembly election.
The political party, practically unknown outside of Tokyo. secured 79 of the government's 127 seats and saw the LDP representations collapse to an all-time low of 23 seats.
The unprecedented outcome indicates that Japan is increasing frustrated with the PM Able administration and LDP leaders. Domestic issues such as Tokyo Olympic preparations, granting approvals of private schools and fast-tracking anti-terrorism legislations have all added up.
This serves warning that on a national level anti-Abe sentiment will further erode LDP support. However, the largest opposition force - the Democratic Party - is also suffering from weak approval ratings.
While the election results had minimal impact on financial markets, in the longer term this result will challenge Abenomics and the ultra-accommodating monetary policy driven by the BoJ.
A reversal of current policy would have a profound effect, as the strategy is critically supporting equity prices and keeping the yen weak. Should the BoJ further back off asset purchases and pinning the yield curves, the yen would easily rally higher pushed USDJPY towards 90.
Currently the ultra interest rate sensitive USDJPY will be driven by a shift in the US / JP rate differential. With Japan's rates stuck, it will be US short end yields that should push USDJPY higher. The market is currently underpricing the Fed commitment to higher interest rates including, what we expect, a 25bp rate hike in December. As US data firms and Fed comments support interest rate tightening, we target 114 with a fully priced-in December hike.
Trade Idea: GBP/USD – Buy at 1.2870
GBP/USD – 1.2968
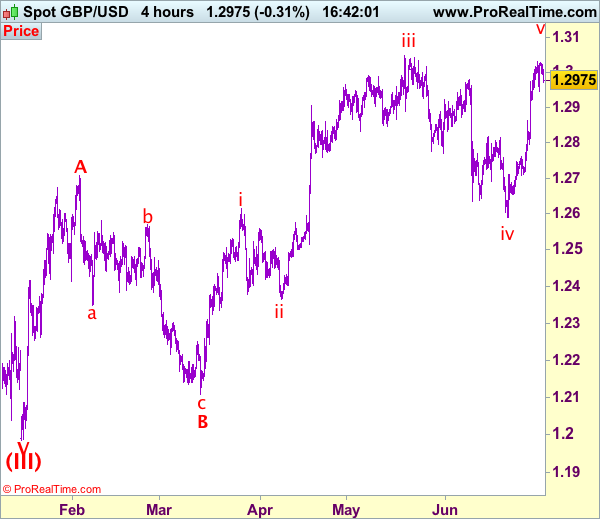
Recent wave: Wave V of larger degree wave (III) has ended at 1.1986 and major correction has commenced from there for gain to 1.3000 and 1.3140-50
Trend: Near term up
Original strategy :
Buy at 1.2870, Target: 1.3020, Stop: 1.2810
Position: -
Target: -
Stop: -
New strategy :
Buy at 1.2870, Target: 1.3020, Stop: 1.2810
Position: -
Target: -
Stop:-
As sterling has retreated after faltering below last week’s high at 1.3030, retaining our view that minor consolidation below this level would be seen and pullback to support at 1.2916 cannot be ruled out, however, reckon previous resistance at 1.2861 would turn into support and limit cable’s downside, bring another rise later, above said resistance at 1.3030 would extend the rise from 1.2589 low towards recent high at 1.3048 but break there is needed to retain bullishness and bring subsequent headway towards 1.3090-00.
Our preferred count on the daily chart is that cable's rebound from 1.3500 (wave (A) trough) is unfolding as a wave (B) with A ended at 1.7043, followed by triangle wave B and wave C as well as wave (B) has ended at 1.7192, the subsequent selloff is the larger degree wave (C) which is still unfolding with minor wave (III) of larger degree wave 3 ended at 1.1986, hence wave (IV) correction is in progress which could either be a triangle wave (IV) of a complex formation but upside should be limited to 1.3500 and price should falter well below 1.4000, bring another decline in wave (V) of 3 for weakness to 1.1500, then 1.1200.
On the downside, whilst initial pullback to 1.2900-10 is likely, reckon 1.2861 (previous resistance turned support) and bring such a rise. Below support at 1.2794 would abort and signal top is formed instead, risk further fall to 1.2750, then towards 1.2706 support.
Trade Idea: GBP/JPY – Buy at 144.50
GBP/JPY - 146.35
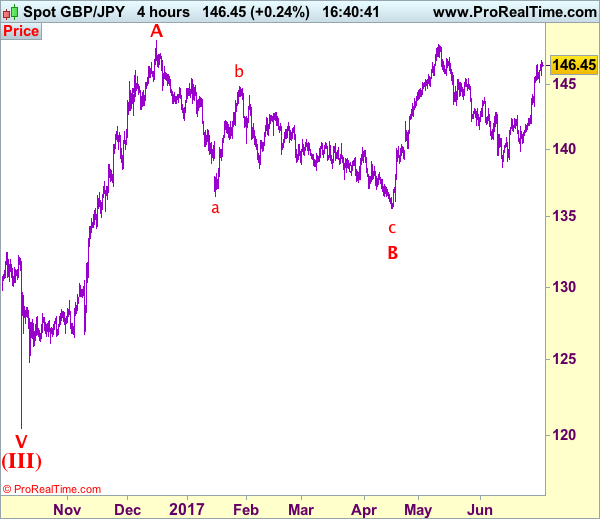
Recent wave: Medium term low formed at 120.50 and (A)-(B)-(C) major correction has commenced with (A) leg ended at 148.45, hence wave (B) is unfolding for retreat to 131.00-10.
Trend: Near term down
Original strategy:
Buy at 144.30, Target: 146.30, Stop: 143.70e
Position: -
Target: -
Stop: -
New strategy :
Buy at 144.30, Target: 146.30, Stop: 143.70
Position: -
Target: -
Stop:-
Although sterling has risen again and recent upmove may extend further gain to 147.10 (previous resistance), loss of near term upward momentum should prevent harp move beyond 147.50-60 and price should falter below recent high at 148.10, risk from there is seen for a retreat later. Below 145.65-70 would bring pullback to 145.10-15, however, downside should be limited to 144.50-60 and bring another upmove later.
In view of this, would not chase this rise here and we are looking to buy sterling on subsequent pullback as previous resistance at 144.20 should limit downside and bring another rise. Below 143.90-00 would defer but only break of support at 143.30 would signal top is formed instead, bring correction to 142.90-00.
Our preferred count is that larger degree wave V with circle is unfolding from 251.12 with wave (I) 219.34, (II): 241.38 and wave (III) is subdivided into 1: 192.60, 2: 215.89 (23 Jul 2008) and wave 3 ended at 118.87 earlier in 2009. The correction from there to 162.60 is wave 4 which itself is a double three and is labeled as first a-b-c ended at 151.53, followed by wave x at 139.03, 2nd a ended at 162.60, 2nd b at 146.75 and 2nd c leg of wave 4 ended at 163.00. Therefore, the decline from 163.00 to 116.85 is now treated as wave 5 which also marked the end of larger degree wave (III), hence wave (IV) major correction has commenced for retracement of the wave (III) from 241.38 and upside target at 183.95-00 (50% Fibonacci retracement of the wave (II) from 241.38) had been met, a drop below 160.00 would suggest wave (IV) has ended at 195.85, bring decline in wave (V) for initial weakness to 130 (already met) and 120.