Sample Category Title
GBP/USD Analysis: Has Lost Upside Momentum
GBP/USD was not able to maintain its upside momentum, resulting in a fall down to the 55-hour SMA. Subsequently, the pair returned near Friday’s upside limit circa 1.3030 and depreciated once more down to the 55-hour SMA. Technical indicators suggest that the Pound may still respect the boundaries of the ascending channel in this trading session, but the 1.3050/60 area may limit its gains. The upside trend is non-existent at this point; thus a possible move sideways should breach the bottom channel line on Tuesday. The Pound may find support at the 55-hour SMA once again; however, bearish sentiment may prevail and push the British currency below the given level. In case of strong downside risks, the rate is likely to be supported by the 100-hour SMA near 1.2950.
EUR/USD Analysis: Remains Above 1.14 Mark
As the 1.1450 mark held its ground against the surge of the Euro against the US Dollar on Friday, the pair traded lower on Monday morning. The currency pair had declined and even passed the support of the 55-hour SMA, which held up the EUR/USD pair throughout Friday’s trading, As a result of the mentioned move, the closest support to the currency exchange rate on Monday morning was the 23.60% Fibonacci retracement level at the 1.1388 mark. Meanwhile, the 100-hour SMA was approaching from the downside, as it was located near the 1.1375 level during the morning hours of today’s trading. It is most likely that the simple moving average will force the pair into a surge, as the combined support of the retracement level and SMA should provide a strong enough support for a rebound to occur.
Qatar Is Given A 48-Hour Extension To Comply
Today, the initial deadline given to Qatar to comply with a list of 13 demands expires. Nevertheless, Saudi Arabia, the UAE, Bahrain and Egypt agreed to extend that deadline by 48 hours.
If the Arab nations manage to reach an accord within 48 hours, sanctions imposed to Qatar earlier in June are likely to be lifted. It is not clear though what happens if Qatar continues to reject the demands. Saudi Arabia and the others may agree on further sanctions, although those are not clear yet.
UAE Foreign Minister played down the chances of an escalation by saying that 'the alternative is not escalation, but parting ways', suggesting that Qatar may be forced out of the Gulf Cooperation Council (GCC). However, in the unlikely event that the situation does escalate, investors’ risk appetite may be impacted, with safe haven assets likely to be the main beneficiaries. Oil prices could gain in the short-term as well, as the risk of supply disruptions would likely increase.
WTI traded higher on Friday after data showed that US crude production declined the week ended on June 23rd. The price emerged above the resistance (now turned into support) territory of 45.35 (S1) and now looks to be headed for a test near 46.70 (R1). Last Tuesday, the price broke above the downtrend line taken from the peak of the 29th of May, something that turned the short-term outlook positive in our view. Therefore, we would expect a decisive break above 46.70 (R1) to set the stage for extensions towards our next resistance territory of 48.50 (R2).
RBA to stand pat; could appear slightly more optimistic
During the Asian morning Tuesday, the RBA will announce its rate decision and the forecast is for the Bank to hold its policy unchanged. In recent gatherings, officials maintained a neutral tone overall, but appeared somewhat worried with regards to the labor market. However, the two latest employment reports from Australia have been stellar, which make us believe that policymakers are likely to tone down their concerns at this meeting. Having said that though, we don’t expect any dramatic shift in rhetoric, but rather a slightly more upbeat tone, as the RBA will probably want to examine more than a couple of months’ worth of data before making material changes to its bias. If indeed the Bank appears somewhat more sanguine than previously, the Aussie could come under renewed buying interest.
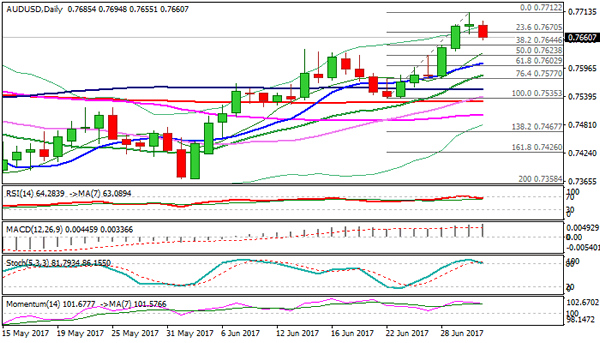
AUD/USD slid somewhat on Friday, after it hit resistance at 0.7710 (R1), slightly below the longer-term downside resistance line taken from the peak of the 21st of April 2016. Bearing in mind that the rate continues to trade above the short-term uptrend line taken from the low of the 2nd of June, we consider the near-term outlook to be positive. Nevertheless, a lot will depend on the RBA decision tonight. If the Bank adopts a more optimistic tone, the pair may rebound and aim for another test near 0.7710 (R1). A break above that barrier and the aforementioned longer-term downside resistance line could open the way for our next resistance of 0.7750 (R2), defined by the peak of the 21st of March. On the other hand, if Australian policymakers disappoint those who expect a somewhat more upbeat language, the pair could fall back below 0.7665 (S1), and may target the crossroad of the 0.7635 (S2) support and the uptrend line taken from the low of the 2nd of June.
As for today’s events:
From Eurozone, we get the final manufacturing PMIs from several European nations and the Eurozone as whole. The final figures are expected to confirm the preliminary estimates and as such, no major response is expected from the euro. We get the manufacturing PMI from the UK as well. The forecast is for the index to have slid, which could weigh on the pound as it could pour some cold water on market expectations regarding a BoE rate hike at one of the upcoming meetings. In the US, the ISM manufacturing PMI for June is expected to have ticked up. However, taking a look at the preliminary Markit manufacturing PMI for the month, we believe that the risks surrounding the ISM index are tilted to the downside. Markets will stay closed in Canada in Celebration of Canada Day, and will close early in the US ahead of Independence Day.
We have two important speakers on today’s agenda: BoE Governor Mark Carney and BoE MPC member Andy Haldane. Following their recent hawkish speeches, we will monitor their comments closely.
As for the rest of the week:
On Tuesday, besides the RBA, the Riksbank also decides on monetary policy. We expect this Bank to shift to a more optimistic tone as well. In fact, we would not rule out the prospect that the Riksbank follows in the recent footsteps of the Norges Bank and the ECB, by also removing its interest rate easing bias. On Wednesday, the Fed releases the minutes of its June policy gathering, where the Committee raised the Federal funds rate by 25bps. In our view, market participants will dig into the minutes for more details on the timing of the balance sheet normalization, as well as any discussion with regards to the timing of the next rate increase. We also have the new Qatar deadline. On Thursday, we get the ADP employment report for June, one day ahead of the official jobs data. Finally on Friday, all eyes will be on the US employment report for June. The report is expected to be robust, which could confirm the Fed’s view that the recent softness in economic data is transitory and could bring forth market expectations with regards to the next hike.
WTI
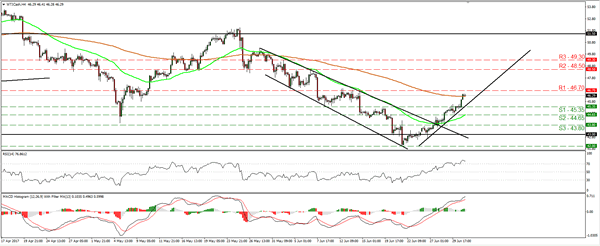
Support: 45.35 (S1), 44.65 (S2), 43.80 (S3)
Resistance: 46.70 (R1), 48.50 (R2), 49.30 (R3)
AUD/USD
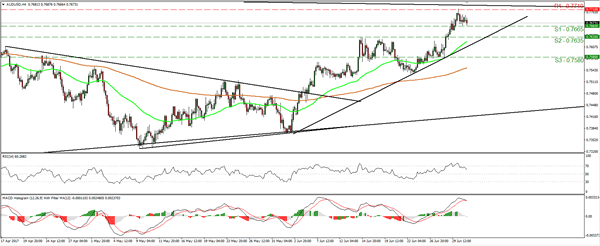
Support: 0.7665 (S1), 0.7635 (S2), 0.7580 (S3)
Resistance: 0.7710 (R1), 0.7750 (R2), 0.7800 (R3)
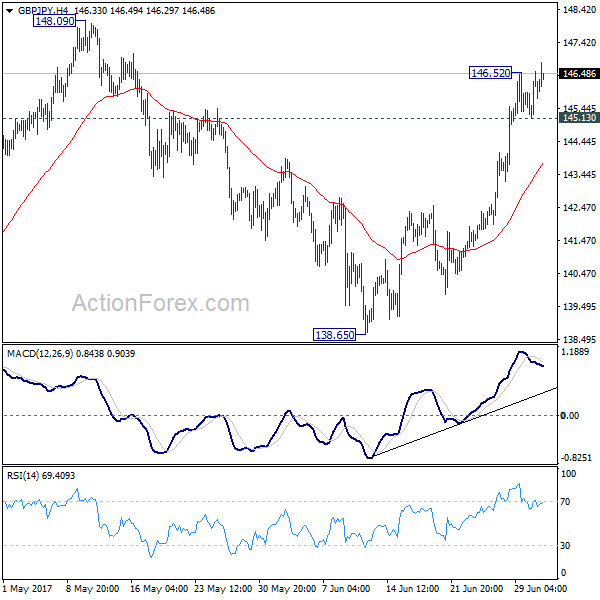
GBP/JPY Daily Outlook
Daily Pivots: (S1) 145.46; (P) 146.01; (R1) 146.89; More....
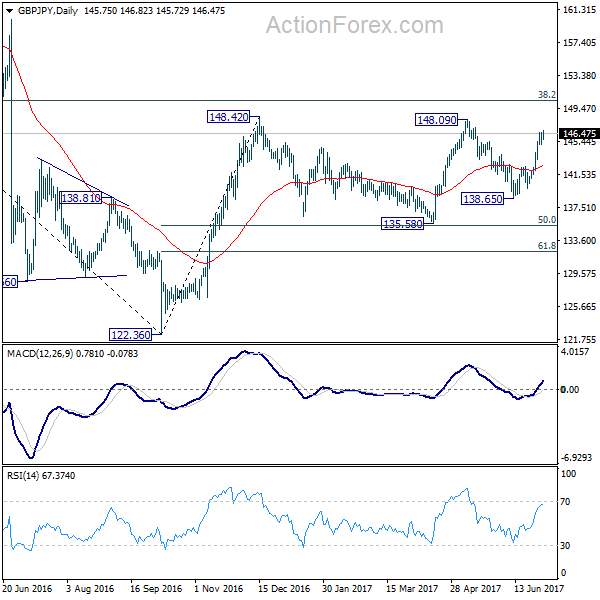
GBP/JPY breaches 146.52 temporary top today and intraday bias is back on the upside for 148.09/42 resistance zone. Decisive break there will extend whole rally from 122.36 to long term fibonacci level at 150.43 next. On the downside, below 145.13 minor support will turn intraday bias and bring consolidation again before staging another rally.
In the bigger picture, rise from medium term bottom at 122.36 is expected to continue to 38.2% retracement of 196.85 to 122.36 at 150.43. Decisive break there will carry long term bullish implications and pave the way to 61.8% retracement at 167.78. In case the sideway pattern from 148.42 extends, we'd be looking for strong support from 135.58 and 50% retracement of 122.36 to 148.42 at 135.39 to contain downside.
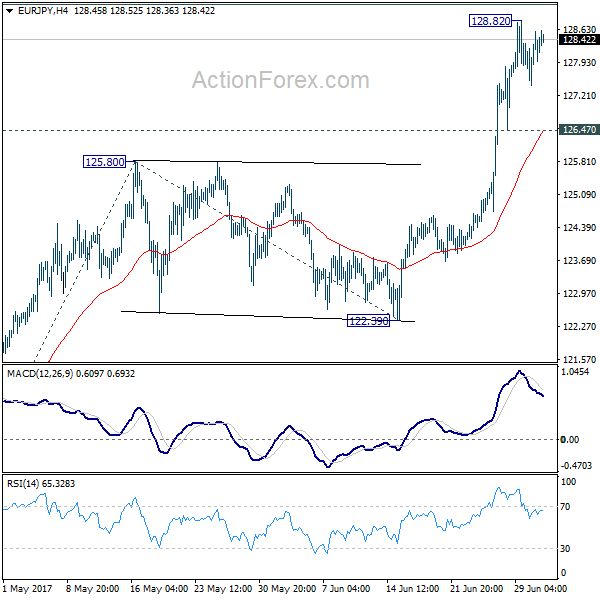
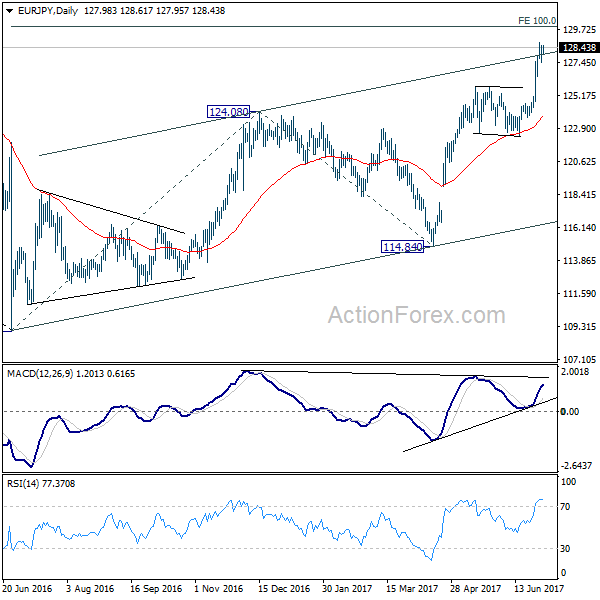
EUR/JPY Daily Outlook
Daily Pivots: (S1) 127.66; (P) 128.13; (R1) 128.82; More...
Intraday bias in EUR/JPY remains neutral for consolidation below 128.82 temporary top. Downside of retreat should be contained by 126.47 support to bring rise resumption. Above 128.82 will target 61.8% projection of 114.84 to 125.80 from 122.39 at 129.16 first . That's also close to medium term projection level at 129.89.
In the bigger picture, the break of 126.09 support turned resistance should have confirmed completion of down trend form 149.76 (2014 high), at 109.03 (2016 low). Current rise from 109.03 should target 100% projection of 109.03 to 124.08 from 114.84 at 129.89 first. Break there will pave the way to 61.8% retracement of 149.76 to 109.03 at 134.20 and above. Medium term outlook will now remain bullish as long as 122.39 support holds.
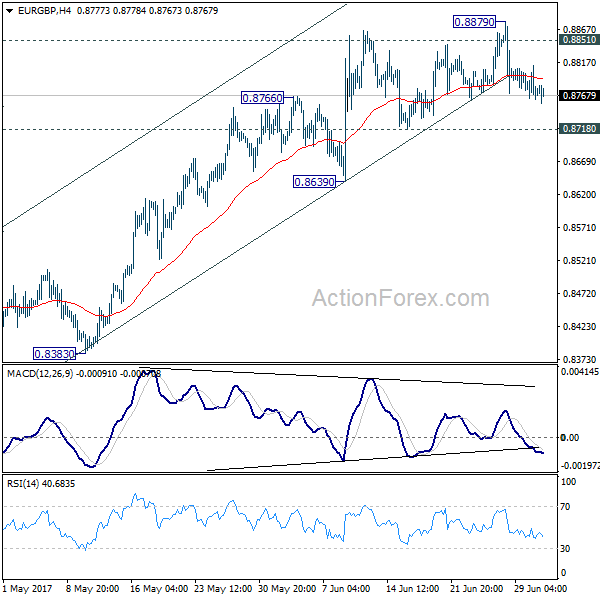
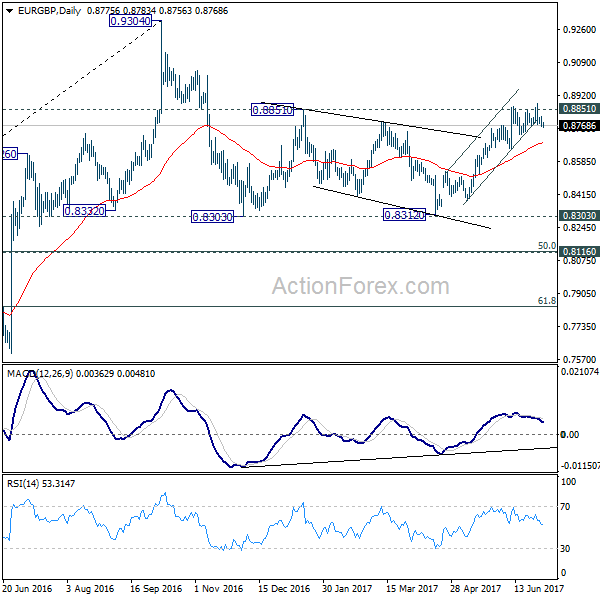
EUR/GBP Daily Outlook
Daily Pivots: (S1) 0.8746; (P) 0.8780; (R1) 0.8798; More...
Intraday bias in EUR/GBP remains neutral for consolidation below 0.8879. On the downside, break of 0.8718 support will argue that rise from 0.8312 has completed. In that case, intraday bias with be turned back to the downside for lower side of the range at 0.8312. Meanwhile, break of 0.8879 and sustained trading above 0.8851 will pave the way to retest 0.9304 high.
In the bigger picture, price actions from 0.9304 are viewed as a medium term corrective pattern. It's uncertain whether it is finished yet. But in case of another fall, we'd expect strong support from 0.8116 cluster support (50% retracement of 0.6935 to 0.9304 at 0.8120) to contain downside and bring rebound. Whole up trend from 0.6935 is expected to resume after consolidation from 0.9304 completes.
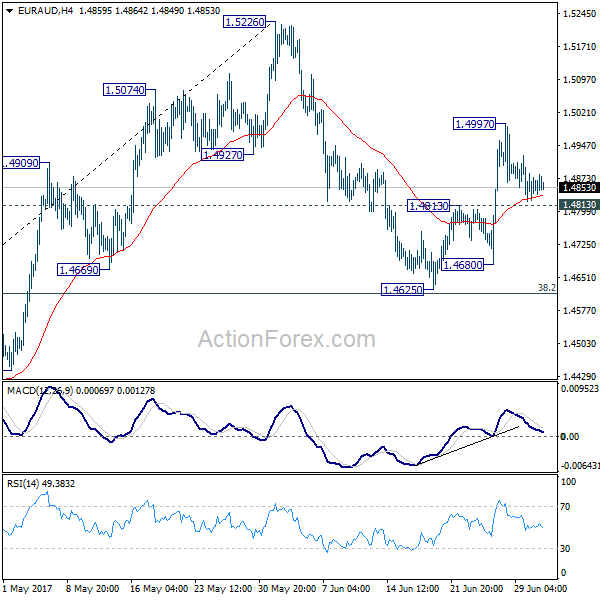
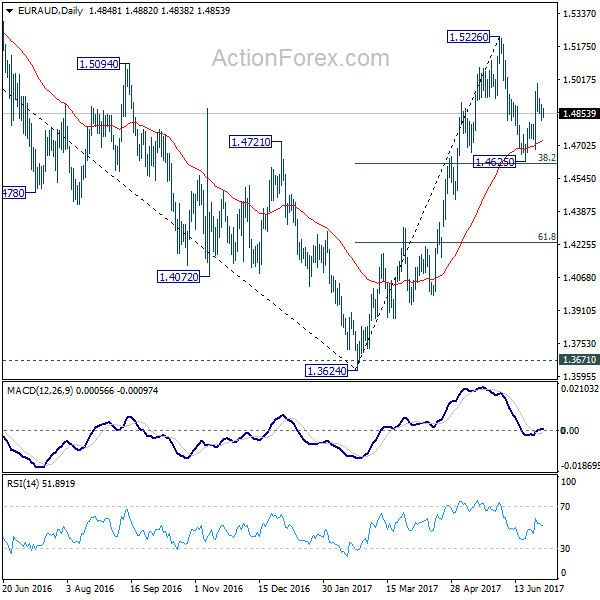
EUR/AUD Daily Outlook
Daily Pivots: (S1) 1.4817; (P) 1.4858; (R1) 1.4895; More...
Intraday bias in EUR/AUD remains neutral for the moment. With 1.4813 minor support intact, holds, we're favoring the bullish case that pull back from 1.5226 has completed at 1.4625, ahead of 38.2% retracement of 1.3624 to 1.5226 at 1.4614. Above 1.4997 will turn bias back to the upside for 1.5226 first. However, break of 1.4813 will dampen this view and turn bias back to the downside for 1.4625 support.
In the bigger picture, price actions from 1.6587 medium term top are viewed as a corrective pattern. Such correction should be completed at 1.3624 after defending 1.3671 key support. Rise from 1.3642 would extend to 61.8% retracement of 1.6587 to 1.3624 at 1.5455. Sustained break there will pave the way to retest 1.6587. However, sustained break of 1.4669 support will dampen this bullish view. We'll assess the outlook later after looking at the structure and depth of the pull back.
Technical Outlook: AUDUSD – Reversal Signal Is Forming On Daily Chart
The Aussie dollar is in red on Monday as reversal signal is forming following strong upside rejection at over three-month high at 0.7712 on Friday.
Bearish signals are also coming from daily RSI / slow stochastic, which reversed from overbought territory.
Fresh weakness penetrated into thick hourly cloud and pressuring pivotal support at 0.7645 (hourly cloud base / Fibo 38.2% of 0.7353/0.7712), loss of which could trigger deeper pullback towards 0.7623 (daily Tenkan-sen) and 0.7605 (Fibo 61.8% / 10SMA), where correction should find support to keep larger bulls intact.
Today's close in red is needed to confirm scenario
Res: 0.7678, 0.7697, 0.7712, 0.7734
Sup: 0.7650, 0.7623, 0.7605, 0.7582
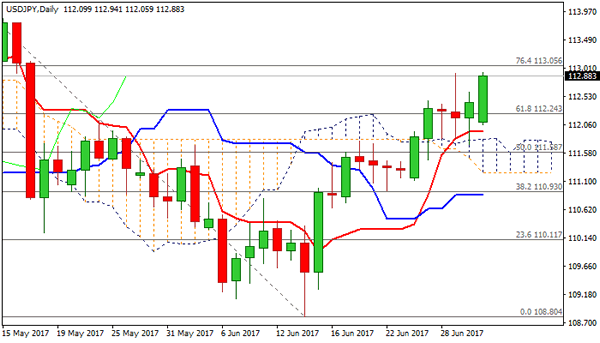
Technical Outlook: USDJPY – Fresh Bulls Pressure 113.00 Barrier
The pair is in fresh rally from 112.00 zone on Monday and pressuring again 113.00 barrier where last week's attack was strongly rejected.
Thickening daily cloud contained last week's choppy trading and continues to underpin the action along with 10/100SMA bull-cross, for final break of 113.00 zone and continuation of broader uptrend from 108.80 (14 June low).
Friday's close above 112.24 (Fibo 61.8% of 114.36/108.80) was strong bullish signal.
However, the pair may hold in extended consolidation between 112.00 and 113.00 range on repeated failure at 113.00 pivot.
Alternative scenario requires break below 112.00 handle (daily Tenkan-sen) and violation of daily cloud top (111.80) to shift near-term bias lower.
Res: 112.94, 113.05, 113.50, 113.95
Sup: 112.45, 112.00, 111.80, 111.37
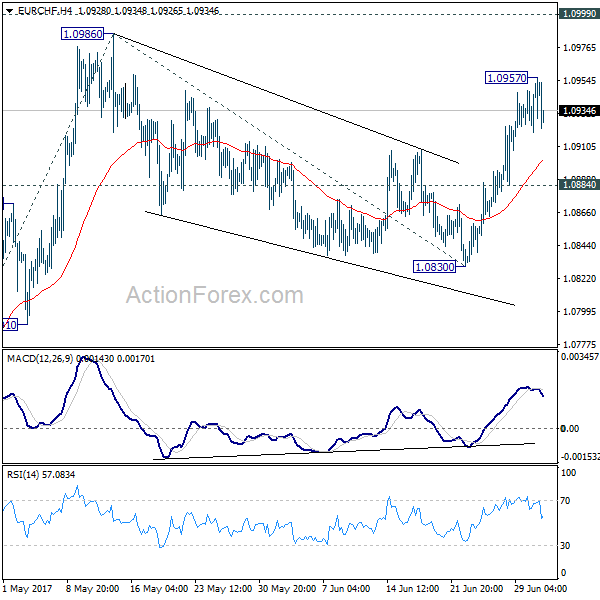
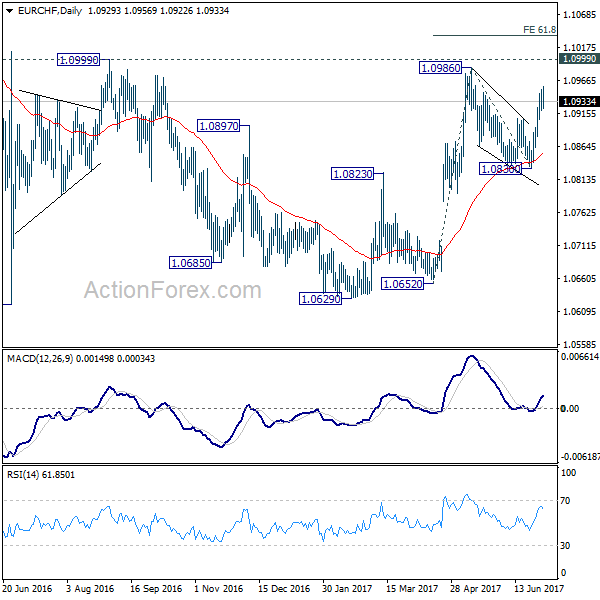
EUR/CHF Daily Outlook
Daily Pivots: (S1) 1.0928; (P) 1.0940; (R1) 1.0961; More...
A temporary top is in place at 1.0957 in EUR/CHF with 4 hour MACD crossed below signal line. Intraday bias is turned neutral first. Downside of retreat should be contained by 1.0884 minor support to bring another rally. Rise from 1.0629 should be resuming. Above 1.0957 will send EUR/CHF through 1.0986/0999 resistance zone to 61.8% projection of 1.0652 to 1.0986 from 1.0830 at 1.1036.
In the bigger picture, the price actions from 1.1198 are seen as a corrective move. Such correction could have completed after defending 38.2% retracement of 0.9771 to 1.1198 at 1.0653. Decisive break of 1.0999 resistance will target a test on 1.1198 high. For now, this will be the preferred case as long as 1.0830 support holds.