Sample Category Title
Weekly Focus: Will Riksbank Follow Suit and Remove Rate Cut Probability?
Market Movers ahead
- The most important event in the Nordics is the Riksbank's announcement on Tuesday at 09:30 CET. Although we expect the Riksbank to stay on hold, we expect it remove the small rate cut probability in the updated rate path.
- In Denmark, the FX reserves data for June is due out on Tuesday, which we expect to show that Danmarks Nationalbank did not intervene.
- In Norway, it will be interesting to see whether house prices continued to fall in June given that they fell the most since the financial crisis in May.
- In the US, several important releases are due out. Most important are the jobs report for June, ISM manufacturing, the FOMC meeting minutes and FOMC speeches.
- In the euro area, the unemployment rate for May is due out on Monday.
Global macro and market themes
- Central banks are beginning to discuss 'when to leave the party'.
- Interestingly, both Mark Carney and Mario Draghi argue that a constant monetary policy is becoming more accommodative as the economy continues to recover.
- There is a risk that central banks are too optimistic, as inflation expectations remain low.
- Mario Draghi let the stimulus exit genie out of the bottle and we expect EUR/USD to move higher in 12M.
Spot Gold Stay in Red on Friday
Spot Gold stay in red on Friday and retested support at $1239 (Thursday's low/weekly cloud top), remaining under pressure after better than expected US Q1 GDP data on Thursday reinforced expectations for further US rate hike this year. However, hawkish comments from other central banks (ECB/BoE/RBA) so far limited dollar's advance and kept gold price above key support at $1236 (26 June low/200SMA). Technical studies are bearishly aligned and maintain downside pressure as the price remains under daily cloud and keeps near-term bias with bears. Spot Gold is on track for strong bearish weekly close which adds on existing pressure for renewed attack at $1236 pivot and bearish extension towards next strong support at $1230 (Fibo 38.2% of $1122/$1296 ascend).
Res: 1246; 1249; 1254; 1256
Sup: 1239; 1236; 1230; 1227
EURAUD Trading In A Corrective Wave Four
EURAUD is making a bigger degree three wave pullback, as part of blue wave 4. This means more weakness can follow on the pair and ideally search for a base around the Fibonacci ratio of 50.0 or 61.8. Later a new five wave rally into blue wave 5 can follow.
EURAUD, 1H
EUR/USD Rally Pauses ahead of a Long US Weekend
- European equities trade uneventful and are currently near opening levels flat today.
- Euro-area inflation slowed in June to 1.3% which is above the expected 1.2% but less than the 1.4% in May. The core inflation, which excludes volatile components like energy and food, increased to 1.1% from 0.9% in May.
- ECB Executive Board member Sabine Lautenschlaeger said that "monetary policy should already be making preparations for a return to a normal stance" and that the ECB "should adapt its communication accordingly". She warned for the risk of asset price bubbles that can result from unusually loose monetary policy.
- In its post-bailout review of Portugal, the IMF sounded an upbeat note. It praised progress in addressing risks and stabilising the banking sector. It also stressed the upturn in growth makes this year's fiscal deficit target of 1.5 % of GDP "well within reach" after "strong efforts to contain spending" saw the deficit drop to an historic low last year.
- The core PCE deflator, the Fed's preferred inflation barometer, fell for the third month in a row in May to 1.4% Y/Y, down from 1.5% Y/Y in April and matching expectations. The headline index fell to 1.4% (1.7% in April and 1.5% consensus). Despite the continued tightening in the labour market, price growth thus remains below target.
- German retail sales rose by some 4.8% Y/Y in May, bouncing back from the (revised) 0.4% decline in April and above forecasts. On the month, sales rose by 0.5% M/M, from 0.2% decline in April and a decent gap ahead of forecasts. However, the rise Y/Y can be attributed to an extra business day because of the Pentecost holiday timing.
- Canada's economy grew for a sixth straight month in April, albeit at a slower pace, further underscoring policymakers' view that conditions are in place for an interest-rate rise as soon as this summer. GDP for April grew 0.2% from the previous month, down from the 0.5% pace recorded in March.
Rates
Lousy attempt to correct higher fails
Core bonds markets stabilized after this week's heavy sell-off, allowing equity and currency (EUR/USD) markets time to recover from the past sessions. An attempt to correct higher was blocked around European noon, pulling core bonds back towards today's opening levels which are close to the sell-off lows. Hawkish comments by ECB Lautenschlager, who argued in favour of policy normalisation and suggested that the ECB spoke with one voice, could have played a role. EMU (CPI) and US (PCE) inflation didn't directly influence dealings. Core EMU inflation rose unexpectedly to 1.1% Y/Y while the US PCE deflator fell to 1.4% Y/Y to 1.7% Y/Y. All in all, most inflation outcome were near consensus though. US investors ignored personal income and spending data as well and are preparing for a long weekend. US markets are closed next Tuesday for the 4th of July holiday, suggesting low activity on Monday as well despite the release of the manufacturing ISM.
At the time of writing, the German yield curve steepens with yield changes ranging between -0.3 bps (2-yr) and +1 bp (30-yr). The US yield curve steepens as well with the 2-yr yield 0.8 bps lower and the 30-yr yield 1.5 bps higher. On intra-EMU bond markets, 10-yr yield spread changes are close to unchanged.
The Italian debt agency tapped the on the run 5-yr BTP (€2.5B 1.2% Apr2022) and launched a new 10-yr BTP (€3.85B 2.05% Aug2027). The combined amount sold approached the upper band of the targeted €6-7B, but the auction bid cover was rather low (1.32). Addtionally, the Treasury sold €2.5B floating rate notes (CCTeu Apr2022).
Currencies
EUR/USD rally pauses ahead of a long US weekend
The strong three-day EUR/USD rally ran into resistance today, but without signals of a dollar counter. Multiple euro area and US eco data couldn't seduce investors to continue the euro buying spree. US markets are closed next Tuesday for the 4th of July holiday and many traders and investors will make it a long weekend. Appetite to take additional positions was missing, also because it's the final the day of the quarter. The picture on the bond and equity markets was similar: quiet technical trading. US and German yields moved slightly higher, but the differentials were negligible. European equities corrected somewhat higher in the morning session, but slid again lower top openings levels in the afternoon session. USD/JPY traded mostly in the red between 111.73 and 112.20, but without a distinct direction. The equity moves were too small to impact the pair which trades currently near opening levels at 112.20.
After an uneventful Asian session, EUR/USD was hit by some modest profit taking, pushing the pair from opening levels around 1.1440 to an intraday low at 1.1390 at European noon. Afterwards, the pair cautiously struggled higher to just above 1.14. A hawkish speech of ECB Lautenschlager may at the margin helped supported the euro, but her views are well-known (minority in the ECB) and thus generally unable to give the euro strong direction. US personal consumption and income printed near expectations and so were the (core) PCE deflators. EUR/USD remained just above the 1.14 level.
No post Carney follow-through gains for sterling
Cable approached key 1.3044 resistance overnight, but a real test didn't occur, sending GBP/USD lower again. UK data made no difference: Outdated Q1 GDP was confirmed at a weak 0.2% M/M, while the April index of services and Q1 business investment were in line with expectations. Cable trades currently at 1.2975 versus opening levels around 1.3007. EUR/GBP went initially lower, mirroring the decline in EUR/USD. However, the pair turned North well ahead of EUR/USD. When EUR/USD turned, sterling erased all remaining losses and trades now unchanged on the day at 0.8797.
Onward and Upward for the Canadian Economy in April
- The Canadian economy continued to move forward in April, growing by 0.2% month-on-month on the back of expansion in service-producing industries.
- The breadth of growth remained fairly strong, as 14 of the 20 major industries (representing roughly 76% of output) saw growth.
- A mixed performance was turned in on the goods-producing side of the economy. Mining, quarrying and oil &gas saw a 1.2% expansion, helped by strong growth in drilling and rigging services that more than offset weakness in the oil and gas extraction subsector, stemming from issues at the Mildred Lake oil facility. Growth was flat to slightly up elsewhere, except among manufacturers, where output fell 0.9% in April nearly reversing the 1.0% climb in March. The decline within subsectors was fairly widespread, as both durable and non-durable manufacturing output contracted in April.
- For the service-producing side of the economy it was another solid month, as output rose 0.3%. Tearing out of the gate was arts, entertainment, and recreation, helped by the presence of five Canadian teams in this year's NHL playoffs. Other notable gainers were for accommodation and food services (+1.1%), transportation (+1.0%), retail trade, wholesale trade, and professional services (all +0.5% m/m in April).
Key Implications
- The Canadian economy kicked the second quarter off on a decent footing, posting its sixth straight monthly expansion. With Canada Day tomorrow, it is perhaps worth noting that at least part of the gain can be attributed to five Canadian teams making the NHL playoffs this year, a welcome departure from the 2016 performance. Beyond the impact of hockey however, was a still solid economy that continues to see growth across a wide swath of industries, and which looks set to meet our expectations of 2.9% growth (q/q SAAR) for Q2.
- With another quarter of solid economic growth looking likely, Canada has clearly put the worst of the 2014/15 oil price shock behind it. Consequently, all eyes are now on the Bank of Canada's monetary policy, with the overnight target currently at an emergency level of 0.50%. Recent communications have struck a markedly hawkish tone, suggesting that it is no longer a matter of *if* monetary stimulus will be removed this year, but rather *when*.
- As it stands, we remain of the view that the first Bank of Canada interest rate increase in more than seven years will take place this fall, likely in October. While markets have placed good odds on an increase at the Bank's July 12th meeting, we believe that the value of waiting until October in terms of additional clarity around oil prices, housing markets, and inflationary pressures outweighs the marginal impact that hiking three months earlier would have on inflation one to two years from now.
- That said, this is not a cut and dry case, and a July hike can easily be justified given the forward-looking nature of monetary policy. Certain to inform the Bank of Canada's thinking (and ours) will be the forward-looking components of the latest Business Outlook Survey, due for release today at 10:30AM ET.
US: Soft Spending and Weak Inflation, But Strong Real Income Growth in May
- Personal income rose 0.4% in May, slightly ahead of consensus expectations for a 0.3% gain. Removing taxes and price changes, real disposable personal income was up a robust 0.6% in the month.
- Personal spending was softer, rising just 0.1%, in line with the consensus. In real terms, personal spending was also up 0.1%, led by a 0.2% increase in non-durable goods. Durable goods spending edged down 0.1%, while services spending inched ahead 0.1%.
- Consumer prices fell 0.1% (month-on-month) in May, bringing the year-on-year inflation rate to just 1.4% (from 1.7% in April). Core prices (excluding food & energy) also rose 0.1% month-on-month – bringing year-on-year core price growth to 1.4% (from 1.5% previously).
- The personal saving rate jumped to 5.5% from a downwardly revised 5.1% in April.
Key Implications
- Spending was a touch soft in May, but follows two months of solid gains. For the quarter, we are still tracking 3% (annualized) growth, marking a return to form for consumer spending growth and lifting overall economic growth back above trend.
- The upside of weak inflation is strong real income growth. Real disposable personal income has risen a whopping 4.7% (annualized) over the past three months, the strongest growth in nearly two years. This should continue to underpin healthy consumer spending through the second half of the year.
- The Federal Reserve lowered its outlook for inflation in 2017 in its last Summary of Economic Projections in June. Even this relatively quiescent forecast is at risk of underperforming given the continued deceleration in inflation. While global central banks have turned increasingly hawkish in recent weeks, ongoing misses on the inflation front remain the main risk to the pace of monetary policy normalization.
Canada’s April GDP Points to Above-Trend Growth Continuing in Q2
Highlights:
- Canadian GDP rose by an on-consensus 0.2% in April to build on a 0.5% gain in March.
- Goods-producing industries were flat while services activity rose 0.3%.
- Growth was broadly-based: 14 of 20 subsectors grew in April and 17 of 20 saw higher output relative to a year ago.
- A fire-related shutdown at an oil sands producer weighed on oil and gas extraction in April. An 11% increase in support activities for mining, oil and gas offset that decline.
- Arts, entertainment and recreation jumped 2.8% thanks to five of seven Canadian NHL teams making the playoffs.
- Manufacturing disappointed with a 0.9% decline in April. The earlier-released manufacturing sales data showed volumes rose 0.5% in the month. Output in the sector was still up 2% year-over-year.
Our Take:
Canadian GDP posted a solid 0.2% increase in April and there was further evidence of broadening growth across sectors which has been a significant factor in the Bank of Canada's recently rosier take on the economy. Decent momentum to start Q2 fits with our forecast for 2.7% growth in the quarter. That would be consistent with recent comments from BoC Governor Poloz that growth likely moderated relative to Q1's 3.7% pace but remained above trend. There was also further evidence of recovery in the energy sector, supporting the bank's contention that adjustment to lower oil prices is largely complete. Overall, today's GDP report is consistent with the Bank of Canada's recent narrative that broadly-based growth is steadily eroding excess capacity in the economy and that 2015's rate cuts have "done their job." The bank's more hawkish tone has markets pricing in about 70% odds of a rate hike as soon as July. April's GDP, if matched by an upbeat Business Outlook Survey later this morning, should reinforce market expectations.
EUR/USD Mid-Day Outlook
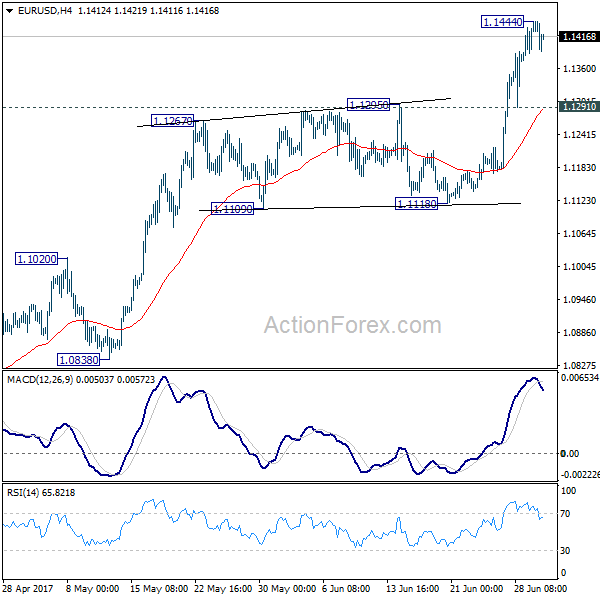
Daily Pivots: (S1) 1.1394; (P) 1.1419 (R1) 1.1465; More.....
A temporary top is in place at EUR/USD with 4 hour MACD crossed below signal line. Intraday bias is turned neutral for consolidation. Downside of retreat should be contained by 1.1291 minor support to bring rise resumption. Break of 1.1444 will extend the larger up trend from 1.0339 to 1.1615 medium term resistance next.
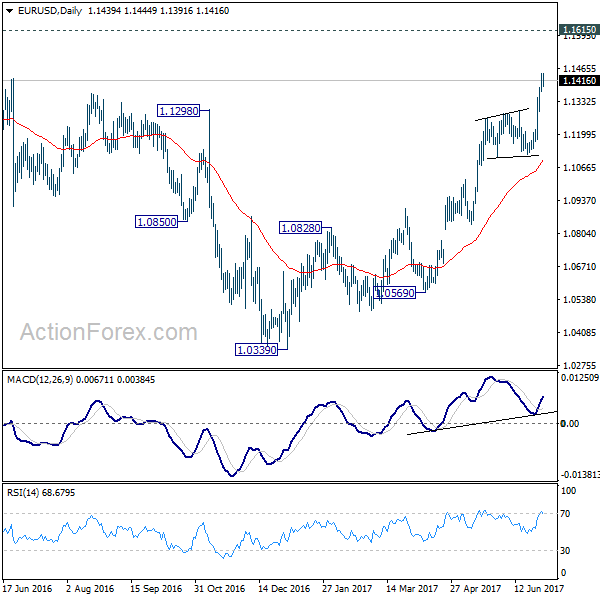
In the bigger picture, the break of 1.1298 resistance further affirm medium term reversal. That is an important bottom was formed at 1.0339 on bullish convergence condition is seen in weekly MACD. Further rise would be seen to 55 month EMA (now at 1.1776). Sustained break there will pave the way to 38.2% retracement of 1.6039 (2008 high) to 1.0339 (2017 low) at 1.2516 next. This will now remain the favored case as long as 1.1118 support holds.
USD/CHF Mid-Day Outlook
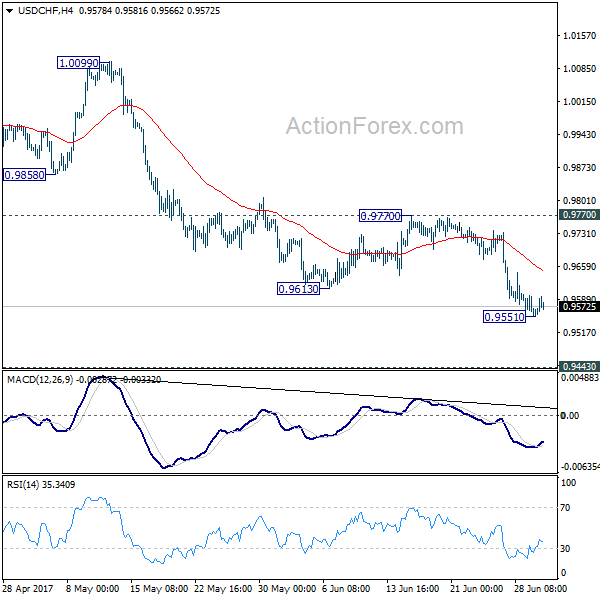
Daily Pivots: (S1) 0.9542; (P) 0.9571; (R1) 0.9586; More.....
A temporary low is in place at 0.9551 with 4 hour MACD crossed above signal line. Intraday bias is turned neutral for consolidation. Upside of recovery should be limited below 0.9770 resistance and bring another decline. Below 0.9551 will target 0.9548 support and below. We'd start to look for bottoming signal again as it approaches 0.9443 key support level.
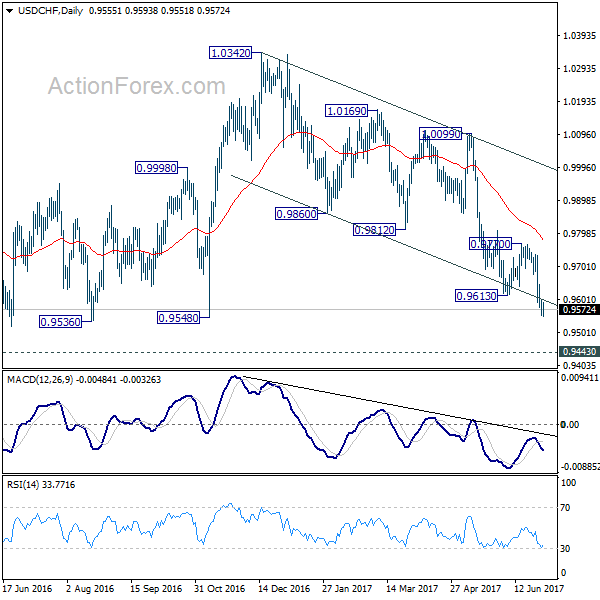
In the bigger picture, USD/CHF is still bounded in medium term range of 0.9443/1.0342 for the moment. Consolidative trading would likely continue and medium term outlook remains neutral. Break of 1.0342 key resistance is needed to confirm underlying bullish momentum in the pair. Meanwhile, downside attempts should be contained by 0.9443 key support level. However, sustained break of 0.9443 will carry larger bearish implication and target 0.9 handle.
USD/JPY Mid-Day Outlook
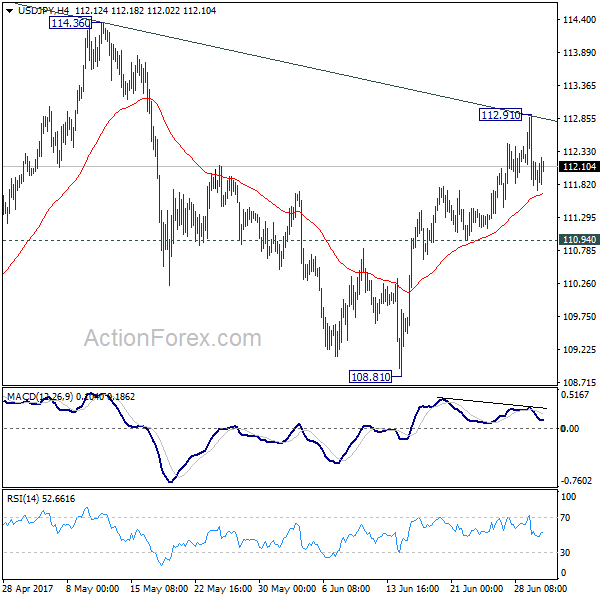
Daily Pivots: (S1) 111.67; (P) 112.29; (R1) 112.79; More...
Intraday bias in USD/JPY remains neutral for consolidation below 112.91 temporary top. Near term outlook stays cautiously bullish as long as 110.94 support holds. Sustained break of the near term channel resistance argue that whole pull back from 118.65 has completed at 108.12 already. In such case, further rise should be seen to 114.36 resistance for confirmation. However, break of 110.94 will argue that rebound from 108.81 has completed and will turn bias back to the downside for this support instead.
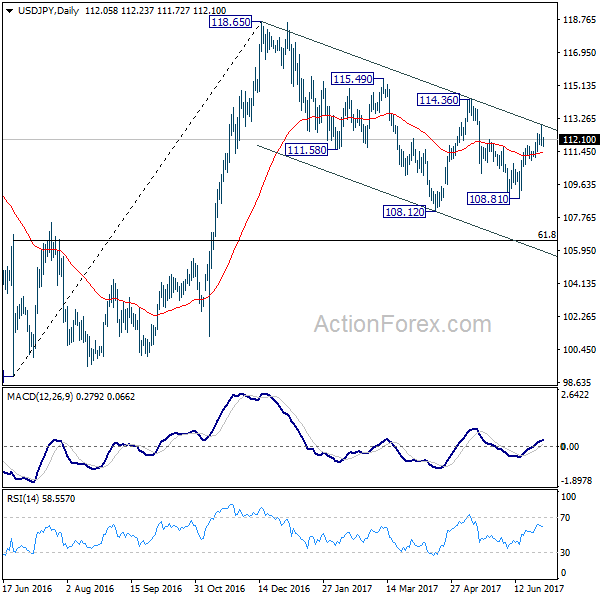
In the bigger picture, price actions from 125.85 high are seen as a corrective pattern. It's uncertain whether it's completed yet. But in case of another fall, downside should be contained by 61.8% retracement of 75.56 to 125.85 at 94.77 to bring rebound. Overall, rise from 75.56 is still expected to resume later after the correction from 125.85 completes.