Sample Category Title
Week Ahead – US And Canadian Jobs Data Eyed Amid Rate Hike Talk, RBA And UK PMIs Also In...
Employment reports out of the United States and Canada will be scrutinized as the Fed eyes a third rate hike and the Bank of Canada moves closer to a tightening cycle. Central bank meetings will include the Reserve Bank of Australia and the Riksbank, while PMI data out of the United Kingdom, the Eurozone, China, Canada, and the United States will also be watched.
RBA set to maintain neutral stance
The Reserve Bank of Australia is expected to hold rates unchanged at 1.5% for the 10th meeting in a row on Tuesday as the central bank attempts to balance low inflation and wage growth with rising household debt. Although the Australian labour market has shown some signs of strength recently, consumer spending has been softer this year. Retail sales data, also due on Tuesday, should indicate if the bounce back in sales seen in April will be sustained. Trade figures released on Thursday should also capture some attention, especially as the Australian dollar tests the key $0.77 level once again.
Canadian jobs in focus as Bank of Canada ponders a July rate hike
The Canadian dollar has enjoyed a strong rally in the past couple of months and strong jobs data out on Friday could fuel the loonie’s gains as it would give the Bank of Canada more reason to consider a rate hike at its July 12 meeting. Recent hawkish remarks from the Bank’s Governor and his deputy have caught markets by surprise as it wasn’t that long ago that the BoC was considering cutting rates. Also to watch out of Canada next week are trade figures on Thursday and the Ivey PMI on Friday.
Quieter week for the Eurozone
It will be a relatively quieter week for the Eurozone with only a handful of key data releases on next week’s calendar. The final readings of IHS Markit’s PMIs for June are not expected to see any revision. The manufacturing PMI is due on Monday and the services and composite PMIs on Wednesday. Monday will also see the release of the euro area’s unemployment rate and retail sales will follow on Wednesday. June’s flash readings had pointed to a slight easing in economic growth in the Eurozone at the end of the second quarter, and the euro’s sharp rally in recent days may threaten to put a damper on the current momentum. German data will also be in focus next week as both industrial orders and industrial output figures are out on Thursday and Friday respectively.
Tankan survey to show growing optimism among Japanese businesses
The Bank of Japan’s quarterly Tankan survey will be the main data release out of Japan next week. The Tankan’s key indices are all expected to improve in the second quarter, with both manufacturing and non-manufacturing companies reporting an increase in business sentiment. More importantly, large and small businesses alike are forecast to up their expectations of capital spending for the fiscal year ending March 2018. A solid Tankan report should help the yen as it would underline Japan’s strengthening economic outlook, though with the Bank of Japan still not satisfied with the performance of prices, any impact would be limited.
UK data in spotlight after Carney U-turn
Recent economic indicators out of the UK have been disappointing. Apart from the labour market, inflation has been the only other bright spot, which has now overshot the Bank of England’s 2% target. However, the UK economy remains fairly resilient under the climate of the Brexit uncertainty and the Bank of England has signalled it may consider a rate hike within the coming months. Even the Bank’s Governor, Mark Carney, who until last week had resisted calls for a rate rise, appears to be aligning himself closer to the hawks in the MPC, driving the pound back above $1.30. Incoming data in the next few months will therefore be analysed carefully for more clues on the strength of the economy. The Markit/CIPS manufacturing PMI will start the week on Monday. It’s expected to ease slightly to 56.4 in June. The construction and services PMIs, due on Tuesday and Wednesday, respectively, are also forecast to drop slightly. More data will follow on Friday with industrial and manufacturing production figures. Both industrial and manufacturing output are forecast to rise by 0.3% month-on-month in May.
ISM PMIs and NFP to be week’s highlight
The US will have a busier week despite the 4th of July Independence Day holiday on Tuesday. As the markets continue to question the Fed’s rate hike path that currently projects one more increase later this year, major data releases next week could shed more light on the state of the US economy. The closely watched ISM manufacturing PMI due on Monday will be the first big number of the week. The index is forecast to edge up slightly to 55.0 in June. Also out on Monday, is IHS Markit’s manufacturing PMI. The next batch of data will come on Thursday, which will include the ADP Employment reports, the goods trade balance, the Markit services PMI and the ISM non-manufacturing PMI. The ISM’s non-manufacturing PMI is expected to moderate from 56.9 to 56.6.
After a disappointing set of figures in May, June’s headline non-farm payrolls number is not expected to overwhelm either. The US economy is forecast to add 183k jobs in June, compared with 138k previously. The unemployment rate is expected to remain at 4.3% and average hourly earnings growth is forecast to quicken slightly to 0.3% m/m in June. Another poor report could spell more trouble for the US dollar, which has not only come under pressure from fading hopes of a fiscal stimulus anytime soon, but also from rising expectations of higher interest rates in other parts of the world.
Other notable events next week will include PMI figures from China and a monetary policy meeting by Sweden’s central bank. China’s Caixin manufacturing and services PMIs are due on Monday and Wednesday, respectively, and are expected to yet again show a divergence from the official PMIs in June. Meanwhile, Sweden’s Riksbank will meet on Tuesday and will likely sound less dovish given recent stronger-than-expected inflation data and an easing of upside pressure on the krona.
DAX Inches Higher As Eurozone CPI Estimate Meets Expectations
The DAX index has ticked upwards in the Friday session, gaining 0.22%. Currently, the DAX is at 12,443.50. On the release front, German indicators were mixed. Retail Sales rebounded in May, with a gain of 0.5%. However, Unemployment Change gained 7 thousand, missing the estimate of -10 thousand. On the inflation front, Eurozone CPI Flash Estimate edged lower to 1.3%, above the forecast of 1.2%.
German consumer data beat expectations this week, as the German economy continues to shine. Preliminary CPI posted a gain of 0.2% in June, beating the estimate of 0.0%. This reading was an improvement from May, which showed a decline of 0.2%. On Friday, Retail Sales followed suit, as the gain of 0.5% was the strongest gain rebounded from a reading of 0.2% in May. However, Unemployment Change was unexpectedly soft, breaking a streak of 8 straight declines. The unemployment rate remained unchanged at 5.7%.
ECB President Mario Draghi may have got more than he bargained for as the highlight speaker at the ECB forum for central bankers in Sintra, Portugal. The meeting turned into the market-mover of the week (if not of the month), as the euro jumped 1.9%, while the pound soared 2.1%. The currencies posted the sharp gains after hawkish comments from Draghi and BoE Governor Mark Carney. Draghi was upbeat about the eurozone economy and put a positive spin on inflation, stating that 'deflationary forces have been replaced by reflationary ones'. Draghi said that the ECB's stimulus program was needed for now, but would be gradually withdrawn once inflation moved higher. The markets read Draghi's comments as a declaration that the ECB was planning to tighten policy. After the euro jumped, the ECB tried to dampen the stampede to snap up euros, with ECB sources saying that the markets had 'misjudged' Draghi's remarks. This impeded the euro's rally, but only briefly. There was a similar reaction from the pound, which jumped above the 1.30 level for the first time since May after Carney left the door open for a rate hike. Carney appeared to backtrack from remarks last week, when he warned against rate increases in the near future. This week's rallies by the euro and the pound could mark trading opportunities, as Stephen Innes, senior trader at OANDA, summed up:
'A game changer of a week as hawkish central bank commentary steamrolled the markets'… traders are now contemplating who will be next to join the lineup. No one wants to miss out on this party realising there's a co-ordinated policy shift afoot and the chance to catch the removal of an easing bias is far too seductive for traders to ignore.'
There was no getting around the fact that the US economy slowed down in the first quarter, but there was some good news, as the revised GDP reading was raised to 1.4%, better than the initial estimate of 1.2% in May. The improvement was attributed to stronger consumer spending and an increase in exports. Earlier in the year, the markets were braced for a very poor quarter, with the first estimate in April projecting a gain of only 0.7%. Will we see better numbers in the second quarter? That may be a tall order, as consumer spending and manufacturing numbers in Q2 have missed expectations. Housing numbers have been mixed, and inflation remains below the Fed's target of 2 percent. At the same time, the US labor markets remains very tight, with the unemployment rate at a 16-year low of 4.3%. Stronger global economic conditions have increased the demand for US products, boosting the export sector.
Euro Steadies After Stellar Week, Eurozone CPI Estimate Beats Forecast
The euro has posted slight losses in the Friday session. Currently, the pair is trading at the 1.14 level. On the release front, it’s a busy day, so traders should be prepared for some movement from EUR/USD. German economic indicators were mixed. Retail Sales rebounded in May, with a gain of 0.5%. However, Unemployment Change climbed 7 thousand, missing the estimate of -10 thousand. On the inflation front, Eurozone CPI Flash Estimate edged lower to 1.3%, above the forecast of 1.2%. In the US, the focus will be on consumer data, with the release of Personal Spending and UoM Consumer Sentiment.
The quiet town of Sintra, Portugal was in the spotlight this week, as comments from central bankers at the ECB forum shook up the currency markets. The euro and British pound both enjoyed sharp gains against the dollar, courtesy of ECB President Mario Draghi and BoE Governor Mark Carney. Draghi presented an optimistic view of the eurozone economy, and put a positive spin on inflation, stating that 'deflationary forces have been replaced by reflationary ones'. Draghi said that the ECB’s stimulus program was needed for now, but would be gradually withdrawn once inflation moved higher. The markets read Draghi’s comments as a declaration that the ECB was planning to tighten policy. After the euro jumped, the ECB beat a hasty retreat, with ECB sources saying that the markets had 'misinterpreted' Draghi’s remarks. This impeded the euro’s rally, but only briefly. There was a similar reaction from the pound, which jumped above the 1.30 level for the first time since May after Carney left the door open for a rate hike. Carney appeared to backtrack from remarks last week, when he warned against rate increases in the near future. This week’s rallies by the euro and the pound were extraordinary, as Stephen Innes, senior trader at OANDA, summed up:
'A game changer of a week as hawkish central bank commentary steamrolled the markets'… traders are now contemplating who will be next to join the lineup. No one wants to miss out on this party realising there’s a co-ordinated policy shift afoot and the chance to catch the removal of an easing bias is far too seductive for traders to ignore.'
There was no getting around the fact that the US economy slowed down in the first quarter, but there was some good news, as the revised GDP reading was raised to 1.4%, better than the initial estimate of 1.2% in May. The improvement was attributed to stronger consumer spending and an increase in exports. Earlier in the year, the markets were braced for a very poor quarter, with the first estimate in April projecting a gain of only 0.7%. Will we see better numbers in the second quarter? That may be a tall order, as consumer spending and manufacturing numbers in Q2 have missed expectations. Housing numbers have been mixed, and inflation remains below the Fed’s target of 2 percent. At the same time, the US labor markets remains very tight, with the unemployment rate at a 16-year low of 4.3%. Stronger global economic conditions have increased the demand for US products, boosting the export sector.
Aside from lukewarm economic data in 2017, investor confidence has been dampened by a Trump administration which has been plagued by scandals and crises. The administration continues to spend much of its time and energy on damage control, rather than focusing on its agenda of tax reform and increased fiscal spending. Will political paralysis in Washington affect interest rate policy? The Federal Reserve has all but promised one more rate hike in 2017, but the markets aren’t so sure, with the odds of a December rate hike at 57%, according to the CME Group.
Profit Taking Seen As Traders Eye US Data
- Investors prepare for less accommodative global monetary policy;
- Profit taking seen in bonds, stocks and currencies;
- Oil on course for seventh consecutive daily gain but downside pressure remains;
- US inflation, income, spending and consumer data still to come.
As the week, month and quarter draws to a close, we appear to be seeing some profit taking after what has been a very interesting week for markets.
This week has seen a number of central bankers adopt a more hawkish view on their respective monetary outlooks which has pushed up yields and seen the pound, euro and Canadian dollar quite heavily bid. The comments also appear to have weighed on equities in recent days as investors prepare for the end of ultra-accommodative monetary policy from some of the world's largest central banks.
While the process is likely to be very gradual which means monetary policy will remain very accommodative for some time yet, the change in tone from the likes of the Bank of England hasn't gone unnoticed, with investors previously not pricing in a rate hike in the UK until 2019.
Today though we're seeing some profit taking on the week's moves, with the pound stumbling once again just above 1.30 against the dollar and the euro just above 1.14, also against the greenback. Both of these levels are also notable technical levels, having provided resistance in the past so it's perhaps not surprising that we're seeing the same again. Despite this, I wouldn't be surprised if these levels are broken over the next couple of weeks, assuming the same policy makers don't backtrack on what has been said this week, something someone at the ECB has already tried to do this week in the case of Mario Draghi.
One area where we're not seeing this is in oil, which has recovered off its seven month lows – reached last week – to record six consecutive daily gains and is now on course for a seventh. Whether this can be maintained is yet to be seen with investors clearly expressing significant doubts about the effectiveness of the production cut that was extended only last month until the first quarter of next year. As it is, this still looks like a corrective move and I wouldn't be surprised to see more downside pressure next week.
We may not have the abundance of central bank appearances today that we've had throughout the rest of the week but there is still a lot of economic data to come today from the US. UK first quarter GDP data this morning was unrevised at 2%, as expected, while CPI and core CPI inflation data in the eurozone topped expectations but remained well below the ECBs target of below, but close to, 2%. Still to come today we have inflation data for the US – core PCE price index, the Fed's preferred measure – personal income and spending figures, UoM consumer sentiment survey and the Baker Hughes oil rig release.
Daily Technical Analysis: USD/CAD Bearish Pressure Continues
The USD/CAD started to drop fast after the BOC governor Poloz announced a possible rate hike . At this point the pair is below W L5 and D H5 that suggest room for a further drop. The POC zone is 1.3065-85 (D H5, ATR high, EMA 89) that stands slightly above 23.6 fib retracement of the swing low that is usually tested in the strong trend. But if the pair proceeds lower below 1.2970 we might expect 1.2950 and 1.2920 in near term. Pay attention to these levels today as it is Friday - a profit taking day.
Forex Technical Analysis: EUR/USD, USD/JPY, GBP/USD
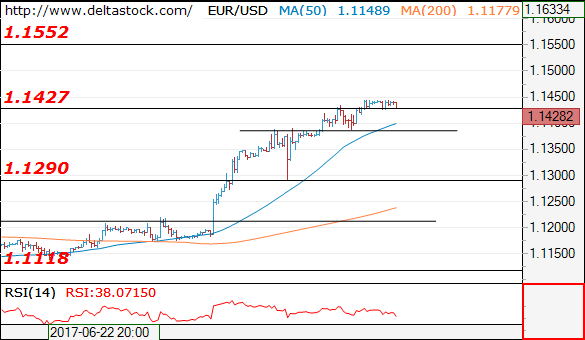
EUR/USD
Current level - 1.1428
The overall bias is still positive, with a key support at 1.1385. Crucial on the downside is 1.1290 low.
| Resistance | Support | ||
| intraday | intraweek | intraday | intraweek |
| 1.1450 | 1.1450 | 1.1385 | 1.1020 |
| 1.1550 | 1.1610 | 1.1290 | 1.0838 |
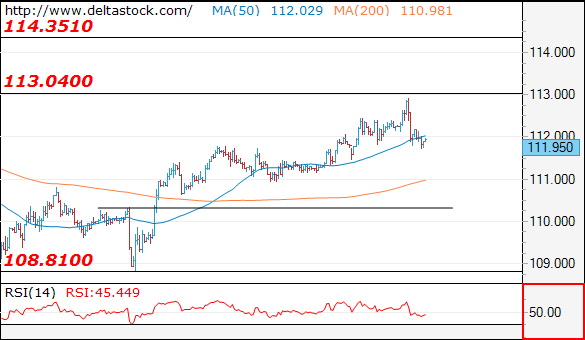
USD/JPY
Current level - 112.25
Yesterday's test of 113.00 area failed and the intraday bias is negative, as the pair is currently testing 111.70 support zone. The latter is crucial for the whole rise from 108.81.
| Resistance | Support | ||
| intraday | intraweek | intraday | intraweek |
| 113.10 | 113.10 | 111.70 | 110.30 |
| 113.10 | 114.30 | 110.30 | 108.81 |
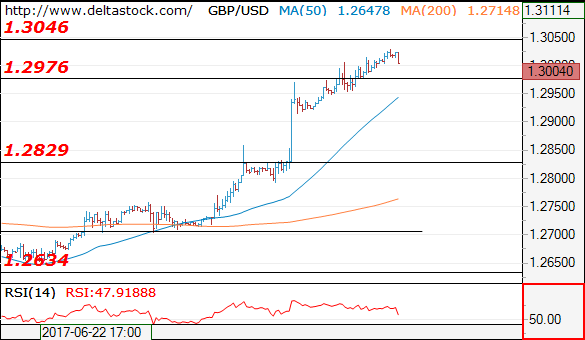
GBP/USD
Current level - 1.3004
AS the pair is approaching 1.3050 resistance, there is a risk of a more significant reversal and trigger on the downside is 1.2950 area. A violation of the latter will signal a broad consolidation pattern towards 1.2830-50 zone.
| Resistance | Support | ||
| intraday | intraweek | intraday | intraweek |
| 1.3050 | 1.3130 | 1.2950 | 1.2635 |
| 1.3130 | 1.3500 | 1.2850 | 1.2480 |
Technical Outlook: USDJPY – Daily Cloud Offers Strong Support And Holding Dips For Now
The pair stays at the back foot on Friday and retests strong support at 111.80, provided by daily cloud top / 100SMA.
The support has already contained dips of past two days and daily cloud (spanned between 111.23/83) is expected to hold pullback after Thursday's strong upside rejection just under next target at 113.05 (Fibo 76.4% of 114.36/108.80 descend), as overall structure is bullish and the pair is on track for the third consecutive bullish weekly close.
Alternative scenario sees increased downside risk on reversal below daily cloud which would expose pivotal supports at 111.11 and 110.86 (26 June low / daily Kijun-sen) loss of which will generate stronger bearish signal.
Res: 112.17, 112.46, 112.92, 113.05
Sup: 111.80, 111.46, 111.23, 110.86
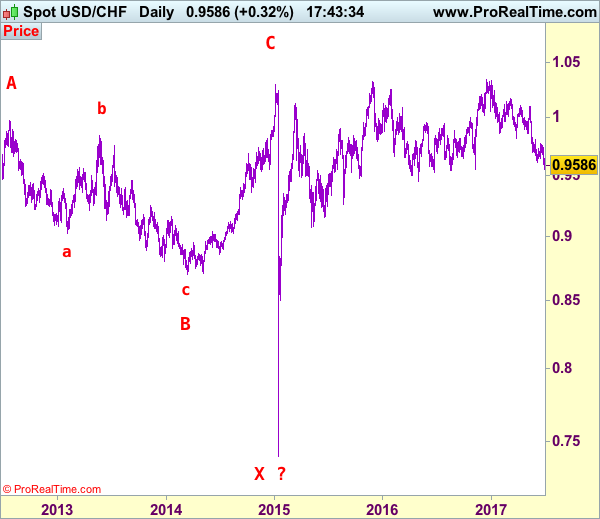
USD/CHF Elliott Wave Analysis
USD/CHF – 0.9583
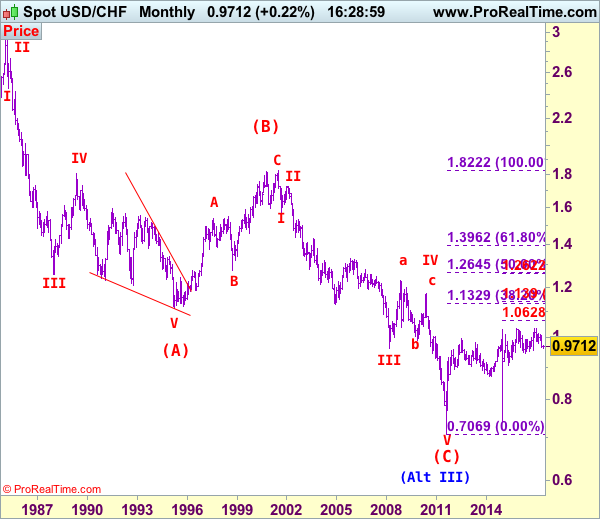
USD/CHF – Wave IV ended at 1.1730 and wave V has possibly ended at 0.7068
The greenback has dropped after meeting renewed selling interest at 0.9757, suggesting the decline from 1,9344 top is still in progress and downside risk remains for further weakness to previous support at 0.9444 (2016 low), however, a sustained breach below this level is needed to retain bearishness and extend further decline to 0.9390-00, then towards 0.9350, however, as broad outlook remains consolidative, reckon downside would be limited to 0.9300 and previous support at 0.9259 should remain intact, bring rebound later.
Our preferred count on the daily chart is that early selloff to 0.9630 is an end of the larger degree wave III and major correction is unfolding from there with a leg ended at 1.2298 (Nov 2008 with (a): 1.0625, (b):1.0011 and (c):1.2298), wave b ended at 0.9910 with (a): 1.0370, (b): 1.1967, (c): 0.9910. The rise from there to 1.1730 is the wave c which also marked the end of wave IV and wave V has possibly ended at 0.7068.
On the upside, whilst recovery to 0.9600 cannot be ruled out, reckon upside would be limited to 0.9647 and price should falter below previous support at 0.9676, bring another decline later. Only a daily close above 0.9676 would defer and suggest a temporary low is possibly formed, bring a stronger rebound to 0.9710-20 and possibly test of resistance at 0.9738 but price should falter below indicated resistance at 0.9757, bring another selloff later.
Recommendation: Stand aside for this week,
Dollar's long-term downtrend started from 2.9343 (Feb 1995) and it was unfolding as a (A)-(B)-(C) with (A): 1.1100, (B): 1.8310 (26 Oct 2000), then followed by another impulsive wave (C) with wave III ended at 0.9630 (Mar 2008). Under this count, correction in wave IV has possibly ended at 1.1730 and wave V already broke below support at 0.9630 and met indicated downside target at 0.7500 and 0.7400. The reversal from 0.7068 suggests the wave V has possibly ended and the breach of resistance at 0.9595 add credence to this view and indicated upside target at 1.0000 had been met, however, the sharp retreat from 1.0296 to 0.7401 suggests choppy trading would be seen but price should stay above said record low at 0.7068.
EUR/JPY Elliott Wave Analysis
EUR/JPY - 127.62
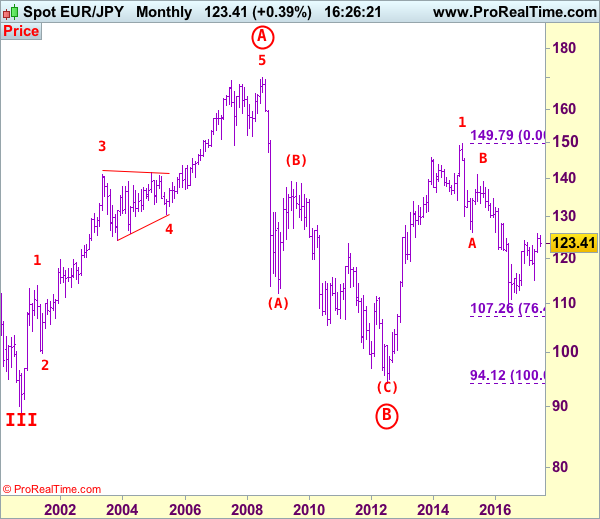
EUR/JPY: Wave v as well as larger degree wave (C) ended at 94.11 and first leg of larger degree wave C upmove has possibly ended at 149.79 and wave 2 correction has possibly ended at 109.49.
As the single currency has rallied after breaking previous resistance at 125.82, adding credence to our bullish view that recent upmove is still in progress and upside bias remains for medium term uptrend to extend further gain to 129.00 (61.8% Fibonacci retracement of 141.06-109.49), then towards 129.50, however, near term overbought condition should prevent sharp move beyond 130.00, risk from there has increased for a retreat to take place later.
The daily chart is labeled as attached, early selloff from 169.97 (July 2008) to 112.08 is wave (A) of B instead of end of entire wave B and then the rebound from there to 139.26 is wave (B), hence, wave (C) has possibly ended at 94.12 with a diagonal triangle as labeled in the daily chart, hence upside bias is seen for further gain. Recent rally above indicated retracement level at 116.69 (50% Fibonacci retracement of the intermediate fall from 139.26-94.12) adds credence to this view and signal major reversal has commenced but first leg of this wave C has possibly ended at 149.79, hence wave 2 has commenced with wave A ended at 126.09, followed by wave B at 141.06, wave C commenced and could have ended at 109.49, above 126.00 would add credence to this view, then headway to 130.00 would follow.
On the downside, although initial pullback to 127.30 cannot be ruled out, reckon support at 126.49 would contain downside and bring another upmove to aforesaid upside targets. Only a drop below said previous resistance at 125.82 (now support) would defer and suggest top is possibly formed, bring correction to 125.15-20 but previous resistance at 124.65 would hold, bring another upmove later. In the unlikely event, euro drops below 124.65 on a daily basis, this would signal a temporary top is formed instead, then further fall to 124.00 and later towards support at 123.66 would follow.
Recommendation: Buy at 126.50 for 128.50 with stop below 125.50.

To re-cap the corrective upmove from the record low of 88.93 (18 Oct 2000), the wave A from there is subdivided as: 1:88.93-113.72, 2:99.88 (1 Jun 2001), 3:140.91 (30 May 2003), 4:124.17 (10 Nov 2003) and 5 ended at record high of 169.97 (21 Jul 2008). The brief but sharp selloff to 112.08 is viewed as a-b-c x a-b-c wave (A) of B. The subsequent rebound to 139.26 is (B) of B and (C) of (B) has possibly ended at 94.12 and in any case price should stay well above previous chart support at 88.93, bring rally in larger degree wave C towards 150.00.
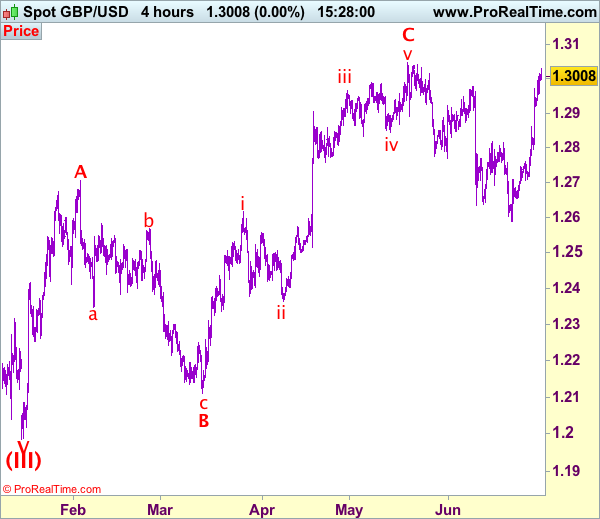
Trade Idea: GBP/USD – Buy at 1.2870
GBP/USD – 1.2981
Recent wave: Wave V of larger degree wave (III) has ended at 1.1986 and major correction has commenced from there for gain to 1.3000 and 1.3140-50
Trend: Near term down
Original strategy :
Buy at 1.2870, Target: 1.3020, Stop: 1.2810
Position: -
Target: -
Stop: -
New strategy :
Buy at 1.2870, Target: 1.3020, Stop: 1.2810
Position: -
Target: -
Stop:-
Although sterling edged higher to 1.3030 earlier today, as cable has retreated after faltering below recent high at 1.3048, suggesting consolidation below this level would be seen and pullback to support at 1.2916 cannot be ruled out, however, reckon previous resistance at 1.2861 would turn into support and limit cable’s downside, bring another rise later, above said resistance at 1.3030 would extend the rise from 1.2589 low towards recent high at 1.3048 but break there is needed to retain bullishness and bring subsequent headway towards 1.3090-00.
Our preferred count on the daily chart is that cable's rebound from 1.3500 (wave (A) trough) is unfolding as a wave (B) with A ended at 1.7043, followed by triangle wave B and wave C as well as wave (B) has ended at 1.7192, the subsequent selloff is the larger degree wave (C) which is still unfolding with minor wave (III) of larger degree wave 3 ended at 1.1986, hence wave (IV) correction is in progress which could either be a triangle wave (IV) of a complex formation but upside should be limited to 1.3500 and price should falter well below 1.4000, bring another decline in wave (V) of 3 for weakness to 1.1500, then 1.1200.
On the downside, whilst initial pullback to 1.2900-10 is likely, reckon 1.2861 (previous resistance turned support) and bring such a rise. Below support at 1.2794 would abort and signal top is formed instead, risk further fall to 1.2750, then towards 1.2706 support.