Sample Category Title
No More Easy Money?
On Thursday, the US Commerce Department released GDP (Annualized QoQ) showing a 1.4% annual rate compared to the 1.2% posted in the previous month. This slight increase shows that the US economy slowed less sharply in Q1 than expected, due to higher consumer spending and an increase in exports, which suggests a better growth outlook for the year. US Consumer spending rose to 1.1%, the weakest reading since Q2 of 2013 but almost double the 0.6% reported in May.
The underlying trend of a tightening labour market was reinforced by the latest US Labor Department report of the number of Americans filing for unemployment benefits last week rising slightly to 244K.
EUR surged to its highest in over a year on Thursday, whilst GBP, bond yields and global equities also climbed, as a plethora of hawkish comments from central bankers signaled the era of easy money might be coming to an end. EURUSD surged to as high as $1.1444 overnight, its strongest since May 2016. Currently EURUSD is trading around 1.1420.
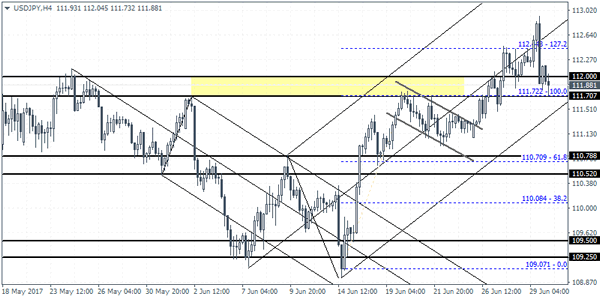
USD weakness against JPY continued with data showing Japanese core consumer prices rose 0.4% in May from a year earlier in its fifth straight month of gains, although inflation remains well below the central bank’s 2% target. USDJPY fell to 111.727 overnight, after losing 0.2 percent on Thursday. It was heading for a 1.2 percent gain for the month, but is down 4.2% this year. Currently USDJPY is trading just above 112.00.
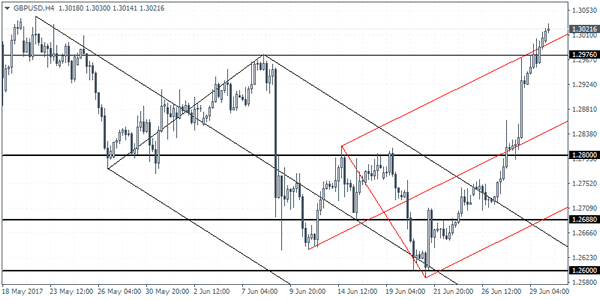
Bank of England Chief Economist Haldane mirrored the comments made on Wednesday by BoE Governor Carney by stating “the BoE needs to look seriously at hiking rates”. These comments added to recent GBP strength pushing GBPUSD to 1.30292 in early trading today. This is the first time in 5 weeks that cable has been above 1.30 and close to its highest levels in 9 months. GBPUSD is currently trading around 1.3010.
Having slipped to a 10-month low last week Oil has rebounded more than 7% as a weekly decline in US production eased concerns of a deepening global over supply. WTI and Brent were both up over 0.5% on the day, touching highs of $45.42pb and $48.04pb respectively. In early trading WTI is currently trading around $45.34pb and Brent is currently trading around $47.92pb.
Benefitting from USD weakness has seen Gold rise, hitting an early Friday high of $1,248.10 before retracing back to trade currently near $1,243.
U.S. inflation remains in focus today with the favorite Fed measure: the core PCE deflator. The markets are expecting the month-over-month number to ease to 0.1% for May and the annual rate slowing to 1.4%. Personal income and spending are also forecast to have grown more slowly than the 0.4% rise seen in April.
US Final Q1 GDP Revised Higher. Dollar Continues To Fall
The US dollar continued to post losses yesterday as EURUSD and GBPUSD breached 1.1400 and 1.3000 levels respectively. The bearish sentiment in the market for the U.S. dollar was clearly evident by the rally that has maintained a strong momentum so far.
Yesterday, the final Q1 GDP report showed that the US economy advanced 1.4%. This was the third upward revision since the preliminary report. Despite the upbeat data, corporate profits declined. For the markets, the focus was all about central bank officials and the intention to tighten monetary policy.
Looking ahead, the economic data today will include UK's final revised quarterly GDP while Canada's monthly GDP numbers are coming out. The US PCE data is also due with core PCE expected to rise 0.1% on the month, slower than 0.2% previously. Weaker PCE alongside consumer spending and income could continue to add to the bearish sentiment for the US dollar.
EURUSD intraday analysis
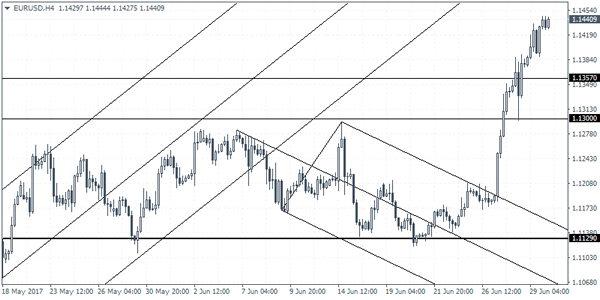
EURUSD (1.1440): EUR/USD continued to surge higher with the current rally posting three consecutive days of gains. Price action has clearly breached the 1.1400 price level with support on the daily chart seen at 1.1200. On the 4-hour chart, the momentum remains strongly biased to the upside with 1.1450 likely to be the next target. Any reversals will need to show a strong confirmation alongside fundamentals that could validate the reversal in price. In the near term, buying dips in EURUSD remains the major theme. Immediate support at 1.1357 is seen followed by a dip to 1.1300. As long as EURUSD remains within this support zone, we could expect to see short-term gains continuing in the currency pair.
GBPUSD intraday analysis
GBPUSD (1.3021): GBPUSD has breached the 1.3000 level and is also strongly positioned to the upside. Support on the daily chart is seen at 1.2975 which could offer a near-term decline for prices. A daily close below 1.2975 could, however, signal a decline towards the next lower support level seen at 1.2800 - 1.2780. On the 4-hour chart, the GBPUSD price action shows a strong risk of correction with no support being tested between 1.2800 and the current levels of 1.3000. Therefore, long positions above 1.2976 should be cautious as this exposes the risk of a correction in prices.
USDJPY intraday analysis
USDJPY (111.88): USDJPY has managed to trade above 112.00 level, but price action closed with a doji yesterday. A bearish close today could potentially signal a correction to the downside. On the 4-hour chart, price action is seen testing the 111.72 level which marks the top of the bull flag pattern. Bounce off this level is required and a close above 112.44 for further continuation towards 113.36. Failure to break above the previous high could result in USDJPY staying range bound. In this case, the support at 111.72 remains critical as it could potentially break and confirm the downside in USDJPY.
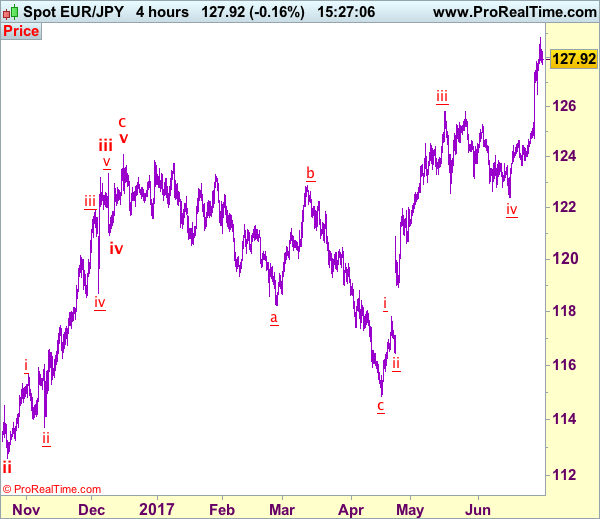
Trade Idea: EUR/JPY – Buy at 127.00
EUR/JPY - 128.00
Recent wave: wave v of (C) ended at 94.12 and major correction in wave A has ended at 149.79
Trend: Near term up
Original strategy:
Buy at 127.45, Target: 129.45, Stop: 126.85
Position: -
Target: -
Stop: -
New strategy :
Buy at 127.00, Target: 129.00, Stop: 126.40
Position: -
Target: -
Stop:-
As the single currency has eased after rising to 128.83 yesterday, suggesting consolidation below this level would be seen and pullback to 127.50 is likely, however, reckon 127.00 would limit downside and bring another rise later, above said resistance at 128.83 would extend recent upmove to 129.00-10, however, near term overbought condition should prevent sharp move beyond 129.50-60 and reckon psychological level 130.00 would hold from here, risk from there has increased for a retreat later.
In view of this, we are looking to reinstate long on pullback as 127.00 should limit downside. Below support at 126.49 would defer and suggest top is possibly formed, risk correction to 126.00 and later towards 125.40-50.
Our latest preferred count is that wave (ii) is ABC-X-ABC which ended at 123.33 and wave (iii) is unfolding with wave iii ended at 100.77, followed by wave iv at 111.57 and wave v as well as the wave (iii) has ended at 97.04, followed by wave (iv) at 111.43 and wave (v) has ended at 94.12 which is also the end of the larger degree v, this also implied the major wave (C) has also ended there, hence major correction has commenced from there with (A) leg unfolding in its lower degree wave c which has possibly ended at 145.69. Under this count, A-B-C wave (B) has commenced with A leg ended at 136.23, wave B at 143.79 and wave C has possibly ended at 149.79.
Our larger degree count is that the decline from 139.26 is wave (C) and is sub-divided into a diagonal triangle i-ii-iii-iv-v with wave i - 105.44, wave ii- 123.33, wave iii - 97.03, wave iv - 111.43, followed by the final wave v as well as the end of wave (C) at 94.12, this also mark the bottom of larger degree wave B. Under this count, major rise in wave C has commenced as an impulsive wave with minor wave III ended at 145.69, wave V is still in progress for further gain to 150.00. Having said that, this so-called wave V could well be the first leg of larger degree 5-waver wave C and this wave C should bring at least a retest of wave A top at 169.97 (July 2008).
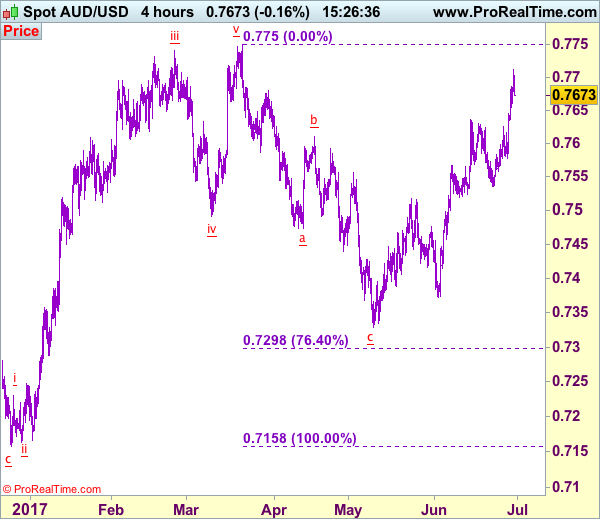
Trade Idea: AUD/USD – Exit long entered at 0.7595
AUD/USD – 0.7675
Recent wave: Wave 5 ended at 1.1081 and major correction has commenced for fall to 0.7000 and then towards 0.6500-10
Trend: Near term up
Original strategy :
Bought at 0.7595, Target: 0.7745, Stop: 0.7555
Position: - Long at 0.7595
Target: - 0.7745
Stop: - 0.7555
New strategy :
Exit long entered at 0.7595
Position: - Long at 0.7595
Target: -
Stop:-
Although aussie extended recent upmove to 0.7712, current retreat suggests consolidation below this level would be seen and pullback to 0.7645-50 is likely, however, reckon previous resistance at 0.7625 would limit downside and price should stay above 0.7575-80, bring another upmove probably next week.
In view of this, would be prudent to exit long entered at 0.7595 and look to reinstate long on pullback. Above said resistance at 0.7712 would extend recent upmove to chart resistance at 0.7750 but overbought condition should limit upside and price should falter below 0.7785-90.
On the 4-hour chart, the move from 0.8066 is the wave 5 with i: 0.8860, ii: 0.8315, wave iii is an extended move ended at 1.0183, iv: 0.9706 and wave v has ended at 1.1081 (also the top of entire wave 5). The subsequent selloff is the major correction which is unfolding as ABC-X-ABC and 2nd A leg has ended at 0.8848, followed by a-b-c wave B which ended at 0.9758, hence, 2nd C wave is now in progress and indicated downside target at 0.7000 and 0.6950 had been met, so further fall to 0.6710-20 cannot be ruled out.
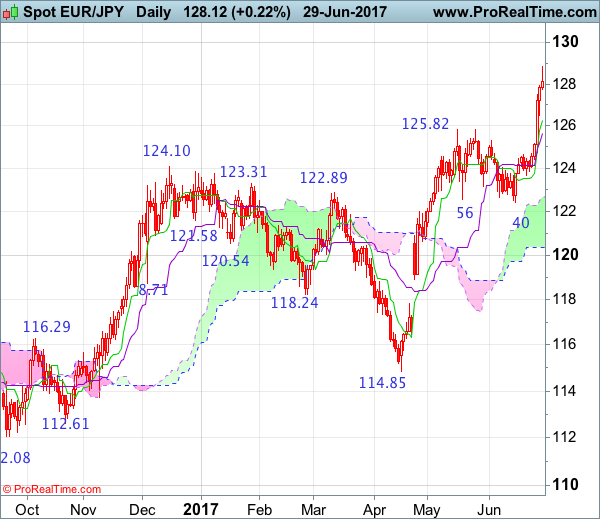
EUR/JPY Candlesticks and Ichimoku Analysis
Weekly
• Last Candlesticks pattern: Window
• Time of formation: 24 April 2017
• Trend bias: Up
Daily
• Last Candlesticks pattern: Hammer
• Time of formation: 18 May 2017
• Trend bias: Up
EUR/JPY – 128.19
As the single currency has surged this week and broke above previous resistance at 125.82, adding credence to our bullish view that medium term rise from 109.49 low is still in progress, hence upside bias remains for this move to extend further gain to 129.00-10, then 129.45-50 (100% projection of 109.49-124.10 measuring from 114.85), however, near term overbought condition should prevent sharp move beyond psychological resistance at 130.00 and reckon 130.50-60 would hold from here, risk from there has increased for a retreat to take place later.
On the downside, whilst initial pullback to 127.45-50 cannot be ruled out, reckon downside would be limited to 126.90-00 and the Tenkan-Sen (now at 126.25) would hold, bring another upmove later to aforesaid upside targets. A daily close below the Kijun-Sen (now at 125.62) would defer and suggest a temporary top is possibly formed instead, risk correction to 125.00-10, then 124.45-50, however, reckon downside would be limited to 124.00-10 and price should stay above support at 123.66, bring another upmove next month.
Recommendation: Buy at 127.00 for 129.50 with stop below 126.00.
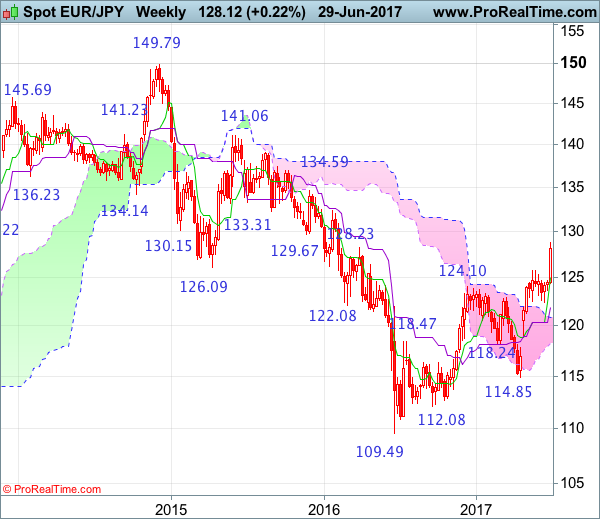
On the weekly chart, this week’s rally above previous resistance at 125.82 looks set to form a long white candlestick, suggesting the medium term rise from 109.49 low has resumed and bullishness remains for this move to extend further gain to 129.00, then 129.45-50 (100% projection of 109.49-124.10 measuring from 114.85), however, reckon upside would be limited to psychological level at 130.00 and 131.00 should hold, the single currency should falter well below previous chart resistance at 132.33), risk from there is seen for a retreat to take place later.
On the downside, although initial pullback to 127.00-10 cannot be ruled out, reckon 126.50 would limit downside and euro shall head north again from there to aforesaid upside targets. A drop below said previous resistance at 125.82 (now support) would defer and risk correction to 125.00, then towards 124.50, however, still reckon downside would be limited to 124.00 and support at 123.66 should remain intact, bring another rally in Q3.
Currencies: Dollar Cannot Find Its Composure
Sunrise Market Commentary
- Rates: German 10-yr yield ready for test of 0.5%
EMU inflation could beat expectations, suggesting that the sell-off of the Bund can continue at least until the German 10-yr yield tests 0.5% resistance. Risks for the US PCE deflator are on the downside of consensus. If so, it will be interesting to see whether US Treasuries can profit or not. The current repositioning and Fed Yellen's credibility might hamper gains. - Currencies: Dollar cannot find its composure
EUR/USD continued its rally and is now closing in on the key resistance zone which, if broken, would end the 3-yr sideways trading that followed the downtrend of the pair. We think it is too early for such a break though and thus remain cautious about the possibility of substantial short term further EUR/USD gains.
The Sunrise Headlines
- US stock markets slid around 0.8% in a rising yield environment with Nasdaq underperforming as a selloff in tech stocks accelerated (-1.44%). Asian stock markets also lose up to 1% (Japan underperforming)
- UK PM May won parliamentary approval for her legislative program after being forced into a concession on abortion rights to stave off a defeat. This episode showed just how vulnerable May is and how quickly she can capitulate.
- Brexit is hurting sentiment, with both UK consumers and businesses expressing doubts about the outlook. GfK's consumer-confidence dropped to -10 in June (–5 in May) amid political uncertainty and declining spending power.
- Japanese inflation reading disappointed and remain very low, both the national May readings and the Tokyo June outcomes. The June Tokyo CPI ex-fresh food and energy even returned to negative territory (-0.2% Y/Y).
- Japan's unemployment rate rose to 3.1% in May, hitting its highest level this year while the ratio of jobs to applicants continued to rise from 1.48 to 1.49 (above expectations of a stabilisation).
- China's official manufacturing PMI came in at 51.7 (consensus 51). The services measure also rose, to 54.9 from 54.5. Economic activity is more robust than expected, giving China room to focus on financial risks and the property sector.
- Inflation readings are key today with Eurozone CPI (German data surprised positively yesterday) and US PCE deflator. Chicage PMI, Michigan consumer confidence (final), UK Q1 GDP (final),German unemployment and German retail sales are also on the calendar.
Currencies: Dollar Cannot Find Its Composure
Dollar can't find its composure in repositioning
The repositioning after Mr. Draghi turn towards the start of normalisation on Tuesday continued in various markets. The euro profited, helped by narrowing yield differentials, strong EMU economic sentiment data and higher than expected German inflation. Even equity weakness (Europe & US) favoured the euro yesterday. US eco data were near consensus and ignored. EUR/USD opened around 1.1380 and closed near the intraday highs at 1.1440. The fate of USD/JPY was different. European equity weakness had initially little impact on the pair, as higher US yields and wider rate differentials trumped weak equities and benefited the dollar. USD/JPY reached an intraday high at 112.93, but the safe haven motive took the driver's seat when WS hit the skids, allowing the yen to recover and leaving the pair little changed in the close at 112.18 (versus 112.30 previously).
Overnight, Asian equities lose up to 1%. Japanese equities underperform on weak Japanese eco data and modest safe haven-related yen strength. Chinese PMI's were better than expected, which confirms the economic improvement. However, will markets take notice during the great repositioning? USD/JPY weakened somewhat and trades just below 112. EUR/USD is nearly unchanged at 1.1440.
The US Personal income and spending report (May) will attract a lot of attention. The market expects a weak 0.1% M/M, which would be disappointing, but nevertheless keeps spending on track for 2.5%+ growth in Q2. Given the decline in May CPI, we might also see a small drop in the (core) PCE deflator, which might not gone unnoticed and is dollar negative. The Chicago PMI for May reached its highest level in more than 2 years (59.4). Given some weakening of the orders component, we expect a somewhat lower overall outcome for June (consensus: 58) The final Michigan consumer sentiment might be slightly revised higher from the preliminary 94.5 (based on a strong conference board confidence). Following higher than expected German (and Spanish) inflation figures, the risks for the EMU HICP inflation is on the upside of expectations (1.2% Y/Y for the headline and 1% Y/Y for the core).
The US eco data won't support the dollar, but higher EMU inflation may already have been partially (?) discounted after the upward surprise of German (and Spanish). Is the re-positioning on the possible change in the EMU and global turn to a more normal monetary policy over and thus will rate differentials stabilize? In that case, dollar weakening against the euro may be in for a pause/correction. We wouldn't pre-emptively position for such a scenario as the momentum in EUR/USD is still intact. The US dollar desperately needs good news (both on activity and price data) for markets to focus again more on the Fed's policy normalisation process. The dollar could perhaps get more support next week, with the payrolls and ISM.
Yesterday's intraday price development in USD/JPY was again disappointing. Core yields and yield differentials primed in the morning to the benefit of the dollar, before yen favourable equity weakness drove the action in the US session. We remain cautious on USD/JPY longs.
Technical picture: Euro prevails, USD struggles
Poor US data, US political upheaval and strong EMU eco data propelled EUR/USD higher since April, but a first test of the 1.1300/66 ahead of the FOMC decision was rejected. A combination of hawkish ECB comments and weaker eco data pushed EUR/USD this week above the 1.1300/66 resistance area with a new high at 1.1448 reached yesterday. We want a weekly close above the key resistance to consider it really broken. However, the key resistance area to watch out for is now the 1.15 area with eventual extensions to previous test of this zone at the 1.1616/1.1714 LT correction tops. This would end the long consolidation period that followed the sharp decline of EUR/USD in 2014/early 2015. Such a key area will be difficult to break for now. A drop below 1.1119 would suggest the pair enters calmer waters.
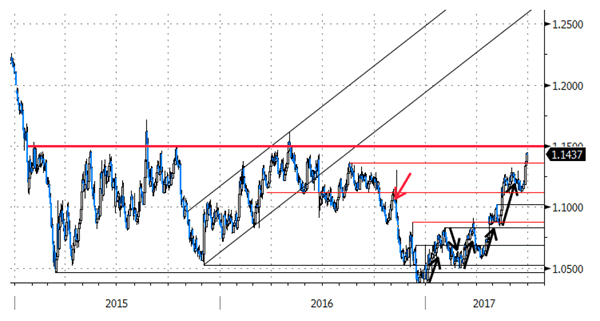
EUR/USD nears key resistance that if broken would make the LT trend euro positive. Difficult for now
EUR/GBP
No post-Carney follow-through gains for sterling
Following wide swings on comments by Draghi and Carney in previous days, the EUR/GBP cross rate was an area of perfect calm yesterday. The pair was locked in a very narrow range close to the 0.88 pivot. Cable followed EUR/USD higher and closed at the 1.30 level. Overnight the pair tried to force its way to the ST key resistance at 1.3048, but it retreated back to the 1.30 level where it is staying now.
Consumer confidence declined quite sharply in June, according to the GfK report published overnight. The Lloyds business barometer, on the contrary, improved to 30 in June from 27 previously. The report won't leave traces in the European session. Later today, the UK final Q1 GDP report will be released together with the current account, the index of services and total investment. We don't think these will affect sterling trading much. Sterling might get direction from the main crosses. All in all, we see EUR/GBP staying below the key resistance of 0.8854/66 and cable's fate will depend on EUR/USD. If the cross would move higher, cable may test the 1.3048 resistance but a break looks unlikely.
From a technical point of view, EUR/GBP set a minor top north of the 0.8854/66 resistance (2017 top), but a sustained break didn't occur. Recent setbacks will probably block further gains ST. A return below the 0.8655 correction low would indicate easing pressure on sterling. Such a break lower will be difficult. A EUR/GBP buy-on-dips approach remains favoured.
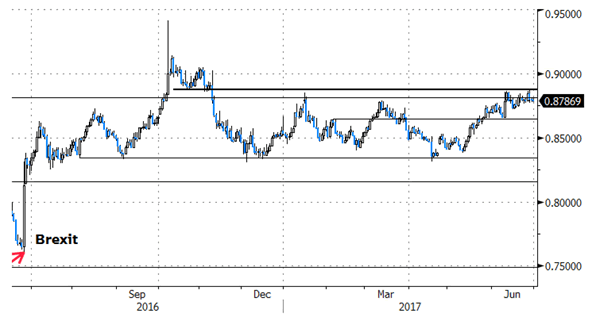
EUR/GBP: EUR/GBP topside test rejected, but danger new test not excluded. Prefer buy-on-dip
USD/CAD Candlesticks and Ichimoku Analysis
Weekly
• Last Candlesticks pattern: Shooting doji
• Time of formation: 02 May 2016
• Trend bias: Up
Daily
• Last Candlesticks pattern: Bearish engulfing
• Time of formation: 5 May 2017
• Trend bias: Up
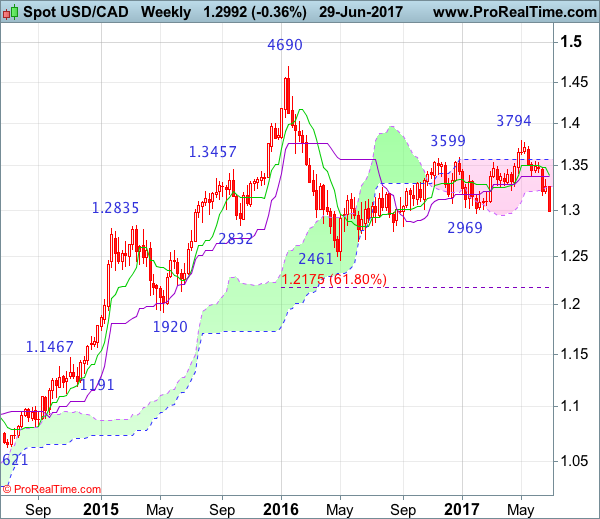
USD/CAD – 1.2992
The greenback has tumbled after meeting renewed selling interest at 1.3348 and decline has accelerated after breaking below previous support at 1.3165 (now resistance), signaling the decline from 1.3794 top is still in progress and downside bias remains for this move to extend further weakness to previous support at 1.2969, however, a sustained breach below this level is needed to retain bearishness and signal early erratic rise from 1.2461 has ended there, bring further fall to 1.2900-10 and later towards 1.2850 but reckon support at 1.2822 would hold and price should stay well above support at 1.2763.
On the upside, whilst initial recovery to 1.3050-55 and possibly towards 1.3100 cannot be ruled out, reckon upside would be limited and price should falter below previous support 1.3165 (now resistance), bring another decline later. A daily close above this level would defer and bring a stronger rebound to 1.3180-85 and then test of previous support at 1.3208 but price should falter below the Kijun-Sen (now at 1.3267) and bring another decline later.
Recommendation: Sell again at 1.3100 for 1.2850 with stop above 1.3200.

On the weekly chart, this week’s selloff after breaking below support at 1.3165 looks set to form another long black candlestick and bearishness remains fort the fall from 1.3794 top to extend weakness to previous support at 1.2969, however, a sustained breach below this level is needed to retain bearishness and signal the entire recovery from 1.2461 low (2016 low) has ended at 1.3794, then further fall to 1.2900 and then 1.2850 would follow but support at 1.2822 should limit downside and price should stay above another previous support at 1.2763 due to near term oversold condition.
On the upside, although initial recovery to 1.3070-80 cannot be ruled out, reckon 1.3100-10 would limit upside and bring another decline later. A weekly close above said previous support at 1.3165 would defer and risk a stronger recovery to 1.3200-10 but still reckon 1.3270-75 would limit upside and price should falter below resistance at 1.3348 and bring another selloff next month.
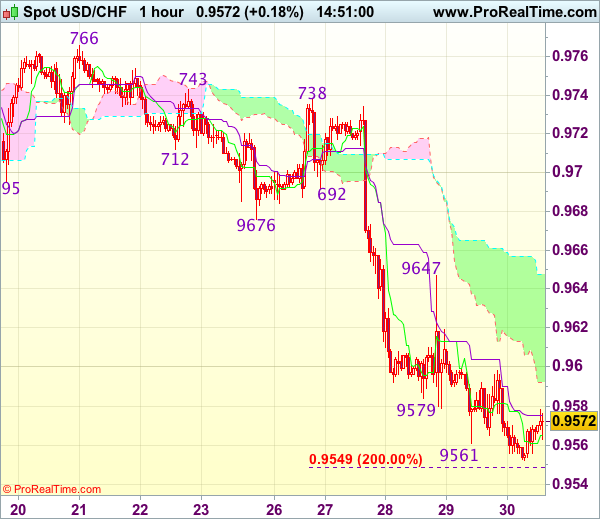
Trade Idea : USD/CHF – Sell at 0.9645
USD/CHF - 0.9575
Most recent candlesticks pattern : N/A
Trend : Near term down
Tenkan-Sen level : 0.9666
Kijun-Sen level : 0.9575
Ichimoku cloud top : 0.9648
Ichimoku cloud bottom : 0.9592
Original strategy :
Sell at 0.9645, Target: 0.9545, Stop: 0.9680
Position : -
Target : -
Stop : -
New strategy :
Sell at 0.9645, Target: 0.9545, Stop: 0.9680
Position : -
Target : -
Stop : -
As the greenback has recovered after marginal fall to 0.9552, suggesting minor consolidation would be seen and recovery to 0.9600-10 is likely, however, reckon resistance at 0.9647 would limit upside and bring another decline later, below said support would signal recent decline from 0.9771 top is still in progress, hence further weakness to 0.9545-49 (2 times extension of 0.9771-0.9676 measuring from 0.9738) would follow but reckon downside would be limited to 0.9525-30 (50% projection of 1.10100-0.9613 measuring from 0.9771) and 0.9500 should hold, price should stay above 0.9470 (61.8% projection), bring rebound later.
In view of this, would not chase this fall here and we are looking to sell dollar on recovery as resistance at 0.9647 should limit upside. Only above previous support at 0.9676 (now resistance) would defer and suggest a temporary low is formed, risk test of another previous support at 0.9692.
Trade Idea : GBP/USD – Buy at 1.2920
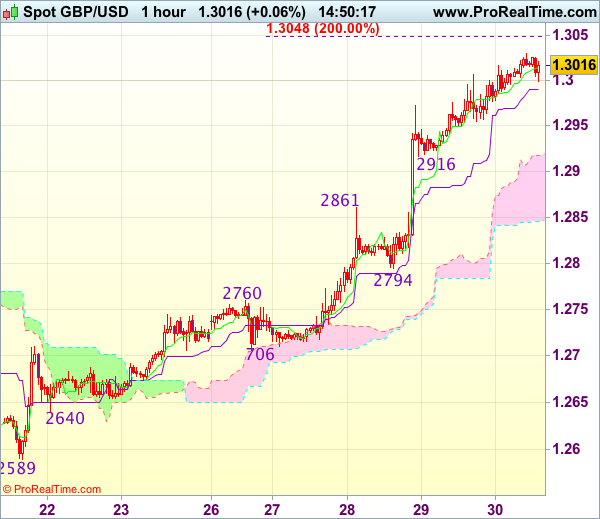
GBP/USD - 1.3016
Most recent candlesticks pattern : N/A
Trend : Near term up
Tenkan-Sen level : 1.3015
Kijun-Sen level : 1.2992
Ichimoku cloud top : 1.2917
Ichimoku cloud bottom : 1.2846
Original strategy :
Buy at 1.2895, Target: 1.2995, Stop: 1.2860
Position : -
Target : -
Stop : -
New strategy :
Buy at 1.2920, Target: 1.3020, Stop: 1.2885
Position : -
Target : -
Stop : -
As cable has continued trading with a firm undertone after this week’s rally, adding credence to our bullish view that recent upmove is still in progress and may extend further gain towards recent high 1.3048, however, loss of near term upward momentum should prevent sharp move beyond 1.3075-80 today and reckon 1.4100 would hold on first testing, risk from there has increased for a retreat to take place later.
In view of this, we are looking to buy cable again on pullback as support at 1.2916 should limit downside and bring another rally. Below 1.2890-95 would defer and risk test of previous resistance at 1.2861, break there would suggest a temporary top is formed instead, risk weakness to 1.2830-35 but support at 1.2794 should remain intact.
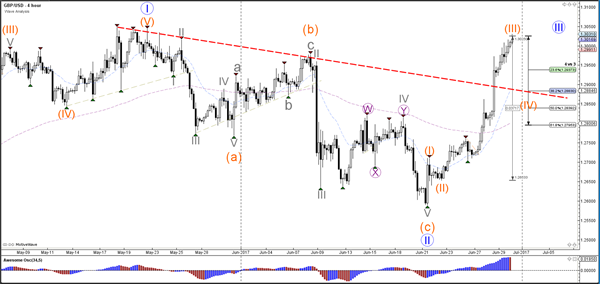
Daily Technical Analysis: GBP/USD Rising Wedge Pattern Sets Up Wave 4 Pullback
Currency pair GBP/USD
The GBP/USD could build a potential break, pullback, and continuation pattern after breaking the resistance trend line (dotted red), which could be explained by the potential wave 3, 4 and 5 (orange).
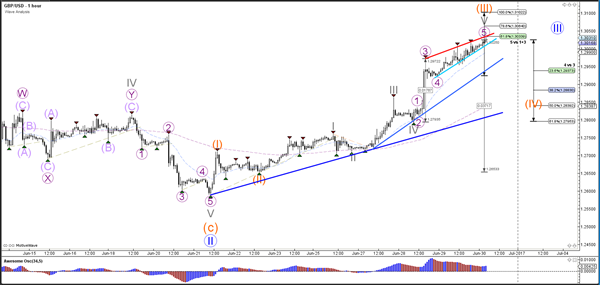
The GBP/USD seems to be in the final waves 5 of wave 3 (orange). Price action seems to be building a rising wedge chart pattern (red/blue lines), which could start a reversal if price breaks below support. A potential wave 4 (orange) could see support and a new bullish bounce at the Fibonacci levels of wave 4 vs 3.
Currency pair EUR/USD
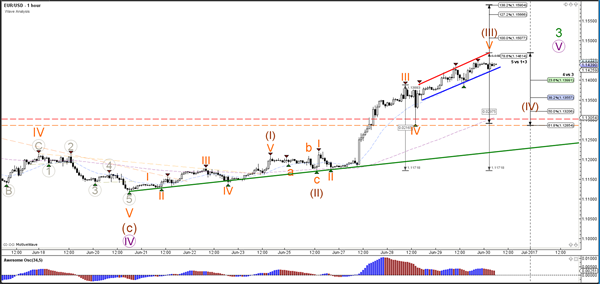
The EUR/USD bullish continuation is part of a wave 3 (green). Price action is moving towards the Fibonacci targets of wave 5 vs 1+3 in a bullish channel.
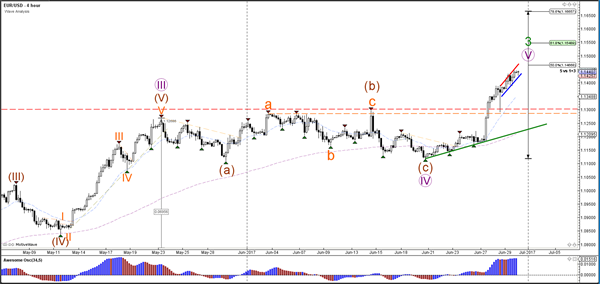
The EUR/USD is in a wave 5 channel indicated by the trend lines (blue/red). Once wave 5 (orange) is completed, price will probably retrace back to the Fibonacci levels of wave 4 (brown).
Currency pair USD/JPY
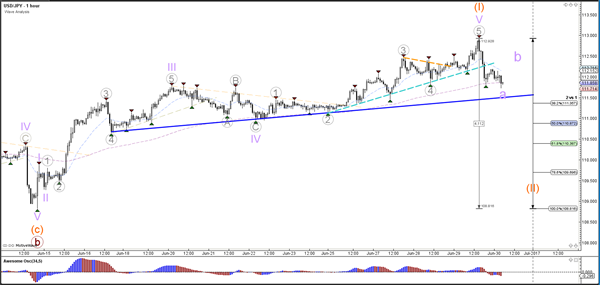
The USD/JPY seems to have completed wave 5 (purple), which is most likely part of a wave 1. The retracement for wave 2 (orange) could use the Fibonacci levels for a bounce but a break below the 100% Fib level at 1.0881 invalidates the wave 2.
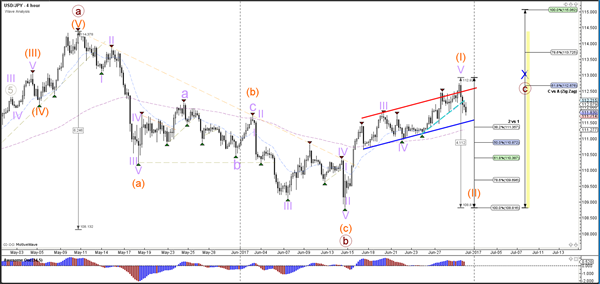
The USD/JPY could be building an ABC (purple) within wave 2 (orange).