
Sample Category Title
Japan Unemployment Sends a Warning Signal | EURJPY, EURCHF
Unemployment rose unexpectedly and now sits above its 1yr average, an occurrence not seen since 2011. Industrial production also surprised to the downside by contracting by 3.3%. EURJPY tests support yet look ready to break higher over the coming week/s.
The employment sector has been one of the firmer parts of the economy, so today's rise of unemployment to 3.1% from 2.8% was rather unexpected. In absolute terms, a 0.3-point rise is its largest monthly increase since August 2013 and it now sits above its 12-month average. This is the first-time unemployment has risen above the 1yr average since December 2008, so if history is to repeat itself, perhaps this marks a significant turning point in the economy. Before we get ahead of ourselves e wold prefer to see another month or two above it, but it remains something of importance to monitor going forward.
Industrial production also threw a curve ball by contracting -3.3% MoM, its largest decrease since May 2011. This will weigh on GDP and raise concerns for the BoJ behind closed doors. We say that because we doubt they'll revise their rosy outlook for the economy until it is forced upon them.
There is not a huge amount to say about inflation other than it is ticking along at very low rates. There is little hope if this recovering whilst wage growth and consumer spending remain low. The larger issue arises if it begins to roll over once more.
Price action on EURJPY appears icreasingly bullish and now looks to extend gains towards the 132.34 highs. The gap higher (yellow box) marks the first round of the French elctions and is deemend to be a breakaway gap. This tends to mark the beginnings of a trend, alough typically we would see them following a bottom or top pattern. In this case it marked the end of a correction. At time of writing the weekly candle has hit resistance at 128.27. It will be pivotal level going forward and if sentiment allows, may provid support next week if Monday provides a gap higher above it.
If you were to pull up a chart of CHFJPY, you'd see a very similar setup. However, to help decide which of the two we'd prefer to consider for a long opportunity, we can look at EURCHF. The break of 1.0909 two sessions ago has already had this key level respected as support, which allows EURCHF to close higher for a 5th consecutive session. Although the pattern is reminiscent of a double bottom, we would need to see the recent trough higher than the first for tit to count. EURCHF appears ready to move up to 1.098 over the coming week/s, so we could either trade long EURCHF or EURJPY. As EURCHF appears bullish, we opt to choose EURJPUY over CHFJPY for long positions.
Back to EURJPY, it is debatable if you would want to initiate a long position to hold over the weekend. It is quite common for traders to hedge positions with Yen over the weekend, which adds potential for Yen to strengthen near the end of the week. However, there may be an opportunity to trade intraday bullish or bearish setups, depending on which side if 128.27 we find ourselves. As this also coincides with MR2 then we may find a correction occurs first, before the trend continues. As this is the last trading day of the month, the monthly pivots will be recalculated on Monday. But our next target remains 132.33 and we will monitor for setups next week.
USD/CAD Canadian Dollar Continues Climbing Versus US Dollar
The Canadian dollar gained 0.20 percent on Thursday thanks to a rise in oil prices and despite an improvement to the final GDP reading for the first quarter in the US. Oil rose 0.40 percent after the a slowdown in US production has energy rising in the last 6 sessions.
The main factor driving the strength of the loonie has been the shifting winds of central bank rhetoric. The Bank of Canada (BoC) Deputy Governor Carolyn Wilkins on a routing speech put the end of easing firmly on the table. She was followed by Govneor Stephen Poloz a day later to reiterate the message. The head of the BoC has hammered the message this week, as he attends the European Central Bank (ECB) Forum in Portugal, that the rate cuts have done their job, but tried to not too much emphasis on a rate hike with the upcoming July monetary policy meeting.
The Canadian central bank is part of a group of central banks that have shifted their verbal intervention of late. The Fed issued a warning to markets in March ahead of that month’s Federal Open Market Committee (FOMC) meeting though Fed member comments that the market was not pricing in a rate hike, which eventually happened. After a patient Fed for most of 2014, 2015 and 2016 it was a surprise to see a proactive central bank that has now 2 rate hikes in 2017 and continues to signal a third one as well as starting to reduce its balance sheet.
The Bank of Canada is a special case as the European Central Bank (ECB) and the Bank of England (BoE) have quantitive easing programs that will have to be gradually wound down whereas Stephen Poloz can jump on the rate hike bandwagon with relative speed. The BoC governor also does not have to worry about a vote as there is no monetary policy committee.
The timing of the first rate hike will be challenging. The three factors driving the loonie will have to be taken into consideration. Oil prices have been stable but the showdown between the US shale producers and the OPEC output deal nations is not addressing the tepid demand for energy around the world. Nafta renegotiations starting in August could change the economic landscape for Canada and that is something the central bank will have to address. The third factor is the Fed itself. The American economy has been softer in 2017 raising questions about what impact a third rate hike and a lower Fed balance sheet could have in the second half of the year.
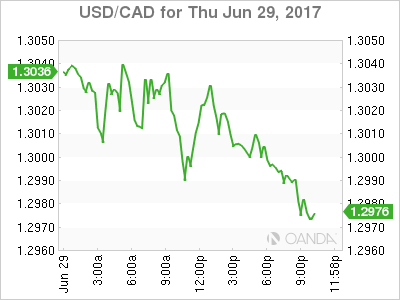
The USD/CAD fell 0.208 percent in the last 24 hours. The currency is trading at 1.3002 as the loonie has broken below the 1.30 price level briefly. The Canadian dollar has been boosted by repeated comments from senior policy makers from the Bank of Canada (BoC) that have hinted at a rate hike coming sooner rather than later. Before June 11 the market was not expecting a rate move by the BoC, with the first quarter dependant on economic fundamentals. Now after the comments from two deputy Governors and the Governor himself there is now a higher than 60 percent chance the rate move could come in the July meeting.
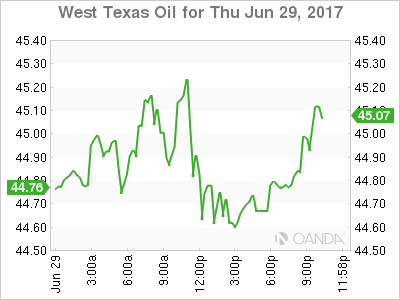
Oil gained 0.404 percent on Thursday. The West Texas Intermediate is trading at $44.69. The change in fortune in oil prices came during the past two weekly crude inventory releases in the US. The expected large buildups have failed to materialize and US production has been hit by a storm in the Gulf of Mexico. Organization of the Petroleum Exporting Countries (OPEC) members Nigeria, Iran and Libya have increased their production but other members have complied with cuts and are still profitable although they face various challenges if they want to keep cutting to help prices rise, only to see US, Brazil and Canada producers take advantage as they are not bound by any deal to limit their output.
Market events to watch this week:
Friday, June 30
4:30 am GBP Current Account
8:30 am CAD GDP m/m
Gold Softens As US GDP Beats Estimate
Gold has lost ground in the Thursday session. In the North American session, spot gold is trading at $1243.89 per ounce, down 0.31% on the day. On the release front, US Final GDP for the first quarter was stronger than expected, with a gain of 1.4%. This was above the forecast of 1.2%. As well, unemployment claims rose slightly to 244 thousand, higher than the estimate of 241 thousand. Friday is busy, so traders should be prepared for movement in gold prices. The key release of the day is UoM Consumer Sentiment, with the markets braced for a reading of 94.5 points in May, compared to the previous reading of 97.1 points. As well, we’ll get a look at Chicago PMI and Personal Spending.
The US economy did indeed slow down in the first quarter, but there was some good news on Thursday, as the revised GDP reading was raised to 1.4%, better than the initial estimate of 1.2% in May. The improvement was attributed to stronger consumer spending and an increase in exports. Earlier in the year, the markets were braced for a very poor quarter, with the first estimate in April projecting a gain of only 0.7%. Will we see better numbers in the second quarter? That may be a tall order, as consumer spending and manufacturing numbers in Q2 have missed expectations. Housing numbers have been mixed, and inflation remains below the Fed’s target of 2 percent. At the same time, the US labor markets remains very tight, with the unemployment rate at a 16-year low of 4.3%. Stronger global economic conditions have increased the demand for US products, boosting the export sector.
Aside from lukewarm economic data in 2017, investor confidence has been dampened by a Trump administration which has been plagued by scandals and crises. The administration continues to spend much of its time and energy on damage control, rather than focusing on its agenda of tax reform and increased fiscal spending. Will political paralysis in Washington affect interest rate policy? The Federal Reserve has all but promised one more rate hike in 2017, but the markets aren’t so sure, with the odds of a December rate hike at 57%, according to the CME Group. Gold prices are inversely linked to interest rate hikes, so if the odds of a rate hike decrease, gold could respond with gains.
GBP/JPY Returns To Daily Resistance
Do you remember the last time we featured THE BEAST on the blog? GBP/JPY was showing bearish price action, capped by daily resistance and then stepping down between short term levels beautifully.
A great opportunity to trade in the direction that the market wanted to move.
Well after 800 or so pips of this clean, step taking price action, GBP/JPY has quickly erased those steps and come straight back up to where we last posted:
GBP/JPY Daily:
Volatility Whip
A round of risk aversion gave the yen a reprieve in New York trading on Thursday but how it unfolded speaks to changes in the market in a low-volatility environment. The pound was the top performer on the day while the kiwi lagged. There are 8 Premium trades in progress, including 2 equity indices.
A whip laying on the ground is a good metaphor to understand how markets are behaving this year. Most of the time, it's limp. Different part might be nudged in different directions while the rest remains stationary. Periodically, however, something in the global economy shakes it more aggressively. When that happens, the handle is jarred and a wave of energy moves through the entire whip.
That wave is like how energy is moving through cross-assets in 2017. Sometimes what happens in a faraway place isn't enough to create a jolt but when it does – like with comment from Draghi that set off a round of European bond selling – the wave quickly moves from one asset to the next as it circles the globe and the crack of the whip awakens sleepy investors to the risks.
Mechanically, this is taking place because there are so many bets on low volatility. As volatility creeps up, it raises alarms in funds or algos that are monitoring cross assets, so they pare back risk and it sets off the chain reaction.
Going forward, the takeaway is that intermarket analysis is more important than ever. Tremors anywhere are capable of rattling the whip and when any market makes a big move – like Eurozone bonds – it's only a matter of time until the wave of volatility hits something distantly related like tech stocks. Afterwards, the energy is released, the whip goes limp again and risk assets slowly recover.
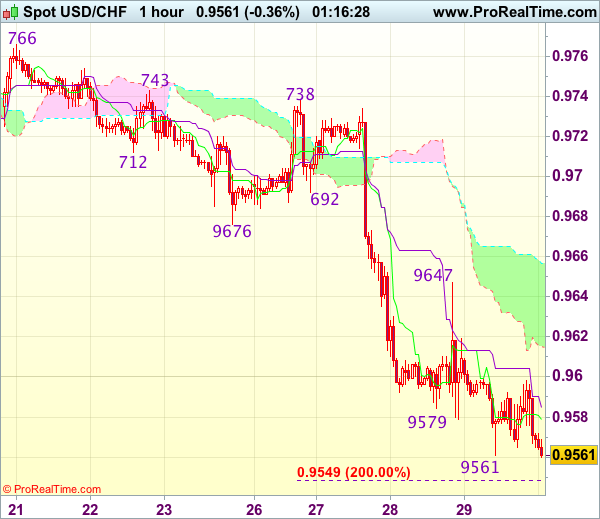
Trade Idea Wrap-up: USD/CHF – Sell at 0.9645
USD/CHF - 0.9575
Most recent candlesticks pattern : N/A
Trend : Near term down
Tenkan-Sen level : 0.9577
Kijun-Sen level : 0.9583
Ichimoku cloud top : 0.9657
Ichimoku cloud bottom : 0.9615
Original strategy :
Sell at 0.9645, Target: 0.9545, Stop: 0.9680
Position : -
Target : -
Stop : -
New strategy :
Sell at 0.9645, Target: 0.9545, Stop: 0.9680
Position : -
Target : -
Stop : -
As the greenback has remained under pressure after recent selloff, suggesting the decline from 0.9771 top is still in progress, hence bearishness remains further weakness to 0.9545-50 (2 times extension of 0.9771-0.9676 measuring from 0.9738) but reckon downside would be limited to 0.9525-30 (50% projection of 1.10100-0.9613 measuring from 0.9771) and 0.9500 should hold, price should stay above 0.9470 (61.8% projection), bring rebound later.
In view of this, would not chase this fall here and we are looking to sell dollar on recovery as resistance at 0.9647 should limit upside. Only above previous support at 0.9676 (now resistance) would defer and suggest a temporary low is formed, risk test of another previous support at 0.9692.
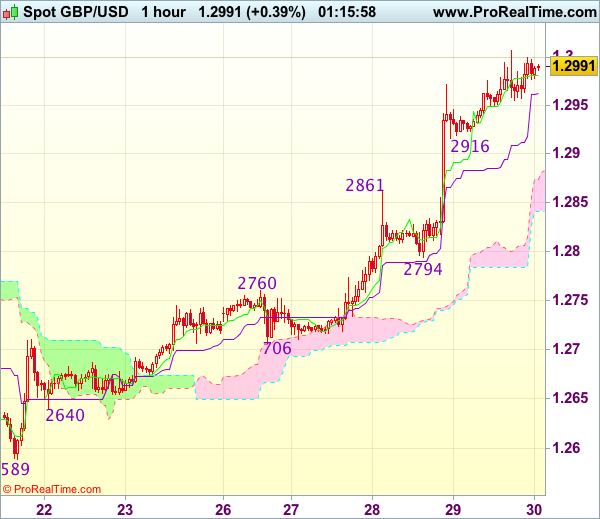
Trade Idea : GBP/USD – Buy at 1.2920
GBP/USD - 1.2991
Most recent candlesticks pattern : N/A
Trend : Near term up
Tenkan-Sen level : 1.2968
Kijun-Sen level : 1.2968
Ichimoku cloud top : 1.2874
Ichimoku cloud bottom : 1.2841
Original strategy :
Buy at 1.2895, Target: 1.2995, Stop: 1.2860
Position : -
Target : -
Stop : -
New strategy :
Buy at 1.2895, Target: 1.2995, Stop: 1.2860
Position : -
Target : -
Stop : -
As cable has risen again after brief pullback, suggesting recent upmove is still in progress and may extend further gain towards recent high 1.3048, however, loss of near term upward momentum should prevent sharp move beyond 1.3075-80 today and reckon 1.4100 would hold on first testing, risk from there has increased for a retreat to take place later.
In view of this, we are looking to buy cable again on pullback as 1.2895-00 should limit downside. Below previous resistance at 1.2861 would defer and suggest a temporary top is formed instead, risk weakness to 1.2830-35 but support at 1.2794 should remain intact.
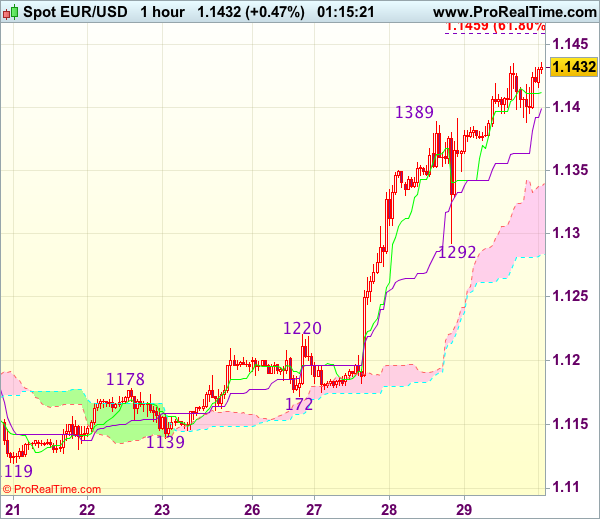
Trade Idea : EUR/USD – Buy at 1.1335
EUR/USD - 1.1437
Most recent candlesticks pattern : N/A
Trend : Near term up
Tenkan-Sen level : 1.1414
Kijun-Sen level : 1.1401
Ichimoku cloud top : 1.1337
Ichimoku cloud bottom : 1.1283
Original strategy :
Buy at 1.1320, Target: 1.1420, Stop: 1.1285
Position : -
Target : -
Stop : -
New strategy :
Buy at 1.1335, Target: 1.1435, Stop: 1.1300
Position : -
Target : -
Stop : -
As the single currency has risen again after finding renewed buying interest at 1.1292,, suggesting recent rise is still in progress and may extend further gain to 1.1455-60 (61.8% projection of 1.1119-1.1389 measuring from 1.1292), then 1.1480, however, overbought condition should prevent sharp move beyond 1.1500, risk from there has increased for a retreat later.
In view of this, would not chase this rise here and would be prudent to buy euro on pullback as the upper Kumo (now at 1.1336) should limit upside. Below 1.1300 would defer but only break of said support at 1.1292 would signal a temporary top is formed, bring correction to 1.1255-60 later.
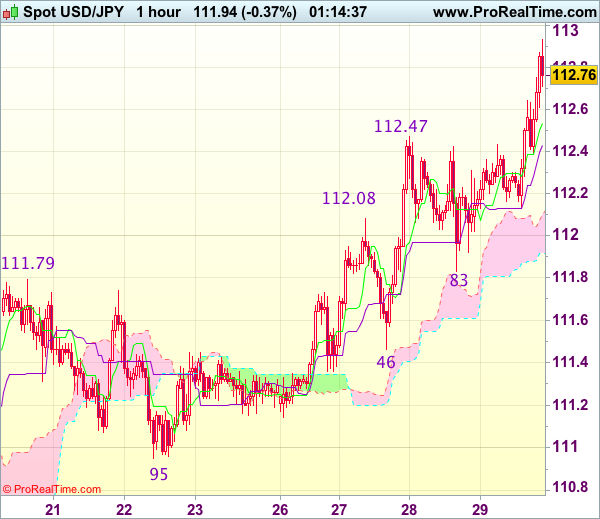
Trade Idea Wrap-up: USD/JPY – Stand aside
USD/JPY - 111.92
Most recent candlesticks pattern : N/A
Trend : Near term up
Tenkan-Sen level : 112.42
Kijun-Sen level : 112.42
Ichimoku cloud top : 112.14
Ichimoku cloud bottom : 111.92
Original strategy :
Bought at 112.40, stopped at 111.55
Position : - Long at 112.40
Target : -
Stop : - 112.05
New strategy :
Stand aside
Position : -
Target : -
Stop : -
As dollar’s retreat 112.93 turned out to be stronger than expected, suggesting consolidation below this level would be seen and downside risk remains for test of support at 111.83, however, break there is needed to signal top is formed there, bring retracement of recent upmove towards support at 111.46, however, downside should be limited and price should stay well above support at 110.95.
In view of this, we are standing aside in the meantime. Above 111.20 would bring recovery to 112.60, however, price should falter below resistance at 112.93 and bring another retreat later.
Yen Shrugs off Weak Japanese Retail Sales, Inflation Reports Ahead
USD/JPY gained ground briefly earlier in the Thursday session, but has since retracted. In the North American session, the pair is trading at 112.40. On the release front, Japanese Retail Sales rose 2.0%, well short of the estimate of 2.6%. Later in the day, Japan releases Household Spending and Tokyo Core CPI. On Friday, the US releases UoM Consumer Sentiment.
Japanese retail sales slowed to just 2.0% in May, compared to 3.2% a month earlier. The weak figure points to a Japanese consumer who is hesitant to open the purse strings. Wages have been stagnant, which has hampered consume spending, a key driver of economic growth. Inflation is stuck below 1 percent, well below the BoJ's target of 2 percent. Japan will release key consumer data later on Thursday, but the markets are not holding their breath for positive readings. Household Spending is expected to decline 0.7%, while Tokyo Core CPI, the primary gauge of consumer spending, is forecast to post a weak gain of 0.2%. At the same time, Japanese policymakers can point to five straight quarters of expansion, as the stronger global demand has boosted Japan's manufacturing and export sectors.
If recent communications from the BoJ are any indication, the bank isn't likely to tighten monetary policy anytime soon. The bank has been very consistent in its message that the ultra-loose accommodative policy will stay in place until inflation levels rise closer to the BoJ's target of 2.0%. Despite years of stimulus from the BoJ, the inflation target remains elusive. However, rather than lower the target, the rigid bank has insisted that it's only a matter of time before the improved Japanese economy triggers higher inflation. At the same time, the bank is mindful that there is growing speculation that better economic conditions could translate into the bank winding up its stimulus package. In the bank's Summary of Opinion, released earlier this week, board members acknowledged that it was important for the BoJ to clearly communicate to the markets that the bank has no plans withdraw monetary stimulus anytime soon. There may be some tweaks and nuances along the way, but that will likely be the extent of any moves from the BoJ, barring unexpected changes in inflation levels.