Sample Category Title
Trade Idea: GBP/JPY – Buy at 144.30
GBP/JPY - 145.30
Recent wave: Medium term low formed at 120.50 and (A)-(B)-(C) major correction has commenced with (A) leg ended at 148.45, hence wave (B) is unfolding for retreat to 131.00-10.
Trend: Near term down
Original strategy:
Buy at 144.30, Target: 146.30, Stop: 143.70e
Position: -
Target: -
Stop: -
New strategy :
Buy at 144.30, Target: 146.30, Stop: 143.70
Position: -
Target: -
Stop:-
Sterling’s retreat after rising to 146.50 yesterday has retained our view that minor consolidation below this level would be seen and pullback to 145.00 is likely, however, reckon previous resistance at 144.20 would turn into support and limit downside, bring another rise later, above said resistance at 146.50 would extend the erratic rise from 138.70 low to 147.10 (previous resistance) but price should falter below recent high at 148.10.
In view of this, would not chase this rise here and we are looking to buy sterling on subsequent pullback as previous resistance at 144.20 should limit downside and bring another rise. Below 143.90-00 would defer but only break of support at 143.30 would signal top is formed instead, bring correction to 142.90-00.
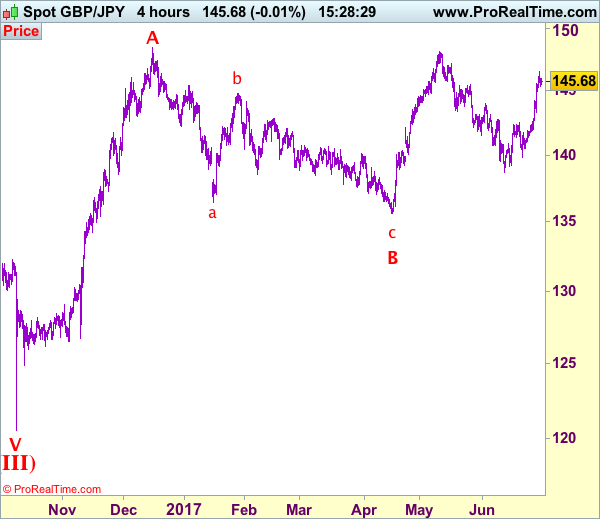
Our preferred count is that larger degree wave V with circle is unfolding from 251.12 with wave (I) 219.34, (II): 241.38 and wave (III) is subdivided into 1: 192.60, 2: 215.89 (23 Jul 2008) and wave 3 ended at 118.87 earlier in 2009. The correction from there to 162.60 is wave 4 which itself is a double three and is labeled as first a-b-c ended at 151.53, followed by wave x at 139.03, 2nd a ended at 162.60, 2nd b at 146.75 and 2nd c leg of wave 4 ended at 163.00. Therefore, the decline from 163.00 to 116.85 is now treated as wave 5 which also marked the end of larger degree wave (III), hence wave (IV) major correction has commenced for retracement of the wave (III) from 241.38 and upside target at 183.95-00 (50% Fibonacci retracement of the wave (II) from 241.38) had been met, a drop below 160.00 would suggest wave (IV) has ended at 195.85, bring decline in wave (V) for initial weakness to 130 (already met) and 120.
GBP/JPY Daily Outlook
Daily Pivots: (S1) 145.12; (P) 145.82; (R1) 146.56; More....
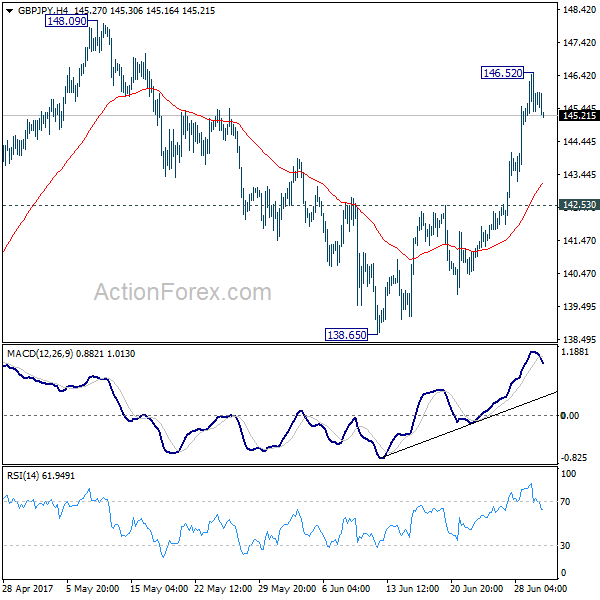
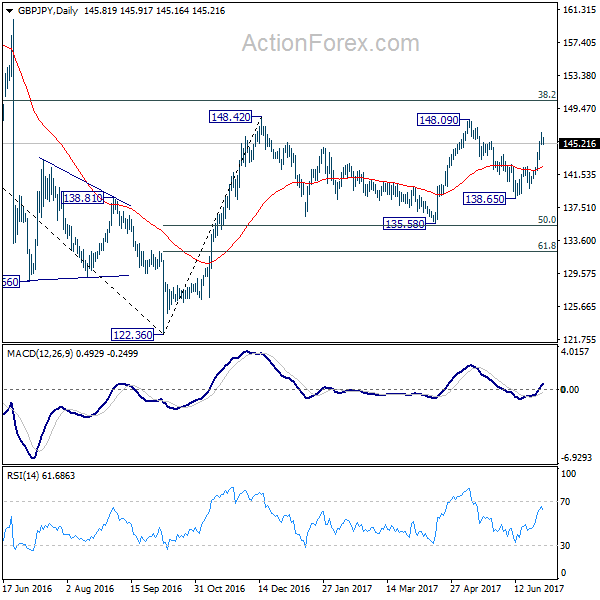
A temporary top is in place at 146.52 in GBP/JPY and intraday bias is turned neutral for consolidations. But downside should be contained above 142.53 resistance turned support to bring another rise. Above 146.52 will extend the rally from 138.65 and target 148.09/42 resistance zone. Decisive break there will resume whole rebound from 122.36 for key fibonacci level at 150.43.
In the bigger picture, price actions from 148.42 are viewed as a consolidative pattern. And medium term rally from 122.36 is expected to resume later. Decisive break of 38.2% retracement of 196.85 to 122.36 at 150.43 will carry long term bullish implications and pave the way to 61.8% retracement at 167.78. In case of another fall, we'd bee looking for strong support from 135.58 and 50% retracement of 122.36 to 148.42 at 135.39 to contain downside.
EUR/JPY Daily Outlook
Daily Pivots: (S1) 127.73; (P) 128.27; (R1) 128.85; More...
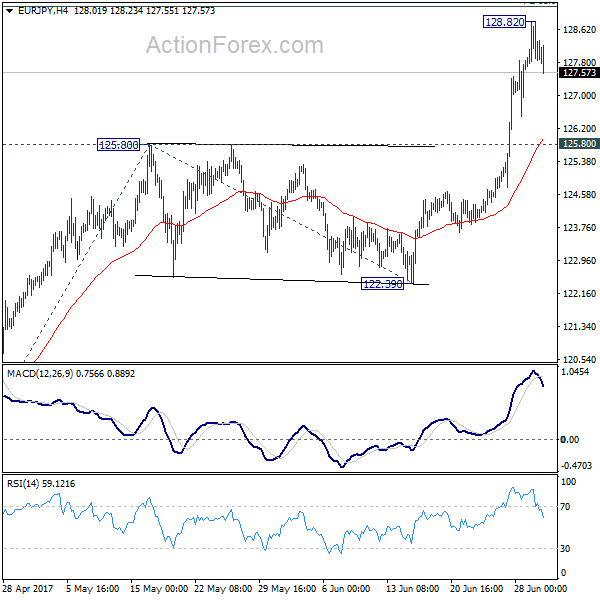
A temporary top is in place at 128.82 in EUR/JPY and intraday bias is turned neutral for consolidation. Downside of retreat should be contained by 125.80 resistance turned support to bring another rally. Above 128.82 will target 61.8% projection of 114.84 to 125.80 from 122.39 at 129.16 first next. That's also close to medium term projection level at 129.89.
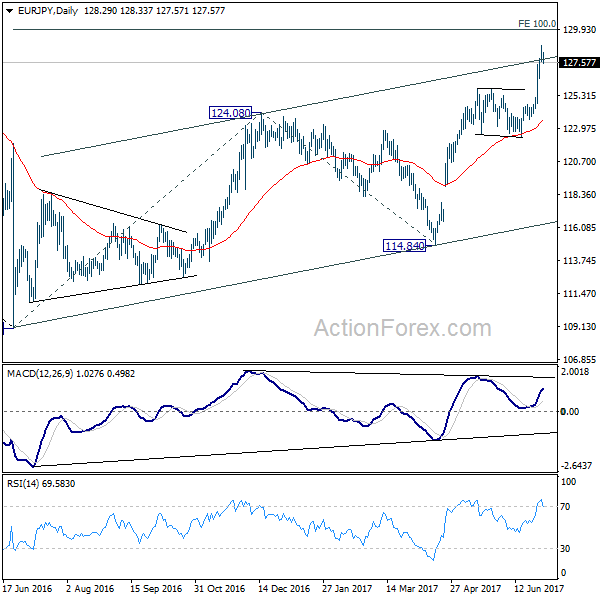
In the bigger picture, the break of 126.09 support turned resistance should have confirmed completion of down trend form 149.76 (2014 high), at 109.03 (2016 low). Current rise from 109.03 should target 100% projection of 109.03 to 124.08 from 114.84 at 129.89 first. Break there will pave the way to 61.8% retracement of 149.76 to 109.03 at 134.20 and above. Medium term outlook will now remain bullish as long as 122.39 support holds.
EUR/AUD Daily Outlook
Daily Pivots: (S1) 1.4853; (P) 1.4890; (R1) 1.4925; More...
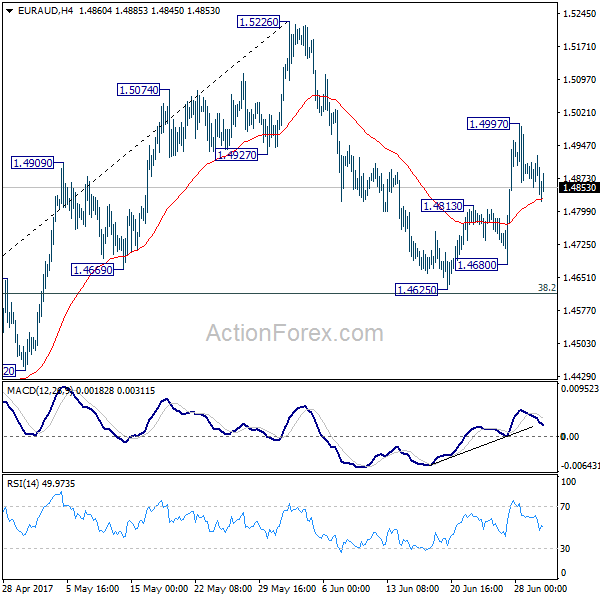
A temporary top is in place at 1.4997 and intraday bias is turned neutral. Break of 1.4813 will argue that rebound from 1.4625 has completed and will turn bias back to the downside for this support. On the upside, above 1.4997 will target a test on 1.5226 high next.
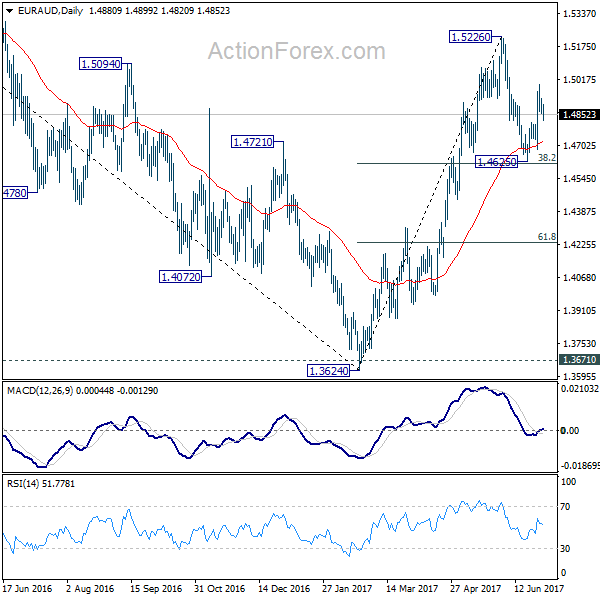
In the bigger picture, price actions from 1.6587 medium term top are viewed as a corrective pattern. Such correction should be completed at 1.3624 after defending 1.3671 key support. Rise from 1.3642 would extend to 61.8% retracement of 1.6587 to 1.3624 at 1.5455. Sustained break there will pave the way to retest 1.6587. However, sustained break of 1.4669 support will dampen this bullish view. We'll assess the outlook later after looking at the structure and depth of the pull back.
EUR/GBP Daily Outlook
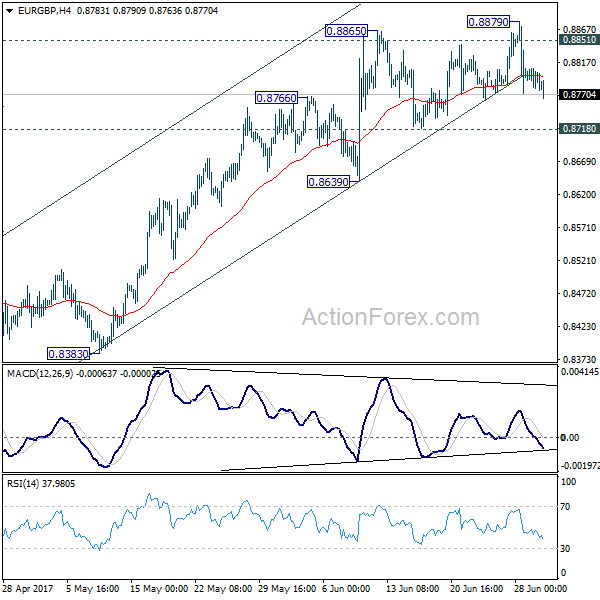
Daily Pivots: (S1) 0.8781; (P) 0.8794; (R1) 0.8810; More...
Intraday bias in EUR/GBP remains neutral for the moment. There is no confirmation of reversal yet and another rise is mildly in favor as long as 0.8718 support holds. On the upside, break of 0.8879 and sustained trading above 0.8851 will pave the way to retest 0.9304 high. However, break of 0.8718 support will now indicate near term reversal and turn bias back to the downside for 0.8639 support and below.
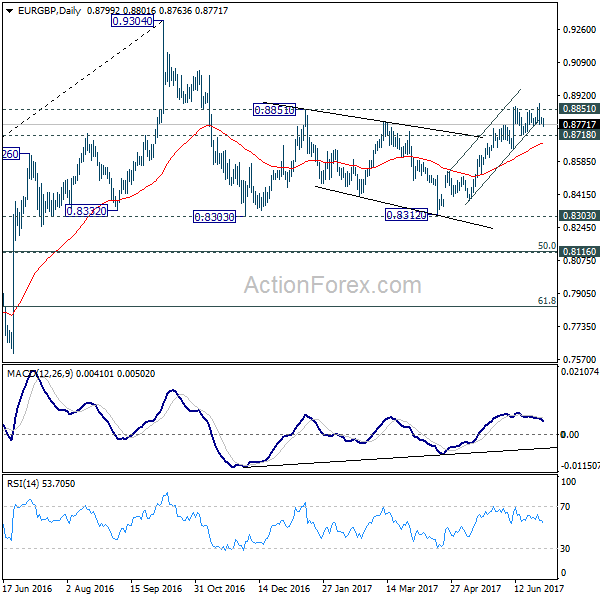
In the bigger picture, price actions from 0.9304 are viewed as a medium term corrective pattern. The leg from 0.9304 should have completed after testing 0.8332 structural support. But it's too early to say that larger rise from 0.6935 is resuming. Rejection from 0.9304 will extend the consolidation with another falling leg. Meanwhile, firm break of 0.9304 will target 0.9799 (2008 high). In case of another decline, we'd expect strong support from 0.8116 cluster support (50% retracement of 0.6935 to 0.9304 at 0.8120) to contain downside and bring rebound.
EUR/CHF Daily Outlook
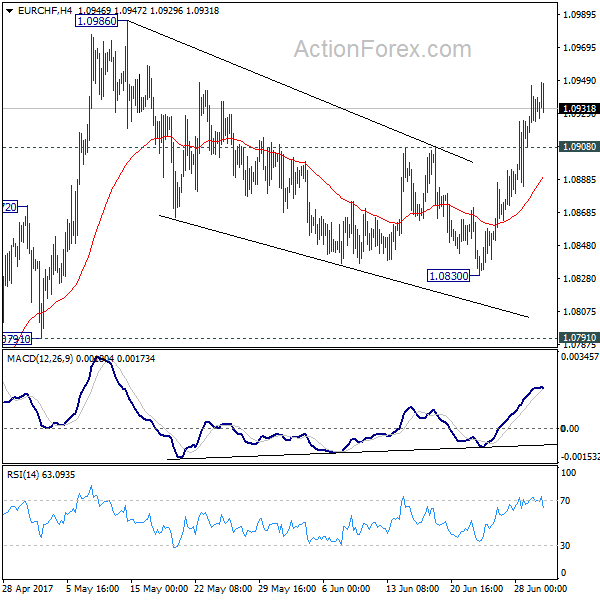
Daily Pivots: (S1) 1.0914; (P) 1.0931; (R1) 1.0951; More...
Intraday bias in EUR/CHF remain son the upside for 1.0986/0999 resistance zone first. Break there will extend the larger rise from 1.0629 and target next key resistance level at 1.1198 high. On the downside, below 1.0908 minor support will turn intraday bias neutral an bring retreat. As noted before, corrective pull back from 1.0986 should be completed at 1.0830. Downside of retreat should be contained well above 1.0830 and bring another rally.
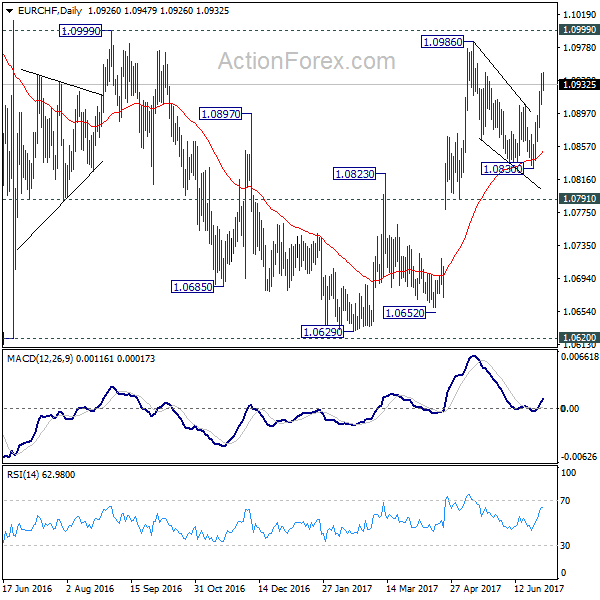
In the bigger picture, the price actions from 1.1198 are seen as a corrective move. Such correction could have completed after defending 38.2% retracement of 0.9771 to 1.1198 at 1.0653. Decisive break of 1.0999 resistance will target a test on 1.1198 high. For now, this will be the preferred case as long as 1.0791 support holds.
XAU/USD Analysis: Breaks Out Of Triangle
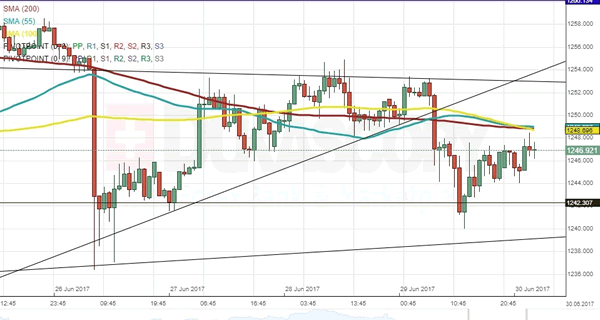
Although it was possible that the metal's price will break out of the ascending triangle pattern to the upside, as it should have been in accordance with this pattern's theoretical framework that did not occur. Instead the bullion sharply dropped and reached the 1,240 mark, which acted as a support. Most likely the 1,240 level was set as a stop loss by short sellers, as the metal managed to quickly reach above the 1,245 mark in the next few hours. In regards to the future outlook of the commodity price, it has to be noted that the metal faces the resistance of all of the simple moving averages, which are used by Dukascopy, at the 1,249 mark. Most likely the combined resistance will force gold into a retreat.
EUR/USD Analysis: Reveals Short Term Pattern
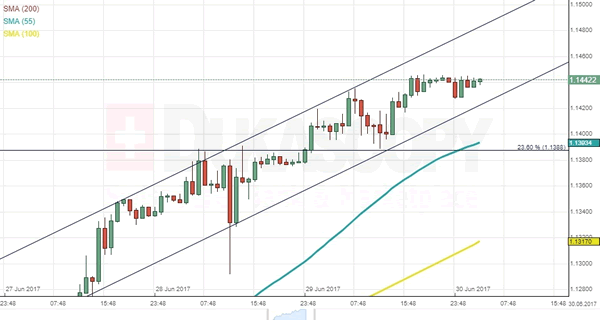
Due to the fact that the EUR/USD pair was not jumping in the free range up to the combined resistance of the monthly R2 at 1.1546 and the upper trend line of the massive scale descending channel pattern at 1.1550, a review of the short term situation was done. As a result of the review a rather weak short term ascending channel was discovered. In accordance with the pattern it is likely that that the 1.15 mark will be reached by the end of the day's trading session. In addition, the rate could be at the 1.1550 mark during the first half of next week. However, it could be observed during the late hours of Thursday's trading and early hours of Friday that the 1.1450 level was providing resistance in itself.
USD/JPY Analysis: Enters Consolidation
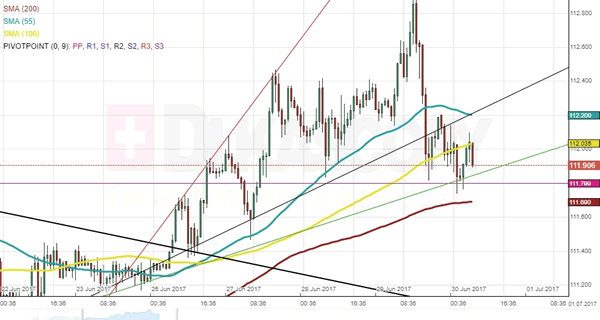
Following the massive plunge mid-Thursday, USD/JPY entered in a minor consolidation phase, thus being stranded between the 55– and 200-hour SMAs at 111.69 and 112.21, respectively. The pair found support at the monthly PP at 111.80 prior to moving north. An immediate resistance is provided by the aforementioned 55-hour SMA, while the next resistance located at the 113.36 mark is a distant target. Technical indicators demonstrate mixed results; thus the possible direction of the US Dollar is unclear. In case bullish sentiment prevails in this session, the rate may approach the 55-hour SMA and may even breach it. Nevertheless, the base scenario favours the rate continuing to move sideways, remaining in the 111.70/112.20 territory.
GBP/USD Analysis: Decrease In Sight
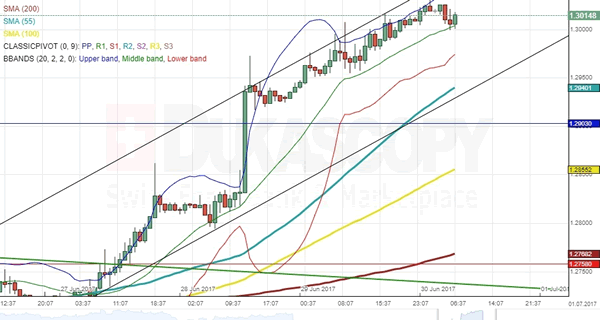
Thursday's trading session was characterized by strong upside momentum that was stopped by the monthly R1 near the 1.3036 mark. The given direction reveals the formation of a minor ascending channel that would suggest a fall down to the 55- hour SMA or the monthly PP at 1.2938 and 1.2903, accordingly. Even though technical indicators remain bullish, trend indicators demonstrate that the given uptrend is decreasing in strength, thus confirming a possible move south in this session. On Monday morning, however, the rate may return near the 1.3000 if the channel-up boundaries are respected. By and large, the rate is expected to trade in the 1.3036/1.2903 area. Being so close to the upper channel boundary means that positive UK Current Account data may breach the upper limit for a while.