Sample Category Title
Technical Outlook: GBPUSD – Bulls Approach Key Barrier At 1.3047, Overbought Daily Studies Warn Of Correction
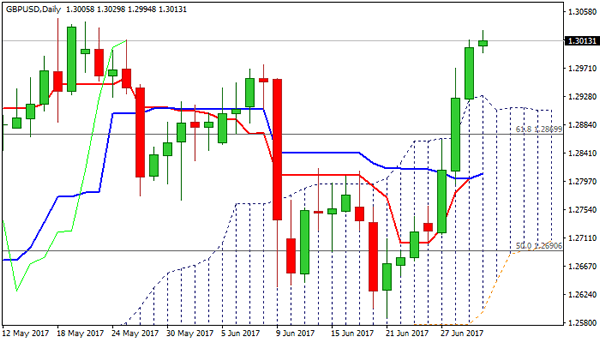
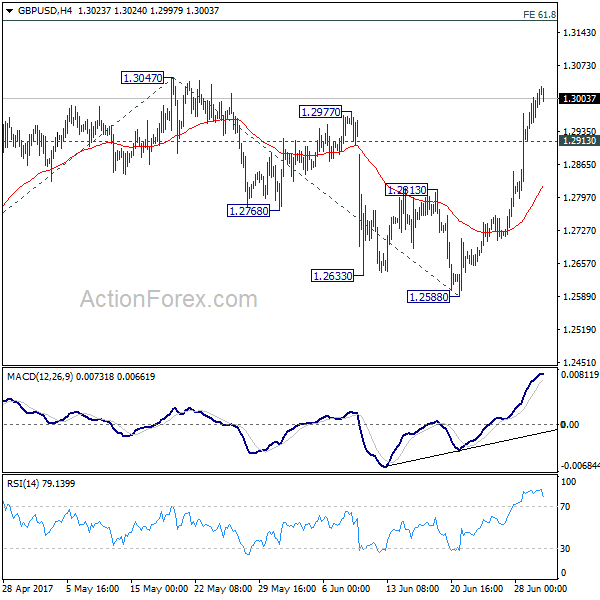
Cable eases from new six-week high at 1.3030 but holding around 1.3000 for now. Yesterday’s close above psychological 1.3000 barrier was another strong bullish signal. Bulls are looking for final push towards 1.3047 (14 May high) to fully retrace 1.3047/1.1930 descend and signal extension of recovery phase from 1.2000 zone.
Near-term action may show further hesitation ahead of key 1.3047 barrier as daily studies are overbought and suggest corrective action ahead.
Hourly Kijun-sen offers immediate support at 1.2990, along with former top at 1.2977, with daily cloud top (currently at 1.2910) expected to contain dips.
Res: 1.3030, 1.3047, 1.3081, 1.3120
Sup: 1.2990, 1.2977, 1.2943, 1.2910
Yen, Kiwi Up, Euro Volatile Ahead Of Inflation, Eyes Key Data Releases
During today's Asian trading session, news and data flow was mostly focused on Japan and China. The yen is up for the third consecutive day relative to the dollar. The euro, sterling and the aussie retraced some of the early gains against the dollar as the Asian session was closing.
The upbeat in China's manufacturing PMI pushed up the aussie against the dollar (as China and Australia are major trading partners) to reach an intra-day level of $0.7712, a more than three-month high. At 51.7, China's manufacturing PMI in June was above the expected level of 51.0 and above May's 51.2. However, the aussie has been under pressure against the dollar, retracing earlier gains as the Asian session was coming to a close.
The New Zealand dollar also rose higher against the greenback, last trading at $0.7321. The kiwi is set for a seventh consecutive week of gains against the dollar.
Economic data releases out of Japan were mostly on the positive side. Japan household spending rose 0.7% month-on-month in May, above the forecasted 0.2% and the prior month's 0.5%. At 0.4% as expected, the inflation for May was above April's 0.3%. The unemployment rate increased to 3.1%, up from 2.8% in April.
Dollar/yen was trading below the 112 handle for most of the Asian session, continuing to slide for the third consecutive day. The Dollar Spot Index broadly held steady, down 0.01% at the end of Asian session and heading for a 5% quarterly loss.
The euro was steady against the dollar for most of the Asian session, with some pressure being recorded as the European markets were starting the day. Euro/dollar was last trading at 1.1414.
Sterling held above the $1.30 handle during most of the Asian session. Pound/dollar was last trading at 1.3004.
Gold prices were rising for most of the Asian session on the back of the dollar backtracking, though the precious metal retraced all the gains later in the session and fell further down from yesterday's close. The commodity was last trading at $1,242.96 an ounce.
Oil continued its uptrend on the back of signs US production is falling. WTI rose for the seventh consecutive day and it was last trading at $45.17 a barrel.
The rest of the day will have a heavy data flow that could cause significant volatility among major forex pairs. Just some of the key data points to highlight are June flash inflation out of the eurozone, the UK first quarter GDP and the US core PCE for May.
EUR/USD Daily Outlook
Daily Pivots: (S1) 1.1394; (P) 1.1419 (R1) 1.1465; More.....
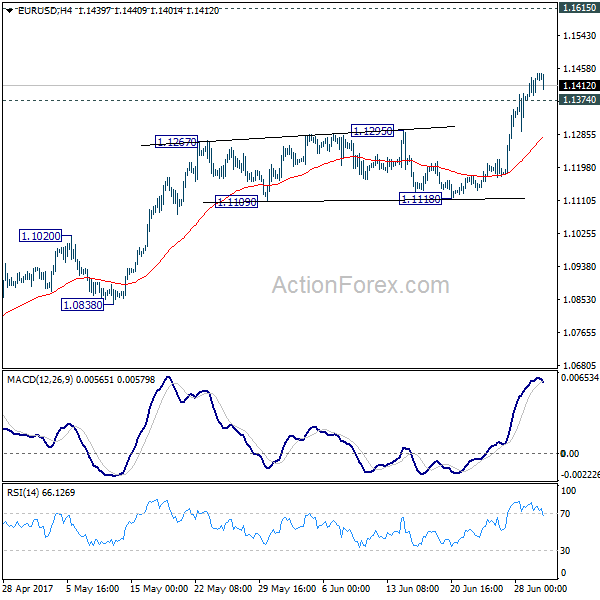
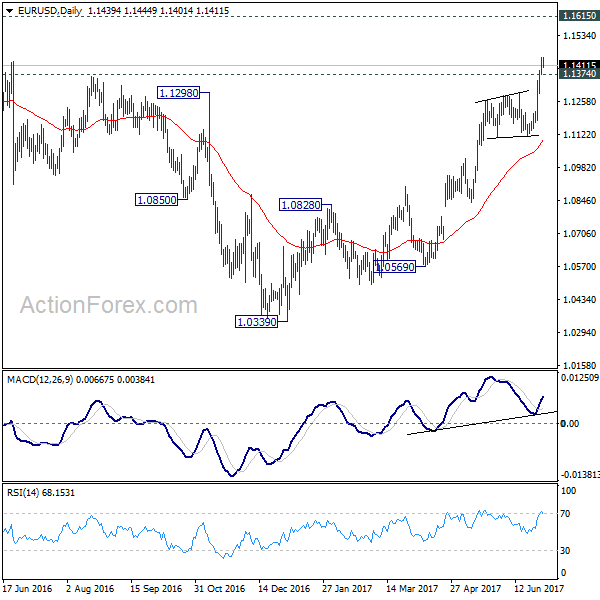
Intraday bias in EUR/USD remains on the upside for the moment. Current rally from 1.0339 should target 1.1615 medium term resistance next. On the downside, below 1.1374 minor support will turn intraday bias neutral and bring retreat. But downside should be contained above 1.1118 support and bring rise resumption.
In the bigger picture, the break of 1.1298 resistance further affirm medium term reversal. That is an important bottom was formed at 1.0339 on bullish convergence condition is seen in weekly MACD. Further rise would be seen to 55 month EMA (now at 1.1776). Sustained break there will pave the way to 38.2% retracement of 1.6039 (2008 high) to 1.0339 (2017 low) at 1.2516 next. This will now remain the favored case as long as 1.1118 support holds.
US Economy Grows At Stronger-Than-Expected Pace In Q1, Initial Jobless Claims Rise To 244K Last Week
'The US economy looks pretty healthy right now when you think in terms of sectors that could blow up.' - Stephen Stanley, Amherst Pierpont Securities LLC
The US economy expanded at a stronger-than-initially-expected pace in the March quarter amid higher consumer spending. The Commerce Department reported on Thursday that the domestic economy grew at an annualised pace of 1.4% in the Q1 of 2017, following the preceding quarter's expansion of 2.1% and surpassing the prior estimate of 1.2% growth. Thursday's data showed that the Q1 growth figure's revision was driven by stronger consumer spending, which climbed 1.1% during the reported period, compared to the preliminary reading of a 0.6% increase. However, that was the weakest reading since the Q2 of 2013. Despite the GDP upward revision, the Trump administration's plan to lift annual US economic growth to 3% remained challenging. As to the June quarter, weak retail sales figures, sluggish manufacturing production growth and low inflation suggested that the economy failed to regain positive momentum in the Q2. Other data released on Thursday showed that the number of Americans filing for jobless aid rose 2K to 244K in the week ended June 23, whereas analysts anticipated a fall to 241K.
GBP/USD Daily Outlook
Daily Pivots: (S1) 1.2947; (P) 1.2978; (R1) 1.3036; More...
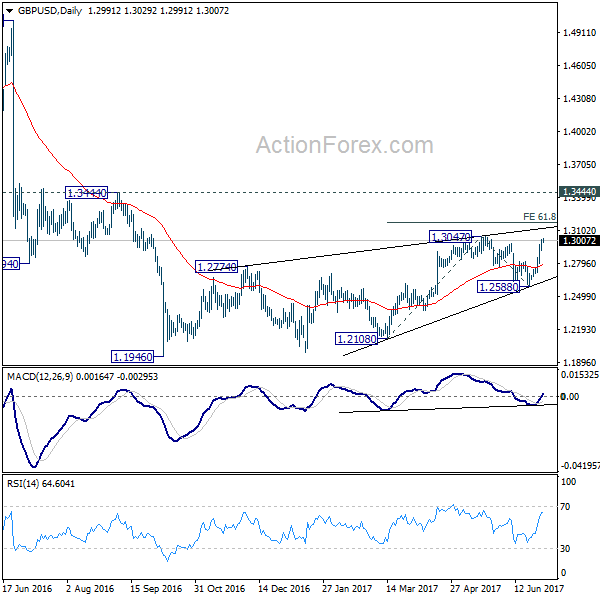
Intraday bias in GBP/USD remains on the upside for 1.3047 as rise from 1.2588 continues. Break of 1.3047 will target 61.8% projection of 1.2108 to 1.3047 from 1.2588 at 1.3168. On the downside, below 1.2913 minor support will turn bias neutral and bring retreat, before staging rally resumption.
In the bigger picture, overall, price actions from 1.1946 medium term low are seen as a corrective pattern. Pull back from 1.3047 has completed after failing to sustain below 1.2614 resistance turned support. It argues that the corrective pattern from 1.1946 is still in progress for another high above 1.3047. But still, outlook remains bearish as long as 1.3444 key resistance holds. Larger down trend from 1.7190 is expected to resume later after the correction completes.
USD/CHF Daily Outlook
Daily Pivots: (S1) 0.9542; (P) 0.9571; (R1) 0.9586; More.....
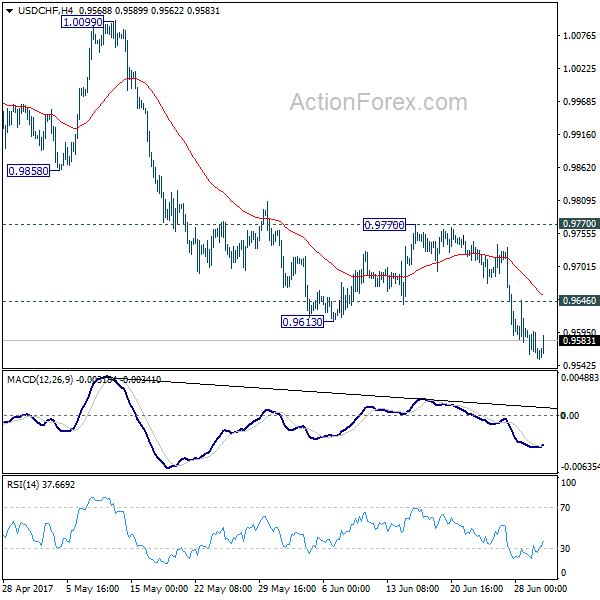
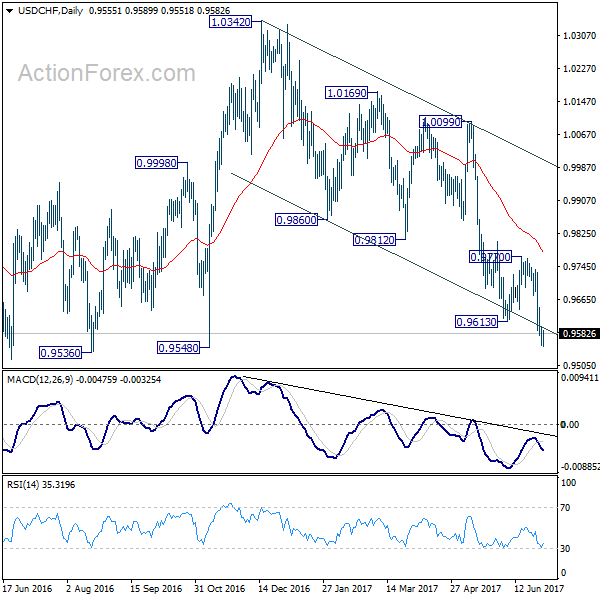
At this point, intraday bias in USD/CHF remains on the downside. Current decline should target 0.9548 support and below. We'd start to look for bottoming signal again as it approaches 0.9443 key support level. On the upside, above 0.9646 minor resistance will turn bias neutral and bring recovery. But still, break of 0.9770 resistance is ended to indicate short term bottoming. Otherwise, outlook will remain bearish.
In the bigger picture, USD/CHF is still bounded in medium term range of 0.9443/1.0342 for the moment. Consolidative trading would likely continue and medium term outlook remains neutral. Break of 1.0342 key resistance is needed to confirm underlying bullish momentum in the pair. Meanwhile, downside attempts should be contained by 0.9443 key support level. However, sustained break of 0.9443 will carry larger bearish implication and target 0.9 handle.
Technical Outlook: EURUSD – Correction Is Likely To Precede Fresh Rally
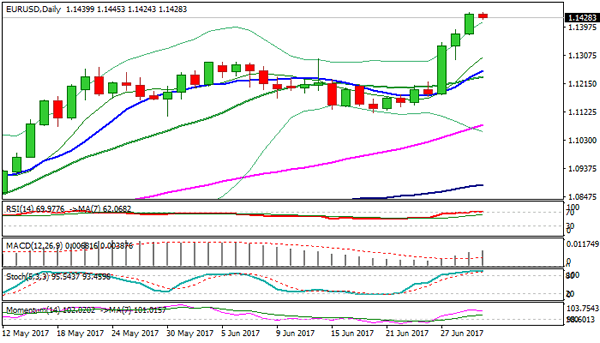
The Euro is consolidating within narrow range, after hitting fresh over one-year high at 1.1445 in early Friday, just ahead of target at 1.1455 (50% retracement of 1.2567/1.0340 descend).
The pair is looking for round-figure barrier at 1.1500 and may extend higher to fully retrace 1.1614/1.0340 (05 May 2016 / 03 Jan 2017 bear-leg), as firmly bullish technicals and sentiment are supportive.
Meanwhile, corrective action may precede fresh upside as daily studies are strongly overbought, but so far did not generate firmer bearish signal.
Also, profit-taking on strong three-day rally may add pressure on pair’s near-term action.
Corrective dips will face initial supports at 1.1424/00, followed by thick hourly cloud (spanned between 1.1383/08) and former strong barriers at 1.1290 zone, reinforced by converged daily Tenkan-sen/Kijun-sen, where deeper corrective action should find strong support.
Res: 1.1455, 1.1500, 1.1511, 1.1550
Sup: 1.1424, 1.1400, 1.1383, 1.1320
USD/JPY Daily Outlook
Daily Pivots: (S1) 111.67; (P) 112.29; (R1) 112.79; More...
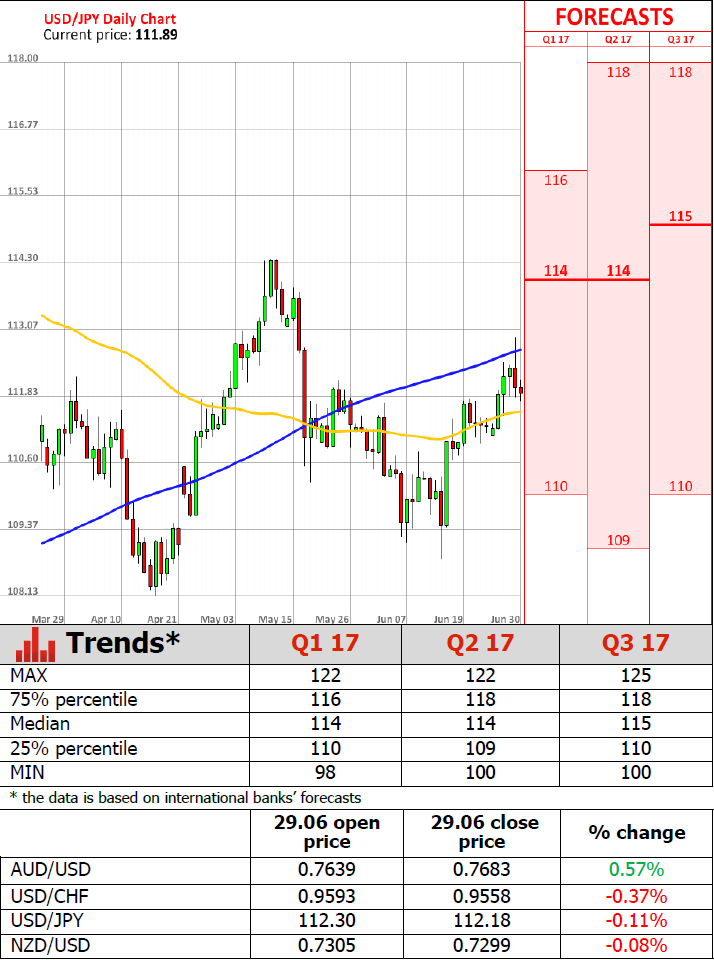
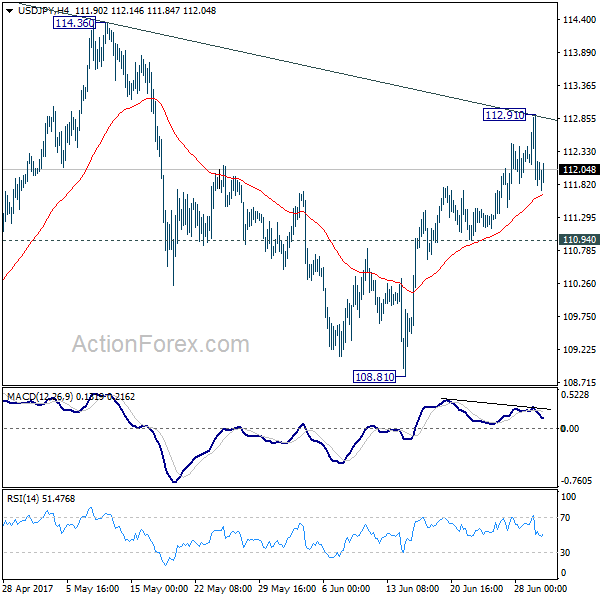
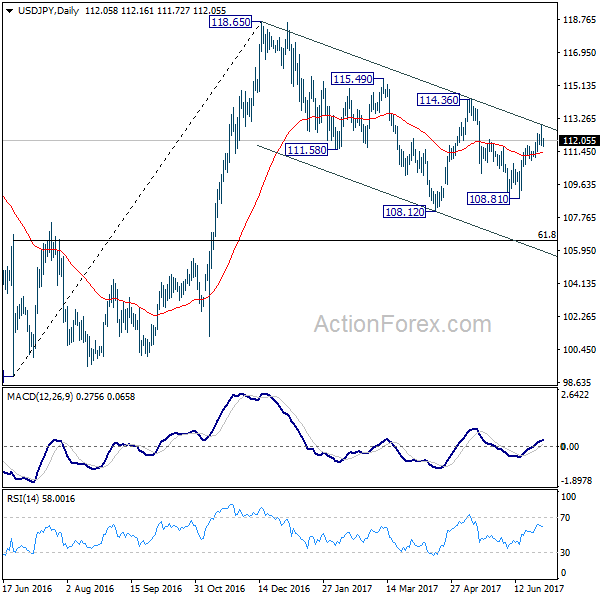
USDJPY jumped to 112.91 but failed to break through near term channel resistance and retreated. A temporary top is formed and intraday bias is turned neutral first. Near term outlook stays cautiously bullish as long as 110.94 support holds. Sustained break of the channel resistance argue that whole pull back from 118.65 has completed at 108.12 already. In such case, further rise should be seen to 114.36 resistance for confirmation. However, break of 110.94 will argue that rebound from 108.81 has completed and will turn bias back to the downside for this support instead.
In the bigger picture, price actions from 125.85 high are seen as a corrective pattern. It's uncertain whether it's completed yet. But in case of another fall, downside should be contained by 61.8% retracement of 75.56 to 125.85 at 94.77 to bring rebound. Overall, rise from 75.56 is still expected to resume later after the correction from 125.85 completes.
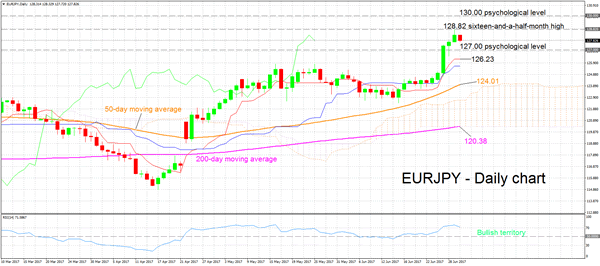
EURJPY Close To 16½-Month High, Remains Above 50-And 200-Day MAs
EURJPY edged higher in the previous five trading days, while it yesterday recorded a sixteen-and-a-half-month high of 128.82. The price has been consistently above the 50- and 200-day moving averages (MAs) since late April.
The positive alignment when the Tenkan-sen line (red) crossed above the Kijun-sen (blue) earlier this week is hinting to a positive near-term bias. However, it should be noted that the Kijun-sen is flat at the moment, perhaps suggesting that the bullish momentum has lost its steam. The RSI indicator is projecting a similar picture, as it is on the one hand well into bullish territory at 72, but on the other hand it is currently trending downwards from overbought levels.
Yesterday's high of 128.82, combined with the 129.00 handle, are likely to form a resistance area on the upside. A successful break above this area, would divert attention to the 130.00 level, a psychological level that could potentially act as a barrier to further up movements. A more sustained rally is likely to follow should the price climb above 130.00.
On the downside, another potential psychological level, namely the 127.00 mark, might act as support. Further down, additional support could come from the Tenkan-sen, currently at 126.23.
Looking at the medium-term outlook, it looks bullish at the moment with the price comfortably above the 50- and 200-day MAs. Moreover, both MAs are currently upward sloping, albeit the 200-day is only moderately positively sloped. Also, the considerable divergence between the price and the 200-day MA could be a sign of an overextended rally
AUD/USD Daily Outlook
Daily Pivots: (S1) 0.7594; (P) 0.7619; (R1) 0.7662; More...
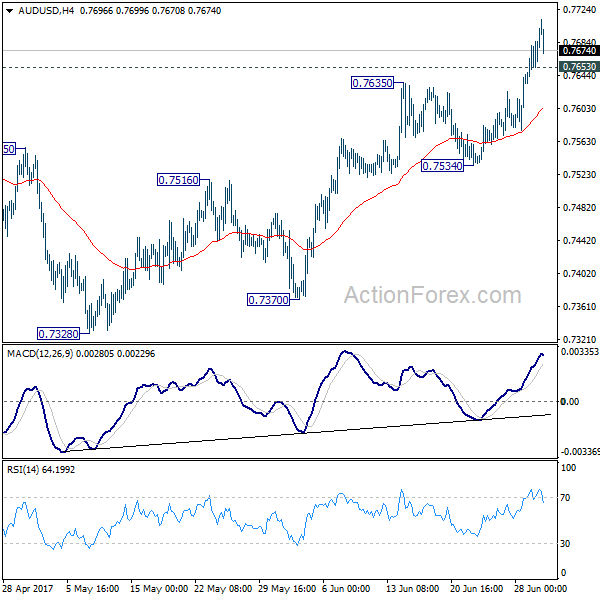
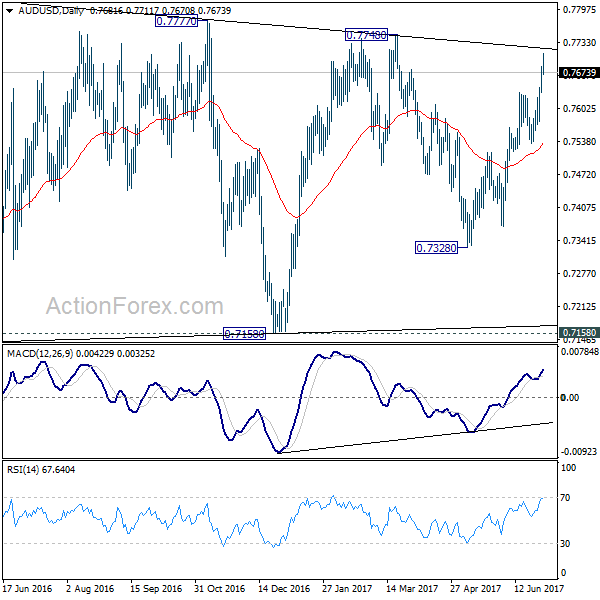
AUD/USD retreats after hitting as high as 0.7711. Intraday bias remains on the upside for 0.7748 resistance and above. At this point, there is no clear sign of medium term range breakout yet. Hence, we'd be cautious on topping again as it approaches medium term fibonacci level at 0.7849. On the downside, below 0.7653 minor support will turn bias neutral and bring consolidations first. But near term outlook will remain bullish as long as 0.7534 support holds.
In the bigger picture, we're still treating price actions from 0.6826 low as a corrective pattern. And, as long as 38.2% retracement of 0.9504 to 0.6826 at 0.7849 holds, long term down trend from 1.1079 is expected to resume sooner or later. Break of 0.6826 low will target 0.6008 key support level. However, firm break of 0.7849 will indicate that rise from 0.6826 is developing into a medium term rebound, rather than a sideway pattern. In such case, stronger rise should be seen to 55 month EMA (now at 0.8116) and above.