
Sample Category Title
USD/CHF Daily Outlook
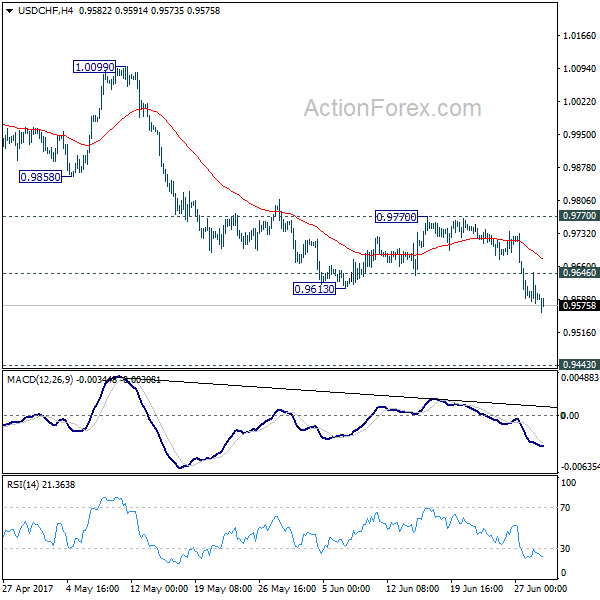
Daily Pivots: (S1) 0.9568; (P) 0.9607; (R1) 0.9637; More.....
USD/CHF's decline continues today and reaches as low as 0.9560 so far. Intraday bias stays on the downside and fall from 1.0342 would target 0.9548 support and below. We'd start to look for bottoming signal again as it approaches 0.9443 key support level. On the upside, above 0.9646 minor resistance will turn bias neutral and bring recovery. But still, break of 0.9770 resistance is ended to indicate short term bottoming. Otherwise, outlook will remain bearish.
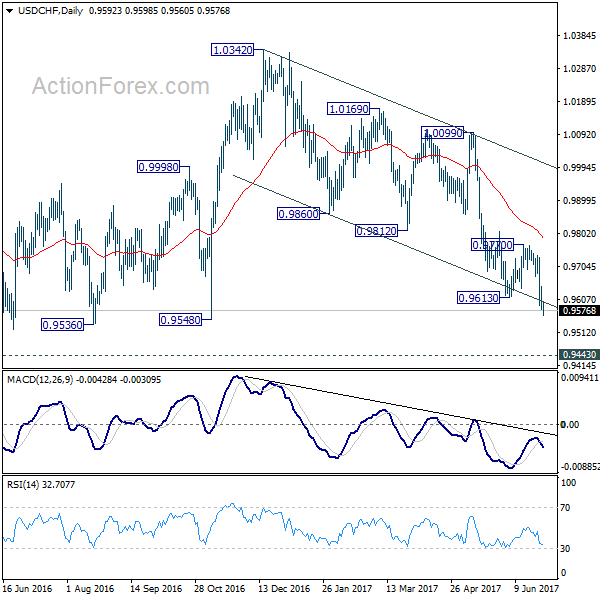
In the bigger picture, USD/CHF is still bounded in medium term range of 0.9443/1.0342 for the moment. Consolidative trading would likely continue and medium term outlook remains neutral. Break of 1.0342 key resistance is needed to confirm underlying bullish momentum in the pair. Meanwhile, downside attempts should be contained by 0.9443 key support level. However, sustained break of 0.9443 will carry larger bearish implication and target 0.9 handle.
US Oil Inventory Report Showed A 118kb Increase In US Crude Stocks
Market movers today
Today, HICP inflation from Spain and Germany for June will be in focus. We look for Spanish inflation to have dropped to 1.4% y/y (consensus: 1.5% y/y) from 2.0% in May. In Germany, we are in line with consensus at 1.3% y/y from 1.4% in May. The drop in June inflation is estimated to have been driven by lower energy prices. Italian HICP inflation released yesterday further suggests that food price inflation had a lower contribution in June and it gives downside risk to our estimates for today's releases.
In the euro area, business confidence data is due to be released by the EU Commission. It normally mirrors what we see in PMI and regional business surveys – so not much new information in this.
In the US, it is time for the weekly jobless claims. It has been hovering around 235-250,000 since March, pointing to a quit e robust labour market with few layoffs. The Fed's Bullard is due to speak tonight on monetary policy.
In the Scandies, focus will be on Swedish retail sales and household lending.
Overnight Japan will be releasing CPI and Chinese official PMI manufacturing for June is also due.
Selected market news
Bank of England Governor Mark Carney joined the ECB's Mario Draghi in talking about the necessity t o remove some stimulus at yesterday's Sintra conference. In addition to Draghi, who elaborated further on Tuesday's hawkish comment s, t he Bank of Japan's Governor Haruhiko Kuroda and t he Bank of Canada's Governor Stephen Poloz at tended the conference. The latter two did not provide any new information about monetary policy. Indeed, it is quite significant to see Carney now placing himself in the hawkish camp as he has until recently argued that an unchanged policy stance would be appropriate for now. Notably, the BoE Chief Economist Andrew Haldane last week said that he had changed his mind. In addition, we already had three dissenters favouring rate hikes at the latest BoE meeting. Clearly, the balance in favour of a hike on the MPC looks set to start tipping and is clearly challenging our call that BoE will stay unchanged during Brexit negotiations.
The growing consensus among major central banks about the need for tightening monetary policy has not deterred risk sent iment in financial markets. Stock markets are holding up across the US, European and Asian market and so are commodity prices. Hence, the main impact in sentiment has been in FX and fixed income markets, where short -term rates have risen, giving support to EUR and GBP – see more on next page.
The weekly US oil inventory report showed a 118kb increase in US crude stocks. The report also showed a decline in both implied crude demand and implied gasoline demand. Finally, there was another 1.4mb draw on the strategic petroleum reserves last week. The combination of weak implied demand and the additional oil flowing to the market from the strategic reserves will continue to keep a lid over oil prices in the short term, in our view.
USD/JPY Daily Outlook
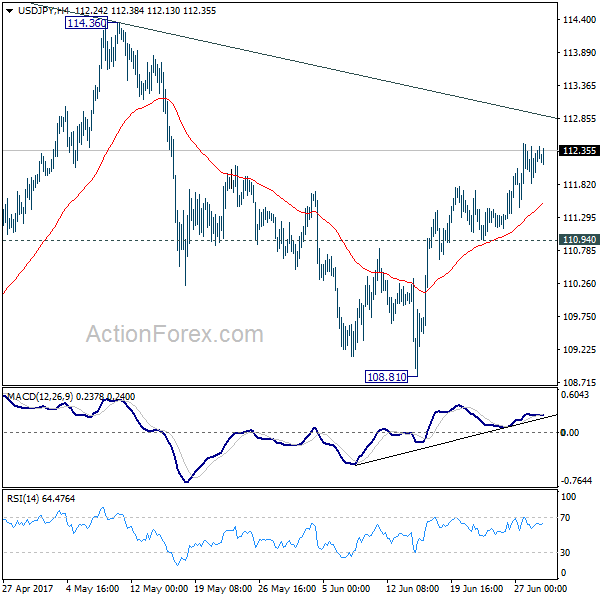
Daily Pivots: (S1) 111.96; (P) 112.18; (R1) 112.55; More...
Intraday bias in USD/JPY remains on the upside as rise from 108.81 is in progress for channel resistance (now at 112.89). Sustained break there will suggest that whole pull back from 118.65 has completed at 108.12 already. In such case, further rise should be seen to 114.36 resistance for confirmation. On the downside, however, break of 110.94 support will argue that rebound from 108.81 has completed and turn bias back to the downside.
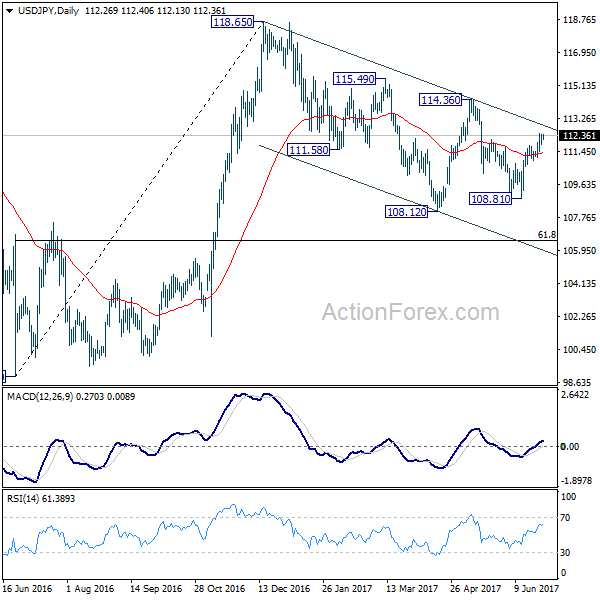
In the bigger picture, price actions from 125.85 high are seen as a corrective pattern. It's uncertain whether it's completed yet. But in case of another fall, downside should be contained by 61.8% retracement of 75.56 to 125.85 at 94.77 to bring rebound. Overall, rise from 75.56 is still expected to resume later after the correction from 125.85 completes.
Trade Idea : USD/JPY – Buy at 111.90
USD/JPY - 112.14
Most recent candlesticks pattern : N/A
Trend : Near term up
Tenkan-Sen level : 112.30
Kijun-Sen level : 112.13
Ichimoku cloud top : 112.08
Ichimoku cloud bottom : 111.87
Original strategy :
Buy at 111.70, Target: 112.70, Stop: 111.35
Position : -
Target : -
Stop : -
New strategy :
Buy at 111.90, Target: 112.90, Stop: 111.55
Position : -
Target : -
Stop : -
The greenback has continued trading with a firm undertone after this week’s rally on active cross-selling in yen, adding credence to our bullishness and signal the rise from 108.82 low is still in progress, hence further gain to 112.75–80 (61.8% projection of 108.82-111.79 measuring from 110.95) would be seen, however, loss of momentum should limit upside and price should falter below 113.00-10 today, risk from there is seen for a retreat later.
In view of this, would not chase this rise here and we are looking to buy dollar on pullback as 111.83 support should limit downside. Below minor support at 111.46 would defer and suggest top is possibly formed, risk weakness to 111.10-15, break there would confirm, then test of support at 110.95 would follow.

Australia’s New Home Sales Advanced In May
For the 24 hours to 23:00 GMT, the AUD rose 0.65% against the USD and closed at 0.7637.
LME Copper prices rose 0.6% or $33.0/MT to $5822.0/MT. Aluminium prices rose 1.3% or $24.5/MT to $1886.0/MT.
In the Asian session, at GMT0300, the pair is trading at 0.7655, with the AUD trading 0.24% higher against the USD from yesterday's close, following upbeat new home sales data in Australia.
Earlier today, data showed that Australia's new home sales rose 1.1% MoM in May, following a gain of 0.8% in the previous month.
The pair is expected to find support at 0.7600, and a fall through could take it to the next support level of 0.7544. The pair is expected to find its first resistance at 0.7688, and a rise through could take it to the next resistance level of 0.7720.
Looking ahead, Australia's private sector credit data for May, set to release in the early hours of tomorrow, will be on investors' radar.
The currency pair is trading above its 20 Hr and 50 Hr moving averages.

Euro Trading Higher, Ahead Of Germany’s Crucial Inflation Data
For the 24 hours to 23:00 GMT, the EUR rose 0.33% against the USD and closed at 1.1378.
On the economic front, Italy's flash consumer price index (CPI) unexpectedly dropped 0.1% on a monthly basis in June, defying market consensus for a gain of 0.1%. In the preceding month, the CPI had declined 0.2%.
Macroeconomic data showed that advance goods trade deficit in the US narrowed slightly more-than-expected to a level of $65.9 billion in May, following a revised deficit of $67.1 billion in the previous month, while markets anticipated the nation to record a deficit of $66.0 billion. Further, the nation's seasonally adjusted flash wholesale inventories rebounded more-than-expected by 0.3% in May, compared to a revised fall of 0.4% in the previous month.
On the contrary, pending home sales in the US unexpectedly declined 0.8% on a monthly basis in May, falling for the third consecutive month and confounding market expectations for a rise of 1.0%. Pending home sales had fallen by a revised 1.7% in the previous month. Also, the nation's MBA mortgage applications dropped by the most in six months, as it eased 6.2% in the week ended 23 June, following a rise of 0.6% in the previous week.
In the Asian session, at GMT0300, the pair is trading at 1.1403, with the EUR trading 0.22% higher against the USD from yesterday's close.
The pair is expected to find support at 1.1324, and a fall through could take it to the next support level of 1.1244. The pair is expected to find its first resistance at 1.1451, and a rise through could take it to the next resistance level of 1.1498.
Trading trend in the Euro today is expected to be determined by Germany's flash inflation figures and the final Euro-zone's consumer confidence, both for June, slated to release in a few hours. Moreover, the US annualised 1Q GDP and initial jobless claims data, will pique investor attention.
The currency pair is trading above its 20 Hr and 50 Hr moving averages.

Some Removal Of Monetary Stimulus Is Likely To Become Necessary: BoE Governor
For the 24 hours to 23:00 GMT, the GBP rose 0.93% against the USD and closed at 1.2938, following hawkish comments from the Bank of England (BoE) Governor, Mark Carney, that indicated support for a rate hike if UK’s economy stays firm.
The BoE Governor stated that higher interest rates will be “necessary” if wages pick up, and business investment strengthens.
On the data front, Britain’s seasonally adjusted house prices rebounded more-than-expected by 1.1% on a monthly basis in June, compared to a drop of 0.2% in the prior month. Meanwhile, market participants anticipated for a gain of 0.1%.
In the Asian session, at GMT0300, the pair is trading at 1.2958, with the GBP trading 0.15% higher against the USD from yesterday’s close.
The pair is expected to find support at 1.2843, and a fall through could take it to the next support level of 1.2728. The pair is expected to find its first resistance at 1.3024, and a rise through could take it to the next resistance level of 1.3090.
Moving ahead, investors will await UK’s net consumer credit and mortgage approvals data, both for May, slated to release in a few hours.
The currency pair is trading above its 20 Hr and 50 Hr moving averages.

Japan’s Retail Trade Sharply Declined In May
For the 24 hours to 23:00 GMT, the USD rose 0.13% against the JPY and closed at 112.36.
On the macro front, Japan's small business confidence index rose to a level of 49.2 in June, at par with market expectations. The index had recorded a reading of 48.9 in the previous month.
In the Asian session, at GMT0300, the pair is trading at 112.27, with the USD trading 0.08% lower against the JPY from yesterday's close.
Overnight data indicated that Japan's seasonally adjusted retail trade dropped 1.6% on a monthly basis in May, surpassing market expectations for a fall of 1.0%. In the prior month, retail trade had registered a rise of 1.4%. Moreover, the nation's large retailers' sales fell 0.6% in May, compared to a rise of 1.1% in the previous month, while investors had envisaged a drop of 0.5%.
The pair is expected to find support at 111.92, and a fall through could take it to the next support level of 111.58. The pair is expected to find its first resistance at 112.52, and a rise through could take it to the next resistance level of 112.78.
Going ahead, market participants will keep a close watch on Japan's jobless rate, national consumer price index and flash industrial production data, all for May, scheduled to release overnight.
The currency pair is showing convergence with its 20 Hr moving average and trading above its 50 Hr moving average.

Swiss ZEW Expectations Index Dropped In June While UBS Consumption Indicator Advanced In May
For the 24 hours to 23:00 GMT, the USD slightly declined against the CHF and closed at 0.9596.
In economic news, Switzerland’s ZEW economic expectations index dropped to a level of 20.7 in June, after recording a reading of 30.8 in the prior month. On the other hand, the nation’s UBS consumption indicator climbed to a level of 1.39 in May, following a revised reading of 1.34 in the preceding month.
In the Asian session, at GMT0300, the pair is trading at 0.9580, with the USD trading 0.17% lower against the CHF from yesterday’s close.
The pair is expected to find support at 0.9545, and a fall through could take it to the next support level of 0.951. The pair is expected to find its first resistance at 0.9631, and a rise through could take it to the next resistance level of 0.9682.
With no economic releases in Switzerland today, investors will look forward to global events for direction.
The currency pair is trading below its 20 Hr and 50 Hr moving averages.

BoC’s Stephen Poloz Signals Rate Hike In July
For the 24 hours to 23:00 GMT, the USD declined 1.03% against the CAD and closed at 1.3038.
The Canadian Dollar surged against the USD, after the Bank of Canada (BoC) Governor, Stephen Poloz, boosted speculation that an interest rate hike could come as early as next month. The BoC Governor stated that high unemployment and under-utilisation of resources in the Canadian economy is used up and that the central bank will take this into account when it issues a rate decision next month.
In the Asian session, at GMT0300, the pair is trading at 1.3035, with the USD trading marginally lower against the CAD from yesterday's close.
The pair is expected to find support at 1.2979, and a fall through could take it to the next support level of 1.2924. The pair is expected to find its first resistance at 1.3124, and a rise through could take it to the next resistance level of 1.3214.
The currency pair is trading below its 20 Hr and 50 Hr moving averages..
