
Sample Category Title
Trade Idea: EUR/JPY – Buy at 127.45
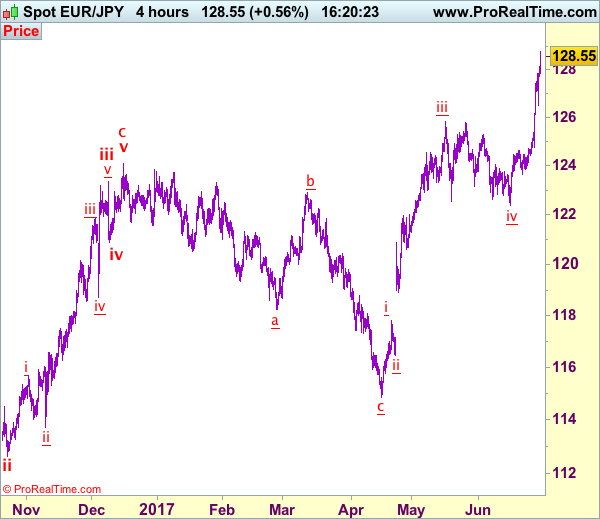
EUR/JPY - 128.55
Recent wave: wave v of (C) ended at 94.12 and major correction in wave A has ended at 149.79
Trend: Near term up
Original strategy:
Buy at 126.00, Target: 128.00, Stop: 125.40
Position: -
Target: -
Stop: -
New strategy :
Buy at 127.45, Target: 129.45, Stop: 126.85
Position: -
Target: -
Stop:-
Although euro retreated briefly to 126.49, renewed buying interest quickly emerged and the single currency has surged again, adding credence to our bullish count that recent upmove is still in progress and upside bias remains for medium term rise to extend further gain to 129.00-10, however, near term overbought condition should prevent sharp move beyond 129.50-60 and reckon psychological level 130.00 would hold from here, risk from there has increased for a retreat later.
In view of this, we are looking to reinstate long on pullback as 127.40-50 should limit downside. Below 126.90-00 would defer and risk test of said support at 126.49 but only break there would signal a temporary top is formed instead, bring correction to 126.00 and later towards 125.40-50.
Our latest preferred count is that wave (ii) is ABC-X-ABC which ended at 123.33 and wave (iii) is unfolding with wave iii ended at 100.77, followed by wave iv at 111.57 and wave v as well as the wave (iii) has ended at 97.04, followed by wave (iv) at 111.43 and wave (v) has ended at 94.12 which is also the end of the larger degree v, this also implied the major wave (C) has also ended there, hence major correction has commenced from there with (A) leg unfolding in its lower degree wave c which has possibly ended at 145.69. Under this count, A-B-C wave (B) has commenced with A leg ended at 136.23, wave B at 143.79 and wave C has possibly ended at 149.79.
Our larger degree count is that the decline from 139.26 is wave (C) and is sub-divided into a diagonal triangle i-ii-iii-iv-v with wave i - 105.44, wave ii- 123.33, wave iii - 97.03, wave iv - 111.43, followed by the final wave v as well as the end of wave (C) at 94.12, this also mark the bottom of larger degree wave B. Under this count, major rise in wave C has commenced as an impulsive wave with minor wave III ended at 145.69, wave V is still in progress for further gain to 150.00. Having said that, this so-called wave V could well be the first leg of larger degree 5-waver wave C and this wave C should bring at least a retest of wave A top at 169.97 (July 2008).

Trade Idea: AUD/USD – Hold long entered at 0.7595
AUD/USD – 0.7668
Recent wave: Wave 5 ended at 1.1081 and major correction has commenced for fall to 0.7000 and then towards 0.6500-10
Trend: Near term up
Original strategy :
Bought at 0.7595, Target: 0.7745, Stop: 0.7555
Position: - Long at 0.7595
Target: - 0.7745
Stop: - 0.7555
New strategy :
Hold long entered at 0.7595, Target: 0.7745, Stop: 0.7615
Position: - Long at 0.7595
Target: - 0.7745
Stop:- 0.7615
As aussie has finally surged and broke above previous resistance at 0.7636, adding credence to our bullish view for resumption of recent upmove and upside bias remains for the rise from 0.7329 to extend gain to 0.7700 but loss of momentum should limit upside to chart resistance at 0.7750 and price should falter below 0.7785-90.
In view of this, we are holding on to our long position entered at 0.7595. Below previous resistance at 0.7625 (now support) would defer and risk weakness to 0.7600 but only break of support at 0.7577 would signal top is formed instead, bring correction towards support at 0.7535 which is likely to hold from here.
On the 4-hour chart, the move from 0.8066 is the wave 5 with i: 0.8860, ii: 0.8315, wave iii is an extended move ended at 1.0183, iv: 0.9706 and wave v has ended at 1.1081 (also the top of entire wave 5). The subsequent selloff is the major correction which is unfolding as ABC-X-ABC and 2nd A leg has ended at 0.8848, followed by a-b-c wave B which ended at 0.9758, hence, 2nd C wave is now in progress and indicated downside target at 0.7000 and 0.6950 had been met, so further fall to 0.6710-20 cannot be ruled out.

Foreign Exchange Market Commentary: EUR/USD, USD/JPY, GBP/USD, GOLD, WTI CRUDE, DJIA, FTSE100, DAX
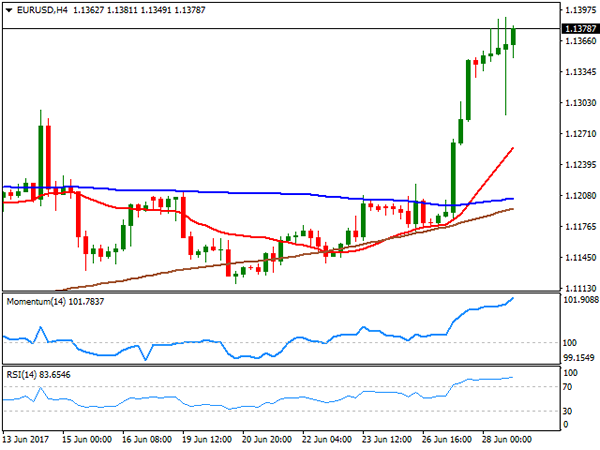
EUR/USD
The American dollar was the worst performer for a second consecutive day, followed this time by its Japanese counterpart, while the Pound led the way higher. The EUR/USD pair settled at a fresh high for this 2017, not far from an intraday high of 1.1389, reversing a sudden decline to 1.1290, proving market is now buying the dips. The main market motor continued to be the ECB's Forum on Central Banking taking place in Portugal. Ahead of Wall Street's opening, officers from the European Central Bank said that markets "misjudged" Draghi's Tuesday speech, trying to cold down enthusiasm over upcoming possible tapering. Draghi did the same in his speech later on the day, but failed. The pair fell down to 1.1290 on the initial headline, but quickly recovered ground, surging further after the Pound soared on BOE's Carney sudden flip in its stance towards rate hikes.
The ECB Form ends this Wednesday, with attention shifting towards the macroeconomic calendar from now, and investors hoping data back the ongoing rallies. This Thursday, Germany will release its preliminary June inflation figures, the EU business sentiment indicators, while the US will offer the last revision of Q1 GDP.
In the meantime, the 4 hours chart for the pair shows that technical indicators resumed their advances after a period of consolidation within extreme overbought levels, whilst the 20 SMA advanced further above the larger ones, but below the current level. The pair seems poised to extend its advance up to the critical 1.1460 region, a strong area that rejected advances pretty much since January 2015. There's a good chance that an approach to it will trigger profit taking, forcing the pair to retreat, at least partially.
Support levels: 1.1330 1.1290 1.1260
Resistance levels: 1.1390 1.1425 1.1460
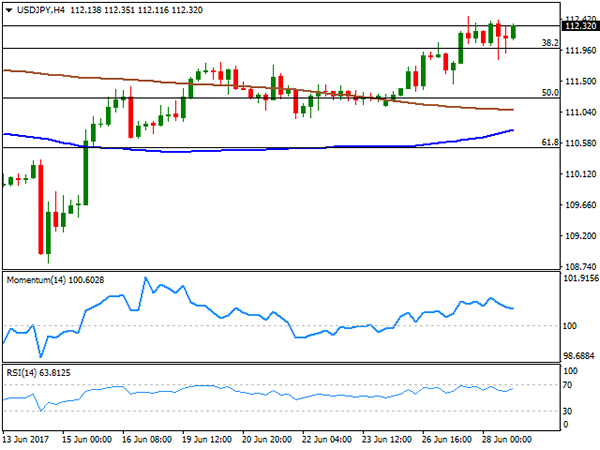
USD/JPY
The USD/JPY pair consolidated at the higher end of its weekly range this Wednesday, holding on to gains, despite broad dollar's weakness amid resurging US Treasury yields. Bond's sell-off was triggered on Tuesday by ECB's Draghi, whose optimism on the local recovery spurred speculation for a soon-to-came end of QE in the Euro area. Yields continued advancing, despite the ECB's President tried to cold down market's speculation, with the US 10-year note benchmark trading as high as 2.26% intraday, up from previous 2.20% and its highest in over a month. The Japanese macroeconomic calendar will remain empty once again, with more interesting data coming early Friday. Technically, the pair presents a positive short term tone, as a short-lived dip below the 112.00 Fibonacci support was quickly reverted, while the price holds above its 100 and 200 SMAs, as technical indicators are trying to regain the upside after a modest downward corrective movement from near oversold readings.
Support levels: 112.00 111.60 111.20
Resistance levels: 112.45 112.80 113.20
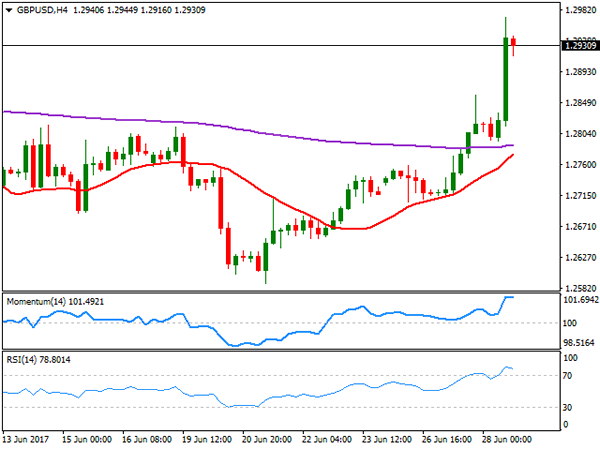
GBP/USD
The Sterling soared to as high as 1.2971 against the greenback, its highest since June 8th, as BOE's Carney surprised market players with a 180 degree turn on monetary policy. Carney said that an interest rate hike will be "necessary" if the global recovery continues, leading to stronger wage growth. Additionally, he said that the global recovery was becoming "broad-based" and that "some removal of monetary stimulus is likely to become necessary if the trade-off facing the MPC continues to lessen and the policy decision accordingly becomes more conventional." The pair retreated from the mentioned high but stabilized above the 1.2900 level. Brexit headlines have been out of focus for nearly a week, but can return to hit Pound any time, although now that PM May got support from the DUP, negative news are not expected short term. In the meantime, the 4 hours chart shows that the 20 SMA has extended its advance below the current level, now nearing the 200 EMA and with technical indicators having turned flat within extreme overbought levels, supporting some consolidation ahead, before the next directional move. Early June high of 1.2977 is the immediate resistance, with a stronger one in the 1.3050 price zone, from where the pair retreated late May.
Support levels: 1.2760 1.2720 1.2670
Resistance levels: 1.2820 1.2855 1.2900
GOLD
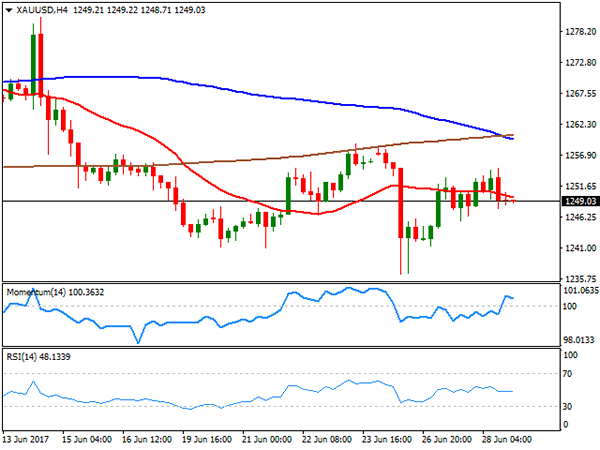
Spot gold advanced intraday up to $1,254.67 a troy ounce, but was unable to hold on to gains, ending the day pretty much flat around 1,249.00. Dollar's fragile tone gave support to the commodity, despite hawkish central bankers should end up sending the safe-haven asset lower, as confident policymakers usually boost high-yielding assets. Falling bonds' prices also weighed on gold. From a technical point of view, the daily chart shows that the price remains below its 20 and 100 SMAs, with the shortest still aiming lower above the current level, whilst technical indicators continue lacking clear directional strength, but within bearish territory. In the 4 hours chart, the commodity settled below its 20 SMA, while the 100 SMA is crossing below the 200 SMA, both around 1,260.00, leaning the scale towards the downside. Technical indicators in this last time frame are now neutral, hovering around their mid-lines and with no signs of directional strength.
Support levels: 12,245.50 1,236.45 1,229.35
Resistance levels: 1,258.00 1,265.10 1,273.80
WTI CRUDE OIL
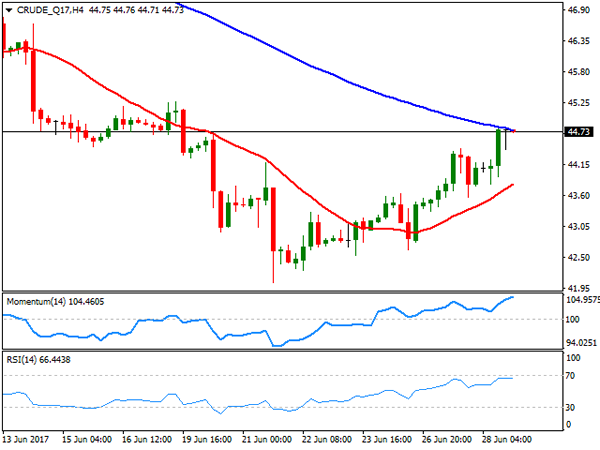
Crude oil prices advanced this Wednesday, with West Texas Intermediate crude futures ending the day at $44.73 a barrel. The EIA report released during the last American session showed that oil stockpiles increased by 0.118 million barrels in the week ended June 23rd, worst that the 3.25 million barrels' decline expected. But the EIA also informed that gasoline stockpiles fell by 900,000 barrels, while distillates shed 200,000, as the total domestic crude production fell by 100,000 bares a day in the same period. Reducing output brought some relief, but the recovery remains corrective, given that in the daily chart, the advance stalled right at a strongly bearish 20 DMA, whilst technical indicators have corrected higher, but remain within negative territory. In the 4 hours chart, the Momentum indicator keeps heading north well above its mid-line, whilst the RSI indicator turned flat around 66, as the price is being contained by a bearish 100 SMA also around the current level, supporting some additional gains ahead on a break through 44.90, the immediate resistance.
Support levels: 44.30 43.80 43.20
Resistance levels: 44.90 45.60 46.10
DJIA
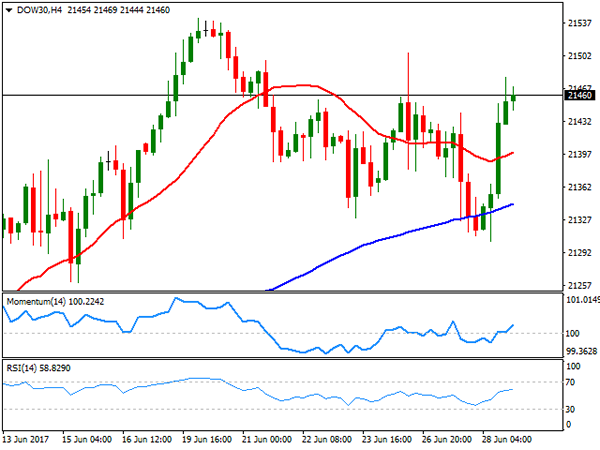
US equities rallied strongly, helped by a bounce in technology and energy-related equities, and hawkish central bankers fueling risk appetite. The Dow Jones Industrial Average added 143 points or 0.68%, to close at 21,454.61, while the S&P gained 21 points, to 2,440.69. The Nasdaq Composite jumped 1.43% higher, to end at 6,234.51. Higher bond yields, added to the positive tone in equities, backing banking shares. Within the Dow, Caterpillar was the best performer, up 2.42%, followed by JPMorgan Chase that added 2.01%. Only six members closed in the red, with Johnson & Johnson leading decliners with a 0.88% lost. The Dow daily chart shows that the benchmark bounced from a bullish 20 SMA, whilst technical indicators found support around their mid-lines, gaining upward traction but still below recent highs, favoring anyway another leg higher for this Thursday. In the 4 hours chart, the index is above all of its moving averages, although the 20 and the 100 SMAs lack directional strength, whilst technical indicators post modest advances within positive territory, enough at least to limit chances of a steeper decline.
Support levels: 21,432 21,389 21,351
Resistance levels: 21,495 21,542 21,590
FTSE100
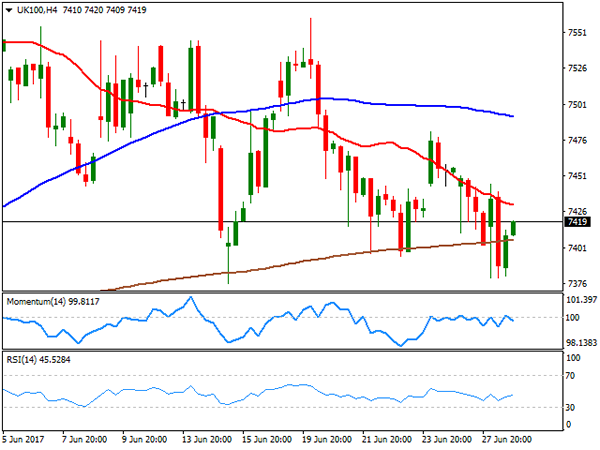
The FTSE 100 closed the day down 12 points, at 7,434.36, with retailers leading the decline, after a profit warning from Debenhams, a local department store that said its full-year profit could come at the lower end of expectations. A sharp advance in the mining sector, however, limited the decline. The Pound jumped higher after London's close, leading the index further lower in electronic trading, now around 7,403. Glencore led advancers, up 3.73%, followed by Rio Tinto, Anglo American and Antofagasta, all up by over 3.0% GKN was the worst performer, down 4.31%, followed by Admiral Group that shed 2.25%. From a technical point of view, the daily chart shows that the index remained well below a bearish 20 DMA, whilst technical indicators turned south within negative territory, favoring a downward extension for this Wednesday. Shorter term, the 4 hours chart shows that a bearish 20 SMA contained advances, whilst technical indicators also turned lower within bearish territory, with the RSI currently at 38, in line with the longer term perspective.
Support levels: 7,376 7,347 7,298
Resistance levels: 7,442 7,497 7,541
DAX
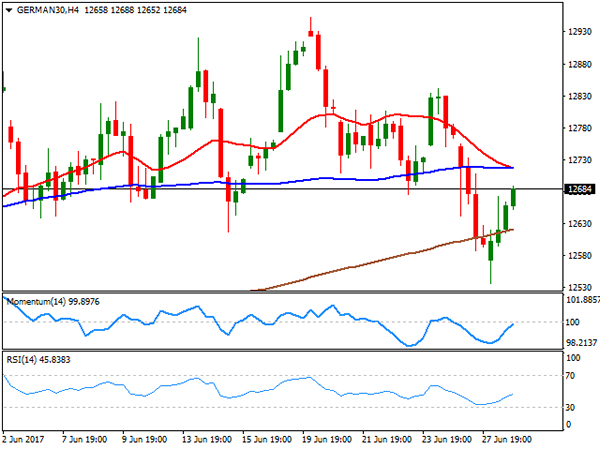
The German DAX closed the day at 12,671.02, down 99 points or 0.78%, as European equities edged lower following Draghi's hawkish speech that sent the EUR higher against all of its major rivals. Adding to the negative tone of regional equities were concerns over profits, with the automotive sector undermined by General Motors, as the company lowered its outlook for new sales in 2017. Within the DAX, only three members closed with gains, with Commerzbank that advanced 4.02% and Deutsche Bank, which gained 2.55% topping winners list amid Italian's banks rescue earlier in the week bringing confidence to the sector. Continental was the worst performer, down 3.70%, followed by E.ON that shed 3.68%. The German index fell further in after-hours trading, following the lead of Wall Street, heading into Wednesday opening right below 12,600, its lowest for this month. The daily chart shows that the index fell and stands well below its 20 DMA, whilst technical indicators are gaining bearish traction, the Momentum around its mid-line but the RSI around 44, this last favoring additional slides ahead. In the 4 hours chart, the index is now below its 200 SMA, having broken below the 20 and 100 SMA earlier on the week and with technical indicators heading sharply lower within bearish territory, maintaining their bearish slopes near oversold territory.
Support levels: 12,587 12,529 12,461
Resistance levels: 12,646 12,707 12,763
EUR/GBP Candlesticks and Ichimoku Analysis
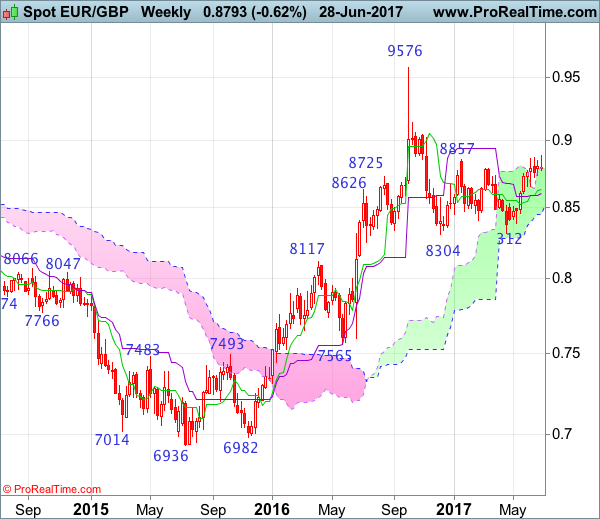
Weekly
• Last Candlesticks pattern: N/A
• ime of formation: N/A
• Trend bias: Near term up
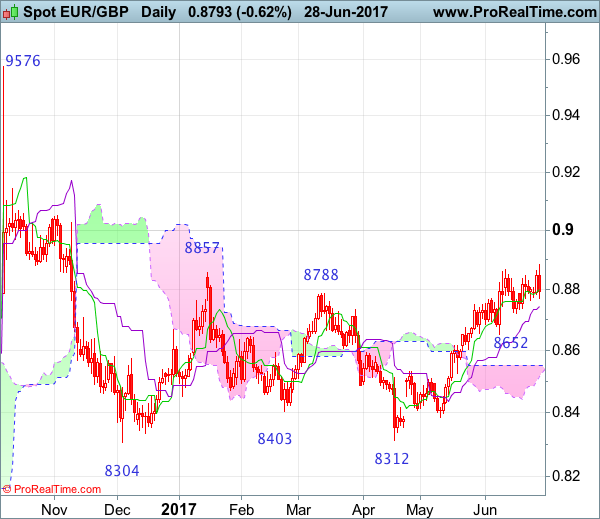
Daily
• Last Candlesticks pattern: Hammer
• Time of formation: 3 Feb 2016
• Trend bias: Up
EURGBP – 0.8802
Although the single currency edged higher to 0.8882 yesterday, lack of follow through buying on break of previous resistance at 0.8866 and the subsequent retreat suggest several days of consolidation below this level would be seen and pullback to 0.8723 support cannot be ruled out, however, reckon previous support at 0.8652 would contain downside and bring another upmove later, above said resistance at 0.8882 would extend recent upmove to 0.8900 but overbought condition should prevent sharp move beyond 0.8940-50 (50% Fibonacci retracement of 0.9576-0.8304) and reckon psychological resistance at 0.9000 would hold from here, price should falter well below 0.9090 (61.8% Fibonacci retracement), bring retreat later.
On the downside, whilst initial pullback to 0.8723 support is likely, reckon support at 0.8652 would attract renewed buying interest and bring another upmove later. Only a break below support at 0.8603 would suggest top is formed instead, bring retracement of recent upmove to 0.8550 but reckon previous support at 0.8524 would contain downside and price should stay well above 0.8450-60, bring a strong rebound later next month.
Recommendation: Buy again at 0.8660 for 0.8880 with stop below 0.8560.
On the weekly chart, despite rising marginally to 0.8882, the quick retreat from there looks set to form a shooting star, hence consolidation below this level would be seen with initial downside bias for pullback to 0.8720-25, then 0.6890-00, however, reckon support at 0.8652 would limit downside and bring another rise later. Above said resistance at 0.8882 would signal the rise from 0.8304 low is still in progress for headway to 0.8900-10, then 0.8950, however, reckon upside would be limited to 0.9000 and 0.9045-50 should hold from here, price should falter well below 0.9090 (61.8% Fibonacci retracement).
On the downside, although pullback to 0.8720-25 cannot be ruled out, reckon support at 0.8652 would hold and bring another rise to aforesaid upside targets. A weekly close below the Kijun-Sen (now at 0.8597) would defer and suggest top is possibly formed, risk weakness to 0.8550 but a drop below previous resistance at 0.8531 is needed to add credence to this view, bring further fall to 0.8490-00, then towards support at 0.8457 which is likely to hold from here.
EUR/CHF Candlesticks and Ichimoku Analysis
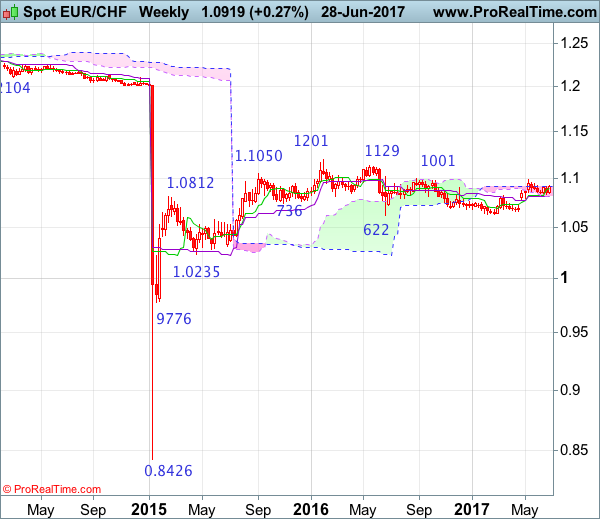
Weekly
• Last Candlesticks pattern: Doji
• Time of formation: 20 Feb 2017
• Trend bias: Up
Daily
• Last Candlesticks pattern: Doji
• Time of formation: 1 Sep 2016
• Trend bias: Near term down
EUR/CHF – 1.0923
As the single currency has staged a strong rebound after finding good support at 1.0833 and broke above indicated resistance at 1.0910, retaining our bullishness and signaling low has been formed at 1.0833, hence further gain to resistance at 1.0949, break there would confirm the pullback from 1.0988 has ended, bring test of 1.0960, break there would suggest upmove has resumed for retest of 1.0988, then towards previous resistance at 1.1001. Looking ahead, only a break there would retain bullishness and encourage for headway to 1.1050-60, then 1.1100, having said that, price should falter below another previous resistance at 1.1201.
On the downside, expect pullback to be limited to 1.0875-80 and support at 1.0833 should remain intact, bring another rebound. Below 1.0833 support would risk test of previous support at 1.0792 but only a daily close below there would signal top is formed at 1.0988 instead, bring subsequent fall to 1.0750 and then towards 1.0700-10, having said that, support at 1.0671 should remain intact, the single currency shall stage another rebound from there later.
Recommendation: Hold long entered at 1.0865 for 1.1065 with stop below 1.0835.

On the weekly chart, this week’s rebound looks set to form a long white candlestick and gain to 1.0949 resistance would be seen, break there would signal the pullback from 1.0988 has ended, bring retest of this level, above there would extend recent upmove from 1.0631 to previous resistance at 1.1001, a sustained breach above this level would signal the fall from 1.1201 has ended, bring further gain to 1.1100 and possibly test of resistance at 1.1129 but price should falter below said recent high at 1.1201.
On the downside, whilst pullback to the Tenkan-Sen (now at 1.0890) cannot be ruled out, said support at 1.0833 should remain intact, bring another rebound later. A break of said support at 1.0833 would risk test of the Kijun-Sen (now at 1.0810) but only break of previous support at 1.0780 would abort and signal top has been formed at 1.0988 instead, bring further weakness to 1.0720, however, still reckon support at 1.0656 would remain intact, bring another rebound later.
Forex Technical Analysis: EUR/USD, USD/JPY, GBP/USD
EUR/USD
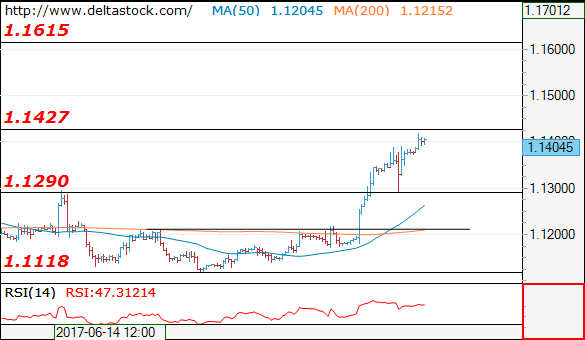
Current level - 1.1405
The brief consolidation dip tested precisely 1.1295 support area and the uptrend was renewed, currently struggling below 1.1430 dynamic hurdle. The bias is positive, for a break through the latter, towards 1.1550 and 1.1615 area.
| Resistance | Support | ||
| intraday | intraweek | intraday | intraweek |
| 1.1430 | 1.1430 | 1.1295 | 1.1020 |
| 1.1550 | 1.1610 | 1.1210 | 1.0838 |
USD/JPY
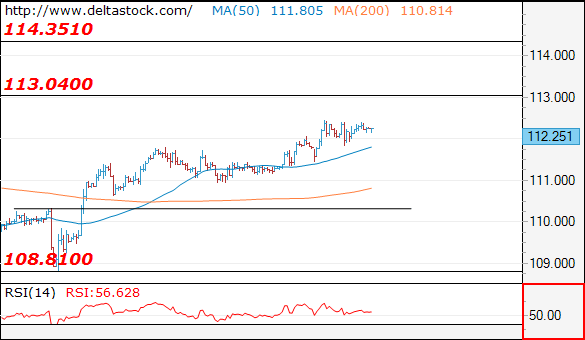
Current level - 112.25
USD/JPY Current level - 112.25
The uptrend is intact, heading towards 113.10 resistance area. A break through the latter should be expected, for another leg upwards, to 114.30 area. Crucial support lies at 111.30.
| Resistance | Support | ||
| intraday | intraweek | intraday | intraweek |
| 112.50 | 113.10 | 112.00 | 110.30 |
| 113.10 | 114.30 | 111.30 | 108.81 |
GBP/USD
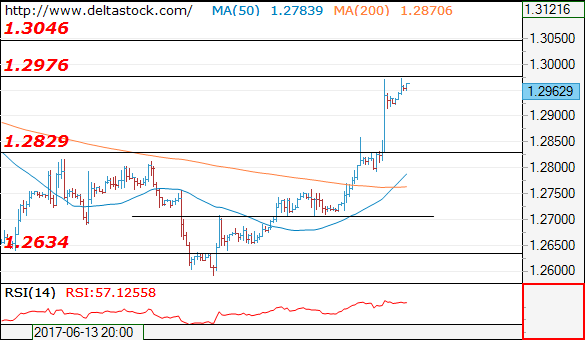
Current level - 1.2962
The uptrend is intact, currently testing 1.2980 resistance area. I favor a break through the latter, for a rise towards 1.3050. Initial intraday support lies at 1.2910, followed by the major one at 1.2830.
| Resistance | Support | ||
| intraday | intraweek | intraday | intraweek |
| 1.2980 | 1.3050 | 1.2910 | 1.2635 |
| 1.3050 | 1.3150 | 1.2830 | 1.2480 |
USD/CAD Daily Outlook
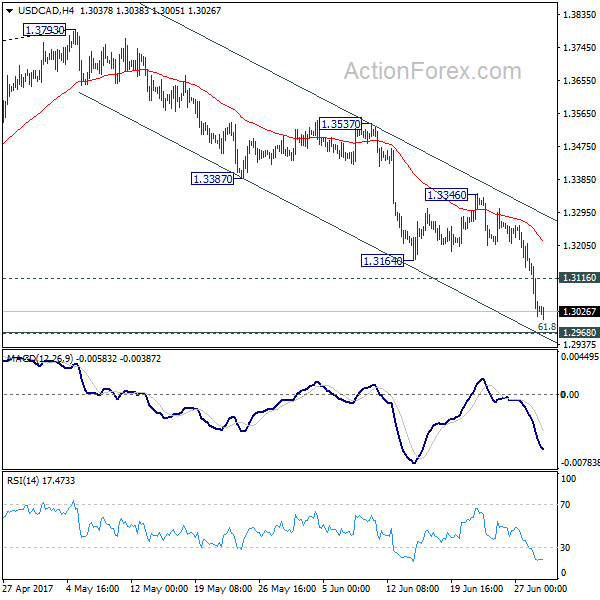
Daily Pivots: (S1) 1.2971; (P) 1.3084; (R1) 1.3155; More....
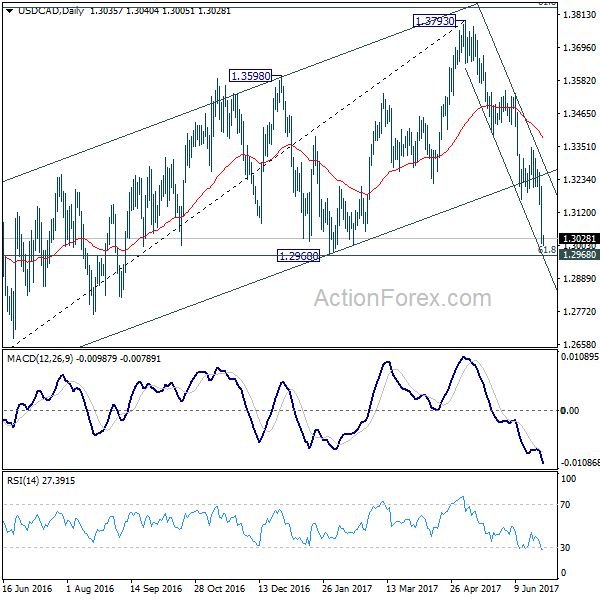
USD/CAD's decline extends to as low as 1.3005 so far. Intraday bias remains on the downside for 1.2968 cluster support, 61.8% retracement of 1.2460 to 1.3793 at 1.2969. Decisive break there will confirm our bearish view that whole corrective rise from 1.2460 has completed at 1.3793. On the upside, above 1.3116 minor resistance will turn bias neutral and bring recovery. But upside should be limited below 1.3346 resistance to bring fall resumption.
In the bigger picture, price actions from 1.4689 medium term top are seen as a correction pattern. The first leg has completed at 1.2460. Rise from 1.2460 is seen as the second leg and has completed at 1.3793, ahead of 61.8% retracement of 1.4689 to 1.2460 at 1.3838. Break of 1.3222 should now indicate the start of the third leg while further break of 1.2968 should confirm. In that case, USD/CAD should decline through 1.2460 support to 50% retracement of 0.9406 to 1.4869 at 1.2048.
Trade Idea : USD/CHF – Sell at 0.9645
USD/CHF - 0.9580
Most recent candlesticks pattern : N/A
Trend : Near term down
Tenkan-Sen level : 0.9579
Kijun-Sen level : 0.9604
Ichimoku cloud top : 0.9663
Ichimoku cloud bottom : 0.9629
Original strategy :
Sell at 0.9655, Target: 0.9555, Stop: 0.9690
Position : -
Target : -
Stop : -
New strategy :
Sell at 0.9645, Target: 0.9545, Stop: 0.9680
Position : -
Target : -
Stop : -
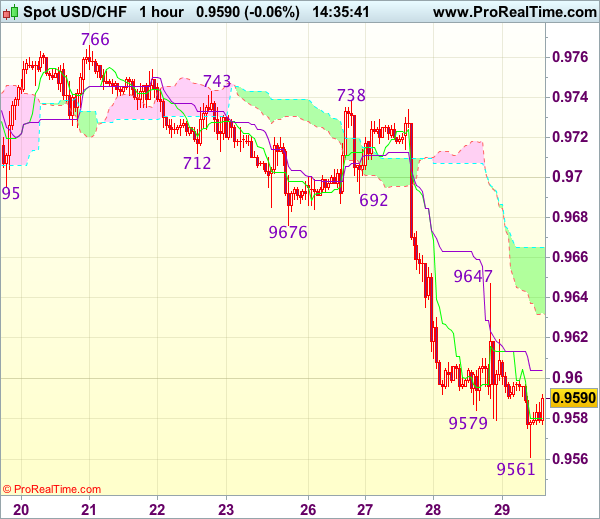
As the greenback has recovered after falling to 0.9561, suggesting minor consolidation would be seen and recovery to 0.9605-10 cannot be ruled out, however, reckon upside would be limited to resistance at 0.9647 and bring another decline, below said support at 0.9579 would signal the decline from 0.9771 top is still in progress and may extend weakness to 0.9545-50 (2 times extension of 0.9771-0.9676 measuring from 0.9738) but reckon downside would be limited to 0.9525-30 (50% projection of 1.10100-0.9613 measuring from 0.9771) and 0.9500 should hold, price should stay above 0.9470 (61.8% projection), bring rebound later.
In view of this, would not chase this fall here and we are looking to sell dollar on recovery as resistance at 0.9647 should limit upside. Only above previous support at 0.9676 (now resistance) would defer and suggest a temporary low is formed, risk test of another previous support at 0.9692.

USDCAD Declines For Fourth Straight Day, Remains Close To 4-Month Low
USDCAD has been in a downtrend since May. Yesterday the pair declined by a sizable 1.4%, reaching 1.3012 at its lowest, a four-month low. Should it finish the day lower, it would mark the fourth consecutive day of declines for the pair.
The RSI is projecting a negative short-term picture. The indicator is deep into bearish territory at 28. The MACD histogram supports this negative view, as it is below zero and the red signal line. It should be noted though, that RSI has entered oversold levels by crossing below the 30 level. This renders a reversal possible as well.
If the price advances, the area around 1.3070, which was of significance in the past, could provide resistance. A successful break above this area would bring the 1.31 handle, a potential psychological barrier, into perspective.
Should the price continue declining, yesterday’s low of 1.3012 could act as support. Notice that the price is currently close to this point. Below this, the eight-and-a-half-month low of 1.2968 from January 31 might offer additional support.
Turning to the medium-term picture, the contraction over the last couple of months has more or less offset the pair’s gain during the first months of the year, setting a neutral outlook. Further supporting this is the 200-day moving average line, which is more or less flat at the moment.
Overall, the near-term bias is bearish and the medium-term is neutral.
Dollar Index Hits 9-Month Low, Other Majors Strengthen On Hawkish Central Bankers
The dollar index, a broad measure of the greenback's strength, hit a nine-month low, as other major currencies strengthened on the back of their central banks preparing to scale back the accommodative monetary policies.
While yesterday's forex trading session was mostly dominated by central bankers' speeches, whose comments drove most of today's Asian session, the rest of the trading day will likely be commanded by a heavy flow of data releases out of both the eurozone and the US.
The dollar held steady against the yen during the Asian session. With a number of US economic data releases, especially the first quarter GDP later in the day, the pair could be volatile move today.
The euro continued to build on this week's strong momentum against the dollar, hitting a one-year high, amid the hawkish-perceived comments by European Central Bank President Mario Draghi. As the Asian trading session was coming to a close, euro/dollar got a lift on the back of better than expected preliminary Spanish harmonized index of consumer prices (HICP). At 1.6% growth year-on-year, Spanish HICP for June came above the expected level of 1.5%, though below the prior month's 2%. The pair was last trading at 1.1428, up 0.44% on the day.
The eurozone currency's strength against the greenback will be further put to a test as Germany releases its flash HICP number slightly later in the day, which will be followed by June's HICP for the eurozone tomorrow.
The pound also surged against the dollar on the more hawkish tone by Bank of England Governor Mark Carney during his speech in Portugal yesterday. This was a surprise for the markets as the BoE Governor had been maintaining a dovish take regarding the future steps of the UK's monetary policy. Pound/dollar was last trading at 1.2982, up 0.45% on the day.
The Canadian dollar reacted similarly, surging against the greenback as Bank of Canada Governor Stephen Poloz signaled a high chance of a July rate hike. Dollar/loonie continued to fall during the Asian session, last trading at 1.3005. No significant economic data release is expected out of Canada for the rest of the day.
Looking at commodities, WTI was up 1%, last trading at $45.12 a barrel. Reacting to the dollar weakness, gold inched up during the session, last trading at $1,250.80 an ounce.