Sample Category Title
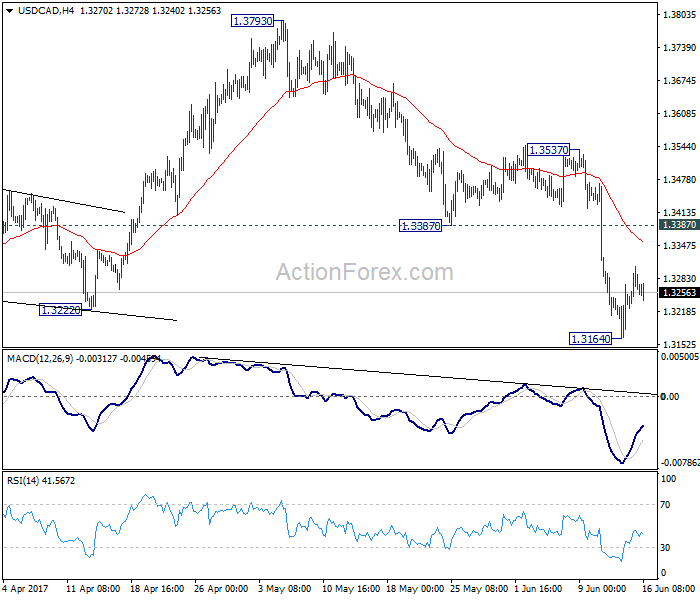
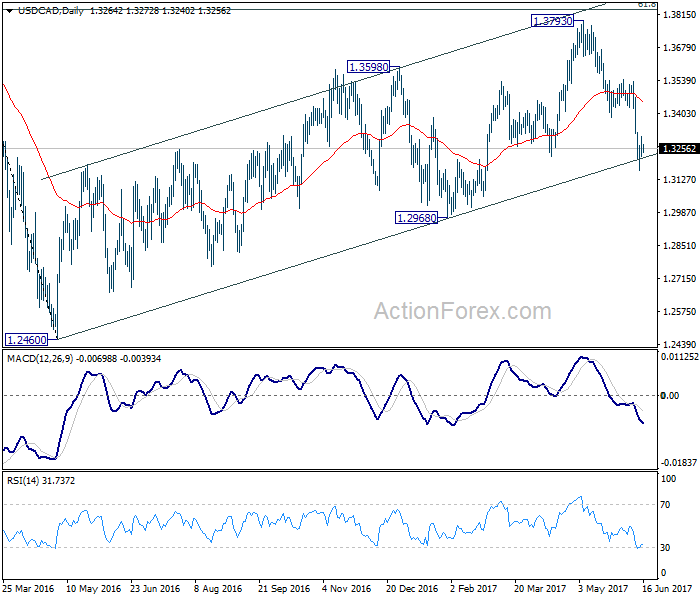
USD/CAD Daily Outlook
Daily Pivots: (S1) 1.3225; (P) 1.3267; (R1) 1.3309; More....
Intraday bias in USD/CAD remains neutral for consolidation above 1.3164 temporary low. Upside of recovery should be limited by 1.3387 support turned resistance and bring fall resumption. We hold on to the view that corrective rise from 1.2460 has completed at 1.3793 already and deeper decline is expected. Below 1.3164 will target 1.2968 support first. Break there should confirm our view and target 1.2460 and below.
In the bigger picture, price actions from 1.4689 medium term top are seen as a correction pattern. The first leg has completed at 1.2460. Rise from 1.2460 is seen as the second leg and has completed at 1.3793, ahead of 61.8% retracement of 1.4689 to 1.2460 at 1.3838. Break of 1.3222 should now indicate the start of the third leg while further break of 1.2968 should confirm. In that case, USD/CAD should decline through 1.2460 support to 50% retracement of 0.9406 to 1.4869 at 1.2048.
EUR/USD Daily Outlook
Daily Pivots: (S1) 1.1109; (P) 1.1168 (R1) 1.1205; More....
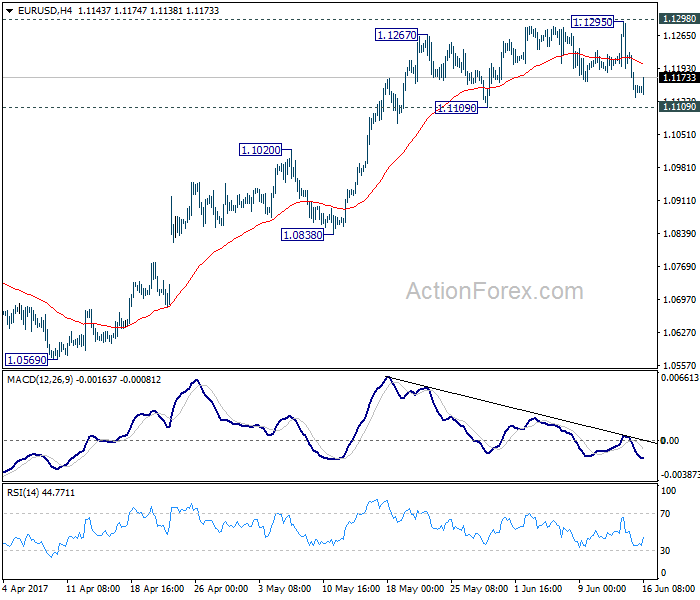
At this point, EUR/USD is still holding above 1.1109 support and outlook is unchanged. Intraday bias remains neutral with focus on 1.1298 key resistance. Decisive break there will carry larger bullish implication and target 1.1615 resistance next. On the downside, break of 1.1109 support will indicate short term topping and rejection from 1.1298. In such case, intraday bias will be turned to the downside for 1.0838 support.
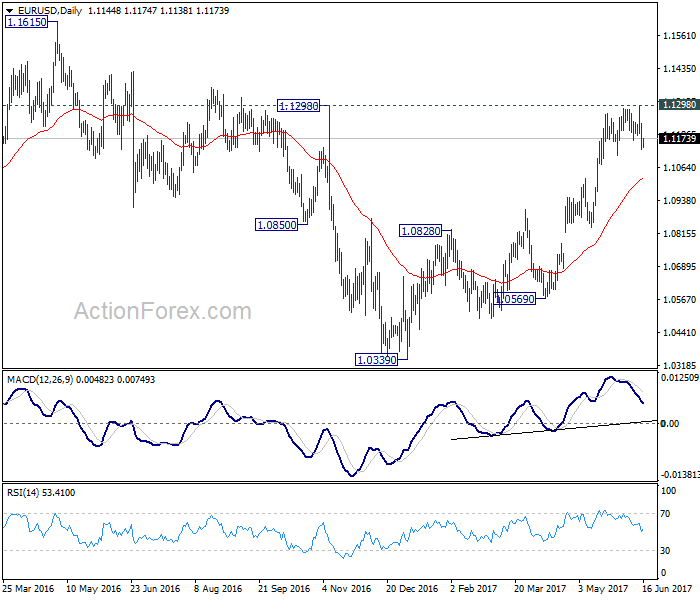
In the bigger picture, the case for medium term reversal continues to build up with EUR/USD staying far above 55 week EMA (now at 1.0922). Also, bullish convergence condition is seen in weekly MACD. Focus will now be on 1.1298 key resistance. Rejection from there will maintain medium term bearishness and would extend the whole down trend from 1.6039 (2008 high). However, firm break of 1.1298 will indicate reversal. In such case, further rally would be seen back to 1.2042 support turned resistance next.
GBP/USD Daily Outlook
Daily Pivots: (S1) 1.2697; (P) 1.2746; (R1) 1.2803; More...
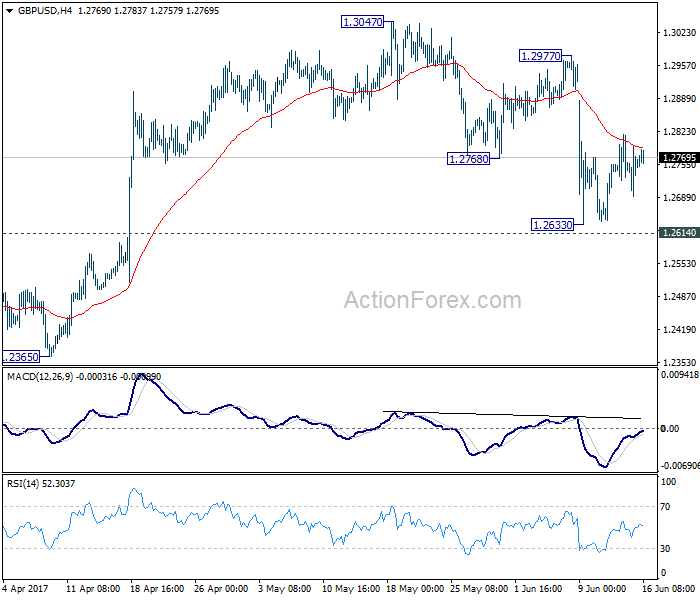
GBP/USD is staying in range above 1.2633 and struggles to break through 4 hour 55 EMA. Intraday bias remains neutral first. Also, near term outlook stays bearish with 1.2977 resistance intact. We continue to favor the case that consolidation pattern from 1.1946 has completed at 1.3047 already. Decisive break of 1.2614 resistance turned support would confirm our bearish view and target a test on 1.1946 low next. However, break of 1.2977 will dampen our view and turn bias back to the upside for 1.3047 and above.
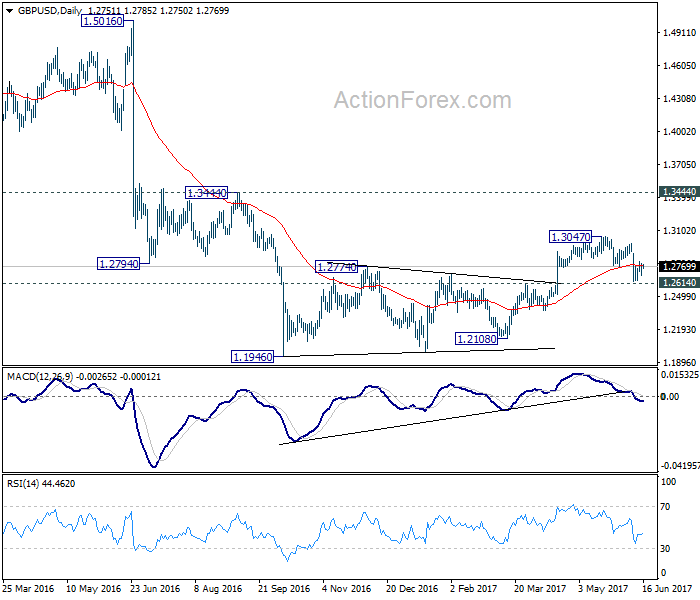
In the bigger picture, fall from 1.7190 is seen as part of the down trend from 2.1161. Price actions from 1.1946 medium term low are seen as a consolidation pattern, which could have completed after hitting 55 week EMA. Break of 1.1946 low will target 61.8% projection of 1.5016 to 1.1946 from 1.3047 at 1.1150 next. In case the consolidation from 1.1946 extends, outlook will stay remain bearish as long as 1.3444 resistance holds.
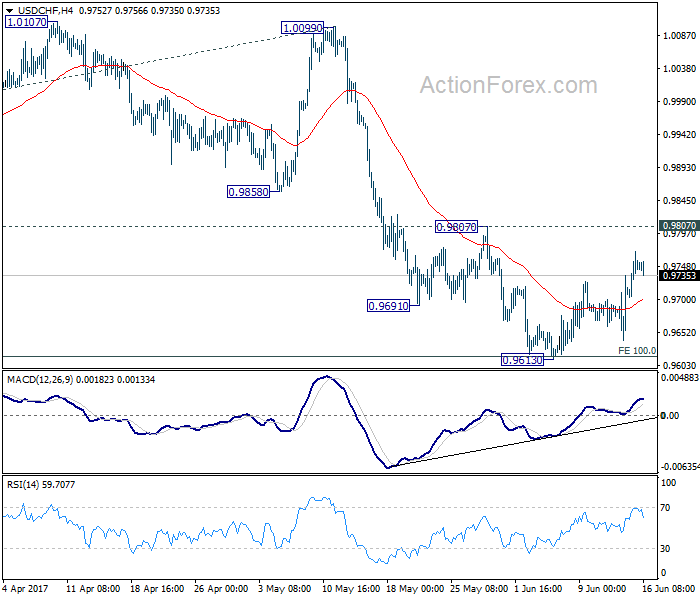
USD/CHF Daily Outlook
Daily Pivots: (S1) 0.9654; (P) 0.9694; (R1) 0.9749; More.....
Despite extending the rebound from 0.9613, USD/CHF is still holding below 0.9807 resistance. Intraday bias remains neutral, with bearish near term outlook. Break of 0.9613 will extend the whole decline from 1.0342 to 0.9548 support and below. We'd start to look for bottoming signal again as it approaches 0.9443 key support level. However, considering bullish convergence condition in 4 hour MACD, break of 0.9807 will indicate near term reversal and turn outlook bullish for 1.0099 resistance next.
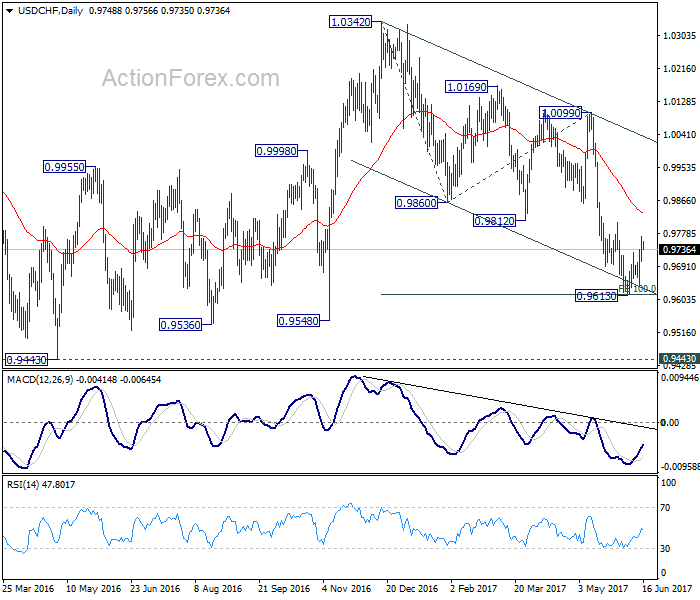
In the bigger picture, USD/CHF is still bounded in medium term range of 0.9443/1.0342 for the moment. Consolidative trading would likely continue and medium term outlook remains neutral. Break of 1.0342 key resistance is needed to confirm underlying bullish momentum in the pair. Meanwhile, downside attempts should be contained by 0.9443 key support level. However, sustained break of 0.9443 will carry larger bearish implication and target 0.9 handle.
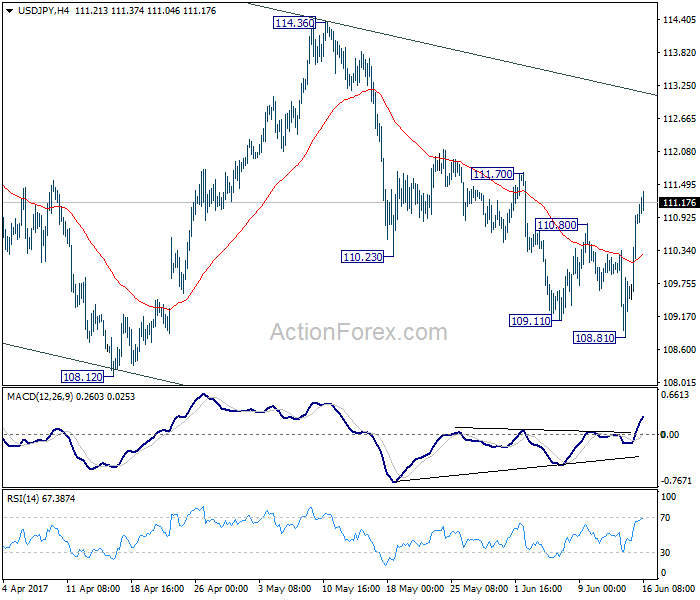
USD/JPY Daily Outlook
Daily Pivots: (S1) 109.81; (P) 110.39; (R1) 111.52; More...
USD/JPY's break of 110.80 resistance suggests that fall from 114.36 has completed at 108.81 already. Intraday bias is turned back to the upside for channel resistance (now at 113.06). Sustained break there will argue that whole pull back from 118.65 has completed at 108.12 already. In such case, further rise should be seen to 114.36 resistance for confirmation. Nonetheless, break of 108.81 will still extend the fall from 118.65 through 108.12 low before completion.
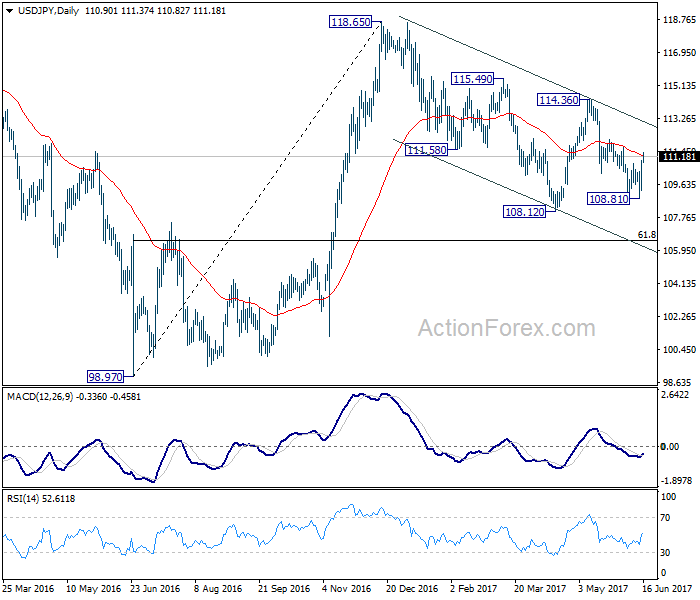
In the bigger picture, price actions from 125.85 high are seen as a corrective pattern. It's uncertain whether it's completed yet. But in case of another fall, downside should be contained by 61.8% retracement of 75.56 to 125.85 at 94.77 to bring rebound. Overall, rise from 75.56 is still expected to resume later after the correction from 125.85 completes.
Technical Outlook: EURUSD Risks Deeper Pullback On Break Below 1.1120/00 Triggers
Thursday's strong close in red and below 1.1166 (09 June trough) is seen as bearish signal, as the pair moved lower after three consecutive Dojis and repeated rejection under 1.1300 target.
Fresh bearish pressure is coming from 10/20SMA bear cross which is forming at 1.1212, with next key supports at 1.1121/09 (Fibo 38.2% of 1.0839/1.1295 upleg/30 May low) being in focus.
Sustained break below 1.1121/09 pivots would open way for extended correction towards initial target at 1.1075 (daily Kijun-sen) and 1.1020/00 (Fibo 61.8% of 1.0839/1.1295 upleg/psychological support) in extension.
Corrective rally on oversold studies should stay capped under 1.1200 handle to keep fresh near-term bears intact.
Res: 1.1185, 1.1212, 1.1268, 1.1295
Sup: 1.1132, 1.1121, 1.1109, 1.1075
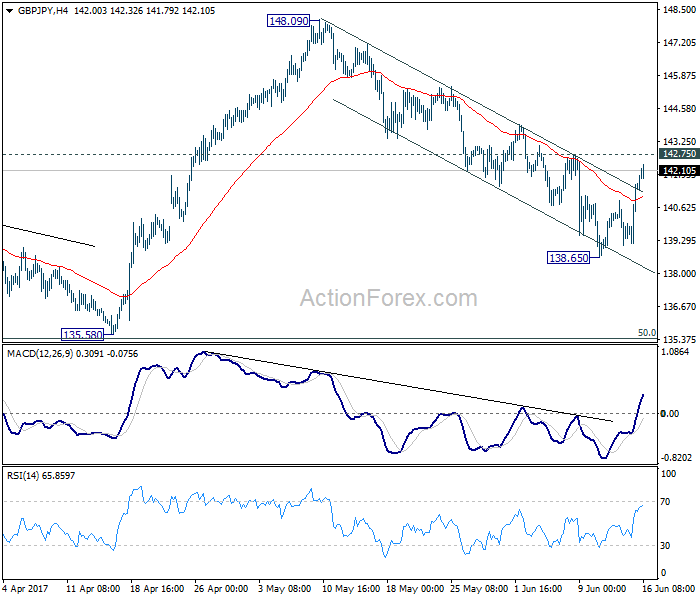
GBP/JPY Daily Outlook
Daily Pivots: (S1) 139.92; (P) 140.75; (R1) 142.33; More....
GBP/JPY's rebound from 138.65 extends higher to but and break of near term falling channel suggests reversal. Focus is back on 142.75 minor resistance. Break will confirm and turn bias to the upside for retesting 148.09. Below 138.65 will extend the fall from 148.09. In that case, we'd look for bottoming signal around 135.58, which is close to 135.39 fibonacci level, to bring rebound.
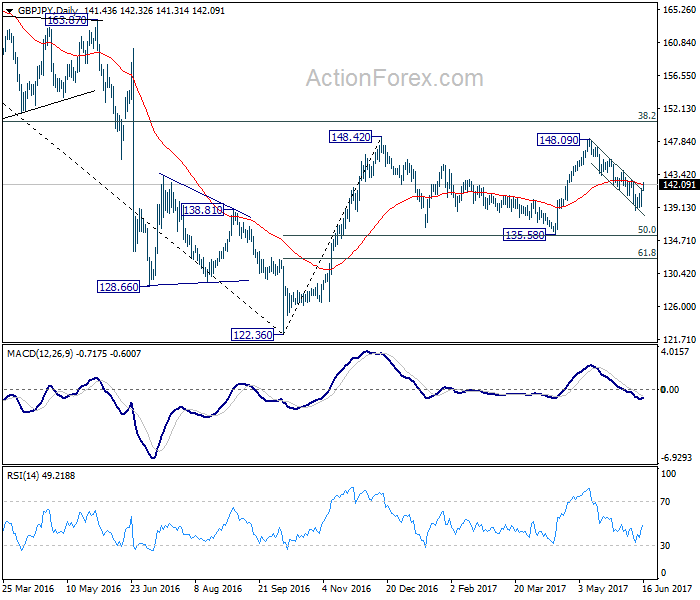
In the bigger picture, while the fall from 148.09 is deeper than expected, we're not bearish in the cross yet. Price action from 148.42 is possibly developing into a sideway pattern with fall from 148.09 as the third leg. Deeper decline could be seen but we're looking for strong support from 135.58 and 50% retracement of 122.36 to 148.42 at 135.39 to contain downside. Rise from 122.36 is still mildly in favor to resume at a later stage. However, sustained break of 135.58/39 will confirm reversal and target a retest on 122.36 low.
Yen Softer After BoJ Makes No Change To Monetary Policy Or Economic Outlook, Dollar Holds Onto Post-FOMC Gains
The yen weakened after the Bank of Japan (BoJ) left monetary policy unchanged today while the US dollar remained firm after the Federal Reserve raised interest rates on Wednesday.
The BoJ announced its decision to maintain its current monetary policy without making any tweaks, as was widely expected, since inflation in Japan is still very subdued. The main interest rate was kept at -0.1% and there was no change to its asset purchase program or yield curve control. Its economic assessment was maintained and some investors were disappointed as they were looking to see if there would be any upgrade to the outlook.
The dollar rose to a fresh 2-week high of 111.37 yen while the euro jumped to a 1-week high of 124.21 yen after the BoJ announcement. The yen slid even further as BoJ Governor Haruhiko Kuroda spoke during a press conference and mentioned that talk of exiting stimulus was still premature since inflation was far from the BoJ's 2% target and inflation expectations haven't started rising yet.
The greenback was already firm due to the Fed rate hike on Wednesday. With a diverging monetary policy between the US and Japan's central banks, the yen is expected to weaken against the dollar. Meanwhile, the release of encouraging US data yesterday on jobless claims and on manufacturing activity in the New York and Philadelphia regions also helped support the US currency. The dollar index, which measures the greenback against a basket of peers, rose to 97.56, a more than 2-week high.
The euro is on track to end the week with losses against the dollar. Despite a brief spike to come close to the key $1.1300 level on Wednesday, the single currency fell below the $1.1200 level yesterday on a firmer greenback that was lifted after the FOMC meeting. The euro traded around $1.1145 during today's Asian session.
The pound was steady around $1.2765, close to the highs reached after rallying following the Bank of England meeting yesterday that showed the BoE was closer to hiking rates.
Crude prices held onto losses in Asian trading after edging lower on Thursday. West Texas Intermediate (WTI) oil prices consolidated around yesterday's low of $44.22 a barrel.
Spot gold touched as low as $1,251.05 per ounce and is on track to end the week with losses, as a broadly post-FOMC dollar is weighing on the precious metal.
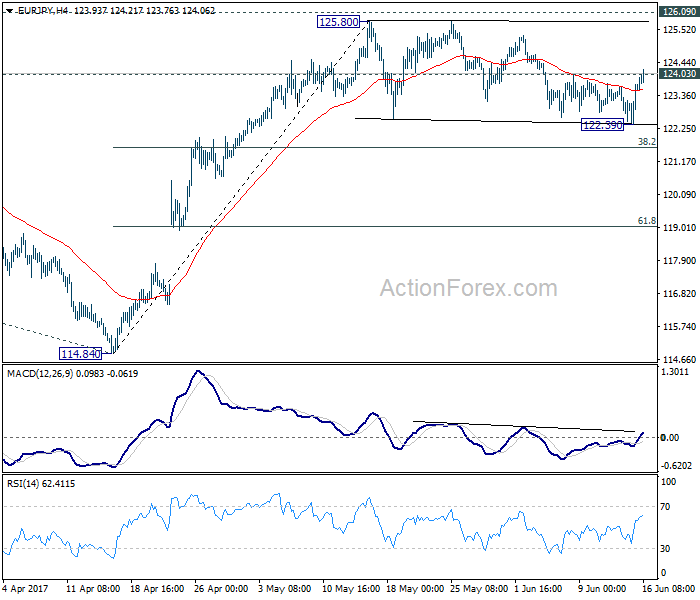
EUR/JPY Daily Outlook
Daily Pivots: (S1) 122.78; (P) 123.25; (R1) 124.10; More...
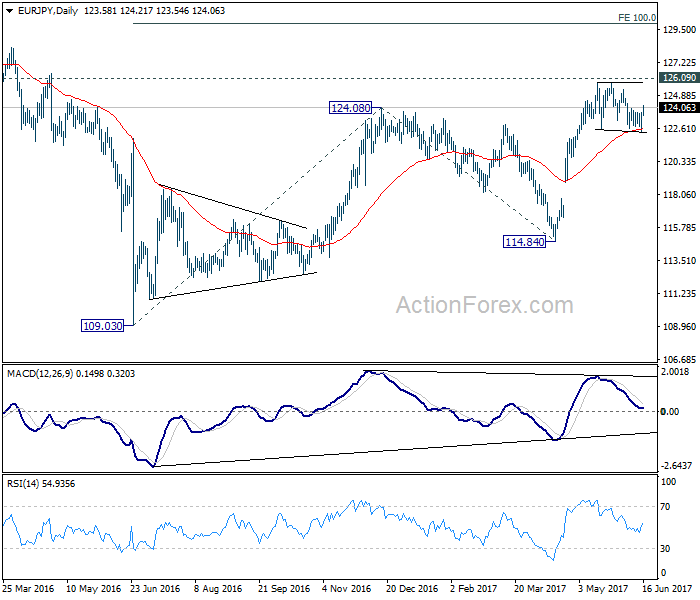
EUR/JPY drew support from 55 day EMA and recovered. Intraday bias is turned back to the upside for retesting 125.80/126.09 resistance zone. Break of 126.09 will extend the whole rebound from 109.03 to 100% projection of 109.03 to 124.08 from 114.84 at 129.89. In case of another fall, we'd still expect strong support from 38.2% retracement of 114.84 to 125.80 at 121.61 to bring rebound and then rise resumption.
In the bigger picture, focus is staying on 126.09 support turned resistance. Decisive break there will confirm completion of the down trend from 149.76. And in such case, rise from 109.20 is at the same degree and should target 141.04 resistance and above. Meanwhile, rejection from 126.09 and break of 114.84 will extend the fall from 149.76 through 109.20 low.
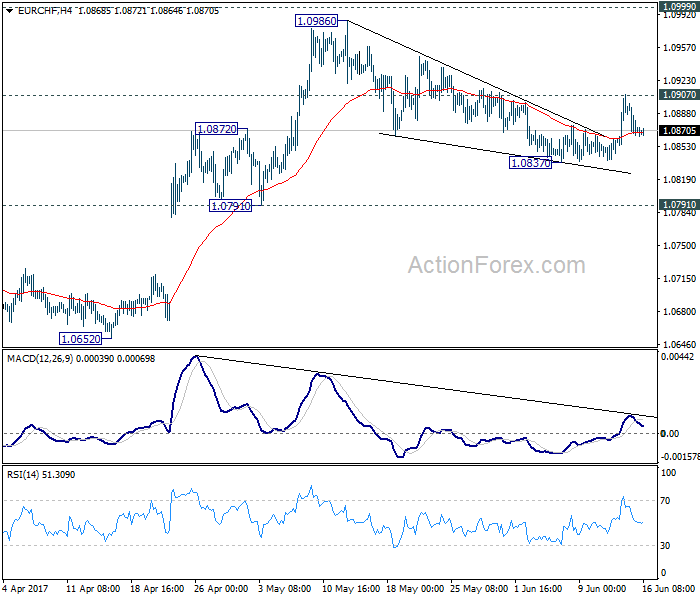
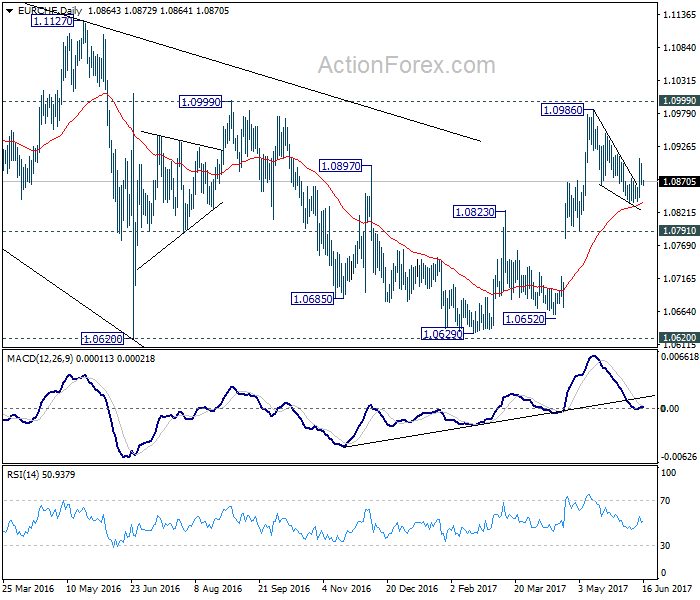
EUR/CHF Daily Outlook
Daily Pivots: (S1) 1.0858; (P) 1.0878; (R1) 1.0891; More...
EUR/CHF retreated after hitting 1.0907 and intraday bias is turned neutral again. We'd favoring the case that pull back from 1.0986 has completed at 1.0837 already. Above 1.0907 will turn bias to the upside for retesting 1.0986/0999 resistance zone. Below 1.0836 will extend the correction. Still, we'd expect strong support from 1.0791/0872 support zone to bring rebound.
In the bigger picture, the price actions from 1.1198 are seen as a corrective move. Such correction could have completed after defending 38.2% retracement of 0.9771 to 1.1198 at 1.0653. Decisive break of 1.0999 resistance will target a test on 1.1198 high. For now, this will be the preferred case as long as 1.0791 support holds.