Sample Category Title
EUR/AUD Daily Outlook
Daily Pivots: (S1) 1.4664; (P) 1.4730; (R1) 1.4771; More...
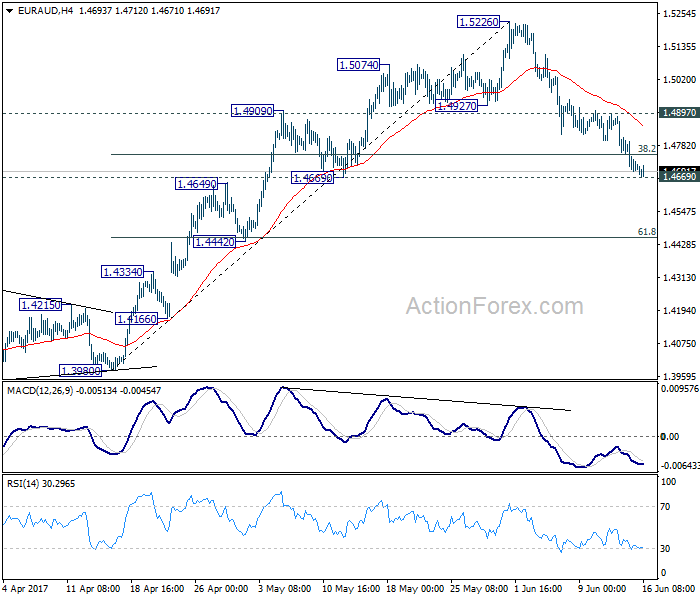
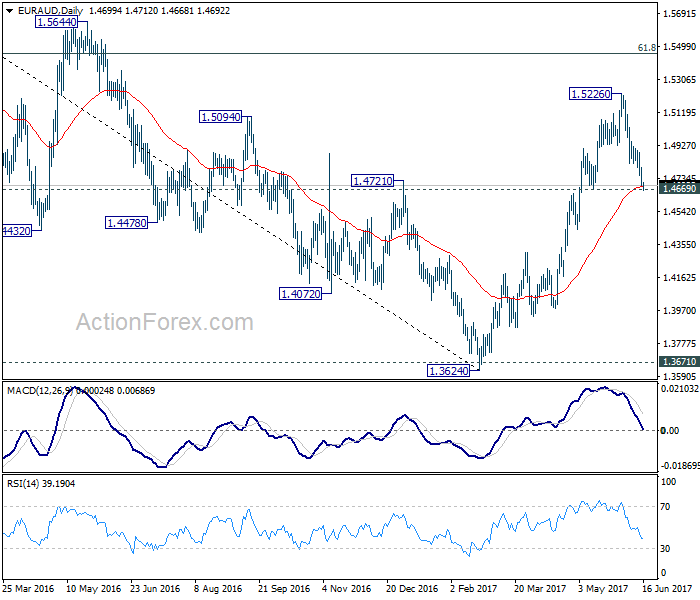
At this, we'd still expect strong support from 1.4669 close to 55 day EMA at 1.4685, to contain downside and bring rebound. Break of 1.4897 minor resistance will turn bias back to the upside for retesting 1.5226 high first. However, sustained break of 1.4669 will 1.4669 will argue that rise from 1.3642 is completed and bring deeper pull back to 55 week EMA (now at 1.4539) and below.
In the bigger picture, price actions from 1.6587 medium term top are viewed as a corrective pattern. Such correction should be completed at 1.3624 after defending 1.3671 key support. Rise from 1.3642 is now expected to target 61.8% retracement of 1.6587 to 1.3624 at 1.5455. Sustained break there will pave the way to retest 1.6587. In any case, outlook will now stay cautiously bullish as long as 1.4669 support holds. Break of 1.4669 will dampen the bullish view and would at least bring deeper fall back to 55 week EMA (now at 1.4539).
USD Keeps Gains. BoJ Decision In Focus
The US dollar continued to post strong gains for the second day after the FOMC meeting. Despite weakening initially, the US dollar managed to close higher into the day. On the economic front, the SNB and BoE held their monetary policy meetings. For the BoE, it was a surprise as the MPC vote decision was 5 - 3. The news briefly sent the GBP higher before closing flat. The SNB's meeting was largely a non-event.
Looking ahead, the Bank of Japan will be meeting shortly for its monetary policy decision. No major changes are expected from the BoJ. The interest rates are expected to remain steady. BoJf Governor Kuroda will be holding a press conference shortly.
EURUSD intraday analysis
EURUSD (1.1145): EURUSD closed bearish yesterday with price action expected to continue to decline. The technical support level at 1.1171 was breached yesterday, and this suggests further downside in price. EURUSD could be expected to continue to slip towards 1.1018 - 1.0995 support level over the medium term. On the daily chart, there is potential for a short-term retracement to occur. This could see EURUSD retesting 1.1171 price level where the broken support could turn to resistance in the near term. The bias shifts to the upside only on a close above this level.
GBPUSD intraday analysis
GBPUSD (1.2771): GBPUSD closed flat yesterday following the BoE's surprise vote split. However, the gains are likely to be limited in the near term with the current decline looking to retest the resistance level of the broken neckline support of the head and shoulders pattern. The overall bias remains to the downside although this could change considering the strong consolidation taking place near this level. As long as GBPUSD stays below 1.2800, there is scope for price to push lower and complete the head and shoulders pattern.
USDJPY intraday analysis
USDJPY (111.22): USDJPY has managed to post a strong recovery with price action breaking past the previous resistance level at 110.52. USDJPY is now seen extending the gains towards 112.00 - 111.70 resistance level. Any dips towards 110.52 will be a good buying opportunity for the market. Further gains can come only above 112.00, but it is unlikely that USDJPY will push higher. For the most part, expect some consolidation within 111.70 - 110.52.
Currencies: Post-Fed USD Rebound To Slow?
Sunrise Market Commentary
- Rates: Core bonds sharply lower
Various factors contributed to a sharp correction lower of core bonds. Is this the beginning of a countertrend? We hope it is, but more evidence is needed. - Currencies: Post-Fed USD rebound to slow?
Yesterday, the dollar rebounded as US shorts were squeezed. The Fed was less soft than expected. Remarkably , the EUR/USD declined occurred as interest rate differentials developed in favour of the euro. We don't expect this process to continue. Some EUR/USD consolidation might be on the cards. The post-BoE rally of sterling might also slow.
The Sunrise Headlines
- Emmanuel Macron is set to crush the mainstream parties in Sunday's second round of polling. The French president's party is projected to win as many as 470 of 577 seats in the lower house, according to recent polls.
- Greece's creditors agreed to release 8.5 billion euros in new loans for Athens, ending months of uncertainty on whether Greece could meet large bond payments due in July. They did, however, postpone the decision on debt relief to mid-2018 and there is no deal yet on financial participation by the IMF.
- The BOJ decided to keep its monetary policy unchanged as inflation in Japan is still far away from the 2% inflation target. It will continue to manage the yield curve through a negative interest rate and buying trillions of yen bonds.
- Theresa May's Conservatives have reached broad agreement with Democratic Unionists on a program for governing the UK, buying the prime minister crucial time as she seeks to finalize a longer-term agreement with the DUP.
- The yen lost ground after the BOJ decision, spurring advances in Japanese and other Asian stocks. The FTSE 100 and S&P 500 futures pointed slightly higher. The dollar and pound were steady while 10-year Treasury yields edged higher.
- Brent crude held losses, trading near a seven-month low (support).
- Today's eco calendar is light today with EMU consumer inflation (final figure), US housing starts and permits and the University of Michigan sentiment indicator coming out. A policy meeting is scheduled for the Bank of Russia and Kaplan (Fed) will speak in Dallas.
Currencies: Post-Fed USD Rebound To Slow?
USD/JPY rebounds north of 111 post FED/BOJ
Yesterday, some further USD short-covering occurred as the Fed intends to extend policy normalisation. EUR/USD dropped further to the 1.1150 area, even as interest rate differentials narrowed against the dollar. USD/JPY also rebounded despite a correction in equities. EUR/USD finished the session at 1.1145. USD/JPY closed the day at 110.93.
Overnight Asian equities are trading mixed. Japanese equities outperform as they profit from yesterday's rebound of USD/JPY. The rebound continues this morning. USD/JPY trades in the 111.25 area. The BOJ left its policy unchanged as expected. The Bank was slightly more upbeat on consumption and the global economic context. The debate on how to prepare a potential exit is gradually starting, but BOJ's Kuroda will probably indicate at the press conference later today that no policy change is imminent. Even so, he might face tough questions on this issue. The dollar maintains yesterday's gains against the euro. EUR/USD hovers in the mid 1.1150's.
Today, the focus is on the US data. The US housing starts and permits are expected to have rebounded in May after some correction in March and April for starts and April for permits. The indices may be topping out after reaching peak values some months ago, but we don't expect a sustained downtrend yet. US Michigan consumer sentiment is expected to have stabilized in June, but we see upside risks. Markets will look also to the inflation sub-indices that have fallen in recent months. In particular the Michigan consumer confidence has market moving potential in case of a big deviation from consensus.
The key question is whether yesterday's post-Fed repositioning will continue. We assume that the EUR/USD decline might slow, at least temporarily. Yesterday interest rate differentials narrowed in favour of the euro, but the single currency lost against an overall strong dollar. This kind of development probably won't go on forever. That said, the topside in EUR/USD looks better protected. So a cautious sell-on upticks approach is preferred in the post-Fed era. USD/JPY also rebounded nicely yesterday. A positive equity sentiment might protect the USD/JPY downside, but we are still not convinced of a sustained rebound.
Technical picture
The USD/JPY rally ran into resistance in early May. A mini sell-off pushed the pair below the previous top (112.20), making the short-term picture negative and driving the pair further down in the 108.13/114.37 range. The post-Fed USD rebound pushed the pair beyond a firs minor resistance at 110.81. If confirmed, it might be an indication that USD/.JPY downside momentum is easing. For now, were remain cautious to preposition for a real U-turn yet.
Early May, EUR/USD failed to break below the 1.0821/1.0778 support (gap). Poor US data and US political upheaval propelled EUR/USD north of the 1.1023 range top to a corrective in the 1.12 area. The pair tested the 1.1300 area going into the FOMC decision, but the test is rejected. So the Trump top/correction top at 1.1300/1.1366 proved to be a solid resistance. USD sentiment will have be very negative to clear this hurdle. A return below 1.1023 would indicate that the upside momentum has eased.
EUR/USD: test off 1.1300/66 resistance rejected. EUR/USD returns lower in the established trading range
EUR/GBP
Sterling receives unexpected BoE support, but…
Yesterday, the BoE kept its policy unchanged as expected. However, only five members supported the majority view. Three members unexpectedly voted in favour of a rate hike as the BOE expects inflation to move beyond 3% in Autumn and as inflation is expected to stay above target for a prolonged period of time. EUR/GBP dropped from just below 0.88 to the 0.8725 area and closed the session at 0.8737. Cable jumped from 1.27 to just below 1.28, but eased again later as the dollar was also well bid. The pair finished the session at 1.2758.
There are no important eco data in the UK. Markets will still ponder the impact of yesterday's BoE vote. The BoE support for a rate hike was a surprise, but we maintain the view that the BoE will remain cautious to raise rates as political and economic uncertainty remains elevated. The focus will again turn to the formation of a new government and to the start of the Brexit negotiations. We don't expect the political uncertainty to have an overwhelming negative impact on sterling today. Even so, it might be enough to slow the positive sterling momentum after yesterday's BoE decision.
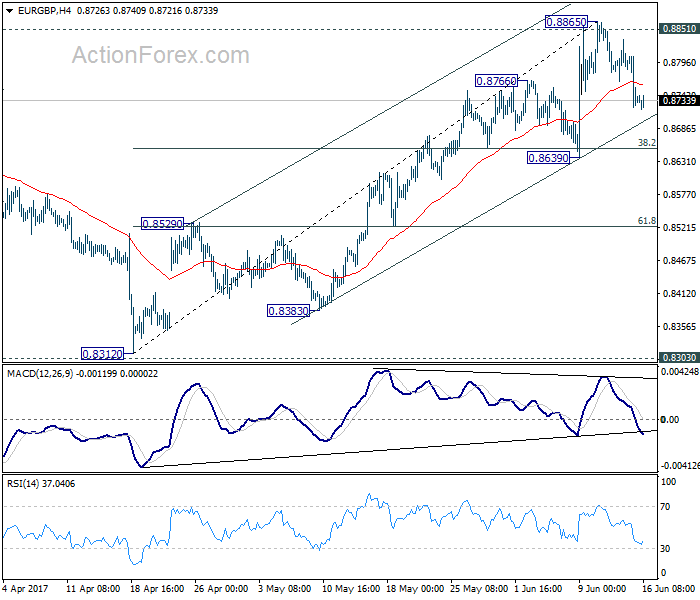
From a technical point of view, EUR/GBP extensively tested the 0.8854 area (2017 top), but a real break didn't occur. Some consolidation might be on the cards after yesterday's EUR/GBP correction. However, the broader technical picture hasn't changed. A return below the 0.8655 correction low would be an indication that the pressure on sterling is easing. We expected such a break to be difficult. A EUR/GBP buy-on-dips approach is still favoured
EUR/GBP: correction of 2017 top accelerates after BoE vote
Trade Idea: GBP/USD – Hold short entered at 1.2750
GBP/USD – 1.2772
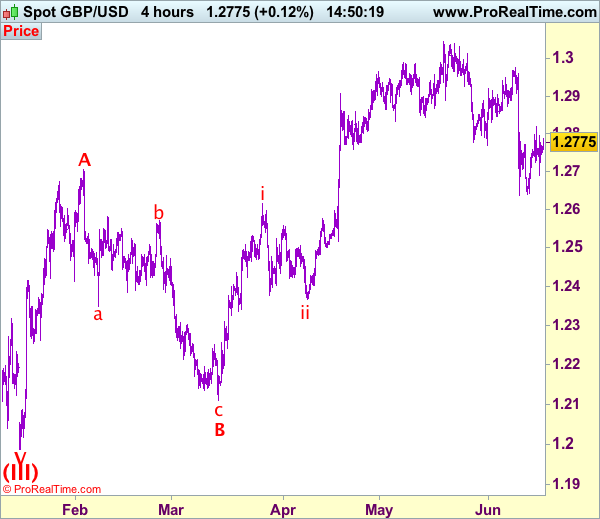
Recent wave: Wave V of larger degree wave (III) has ended at 1.1986 and major correction has commenced from there for gain to 1.3000 and 1.3140-50
Trend: Near term down
Original strategy :
Sold at 1.2750, Target: 1.2600, Stop: 1.2810
Position: - Short at 1.2750
Target: - 1.2600
Stop: - 1.2810
New strategy :
Hold short entered at 1.2750, Target: 1.2600, Stop: 1.2810
Position: - Short at 1.2750
Target: - 1.2600
Stop:- 1.2810
As sterling found support at 1.2690 yesterday and has rebounded, suggesting further consolidation would be seen, however, as long as resistance at 1.2818 holds, bearishness remains for another decline, below said support at 1.2690 would add credence to our view that the rebound from 1.2635 has ended at 1.2818, bring weakness towards said support at 1.2635 but break there is needed to confirm recent decline from 1.3048 top has resumed for retracement of recent upmove to 1.2600, having said that, downside should be limited to 1.2550 and reckon previous support at 1.2515 would hold.
Our preferred count on the daily chart is that cable's rebound from 1.3500 (wave (A) trough) is unfolding as a wave (B) with A ended at 1.7043, followed by triangle wave B and wave C as well as wave (B) has ended at 1.7192, the subsequent selloff is the larger degree wave (C) which is still unfolding with minor wave (III) of larger degree wave 3 ended at 1.1986, hence wave (IV) correction is in progress which could either be a triangle wave (IV) of a complex formation but upside should be limited to 1.3500 and price should falter well below 1.4000, bring another decline in wave (V) of 3 for weakness to 1.1500, then 1.1200.
On the upside, expect recovery to be limited to 1.2790-00 and bring another decline. Only above said resistance at 1.2818 would defer and risk a stronger rebound to 1.2860-70 would but price should falter below 1.2900, bring another selloff later.
Trade Idea: GBP/JPY – Stand aside
GBP/JPY - 142.00
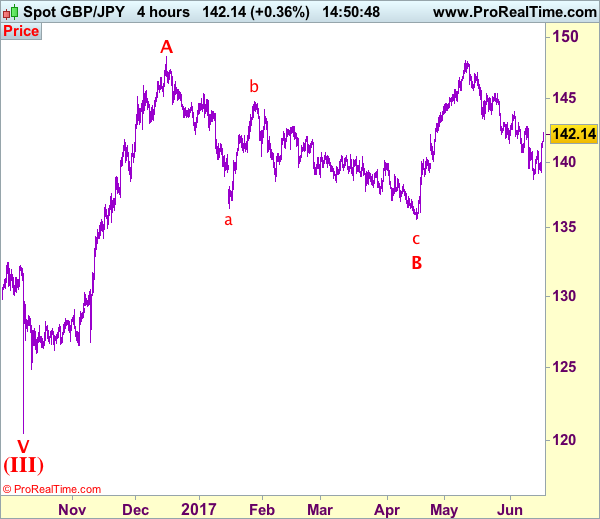
Recent wave: Medium term low formed at 120.50 and (A)-(B)-(C) major correction has commenced with (A) leg ended at 148.45, hence wave (B) is unfolding for retreat to 131.00-10.
Trend: Near term down
Original strategy:
Sold at 140.40, stopped at 141.00
Position: - Short at 140.40
Target: -
Stop: - 141.00
New strategy :
Stand aside
Position: -
Target: -
Stop:-
Sterling’s rebound from 138.70 turned out to be stronger than expected, suggesting low has been formed there and consolidation with mild upside bias is seen for test of resistance at 142.75, however, break there is needed to add credence to this view, bring retracement of recent selloff to 143.05-10, then 143.50-60 but near term overbought condition should limit upside to resistance at 143.95-00.
In view of this, would not chase this rise here and would be prudent to stand aside for now. Below 141.40-50 would bring test of previous resistance at 140.90 but break of latter level is needed to signal the rebound from 138.70 has possibly ended, bring further fall to 140.50, then 140.15-20 which is likely to hold from here.
Our preferred count is that larger degree wave V with circle is unfolding from 251.12 with wave (I) 219.34, (II): 241.38 and wave (III) is subdivided into 1: 192.60, 2: 215.89 (23 Jul 2008) and wave 3 ended at 118.87 earlier in 2009. The correction from there to 162.60 is wave 4 which itself is a double three and is labeled as first a-b-c ended at 151.53, followed by wave x at 139.03, 2nd a ended at 162.60, 2nd b at 146.75 and 2nd c leg of wave 4 ended at 163.00. Therefore, the decline from 163.00 to 116.85 is now treated as wave 5 which also marked the end of larger degree wave (III), hence wave (IV) major correction has commenced for retracement of the wave (III) from 241.38 and upside target at 183.95-00 (50% Fibonacci retracement of the wave (II) from 241.38) had been met, a drop below 160.00 would suggest wave (IV) has ended at 195.85, bring decline in wave (V) for initial weakness to 130 (already met) and 120.
EUR/JPY Elliott Wave Analysis
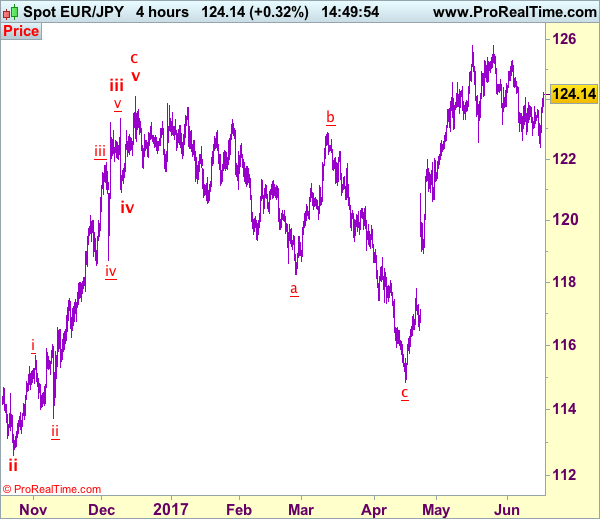
EUR/JPY - 123.57
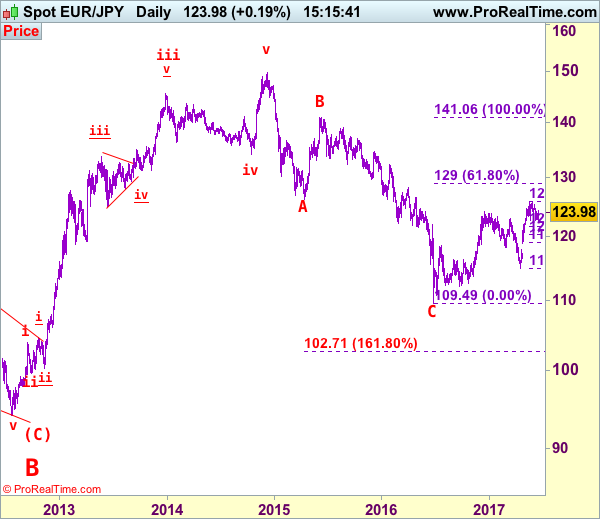
EUR/JPY: Wave v as well as larger degree wave (C) ended at 94.11 and first leg of larger degree wave C upmove has possibly ended at 149.79 and wave 2 correction has possibly ended at 109.49.
Although the single currency broke below previous support at 122.56-63, lack of follow through selling and current rebound to 122.40 suggest consolidation would be seen, however, a daily close above resistance at 124.04 is needed to signal low is formed, bring a stronger rebound to 124.60-70, then towards resistance at 125.31. Looking ahead, only break of 125.31 would confirm the pullback from 125.82 has ended, bring retest of this recent high, break there would confirm recent upmove from 109.49 low has resumed and extend gain to resistance at 126.47 and possibly 127.50-60, however, reckon upside would be limited to 128.17 resistance and price should falter well below 129.00 (61.8% Fibonacci retracement of 141.06-109.49).
The daily chart is labeled as attached, early selloff from 169.97 (July 2008) to 112.08 is wave (A) of B instead of end of entire wave B and then the rebound from there to 139.26 is wave (B), hence, wave (C) has possibly ended at 94.12 with a diagonal triangle as labeled in the daily chart, hence upside bias is seen for further gain. Recent rally above indicated retracement level at 116.69 (50% Fibonacci retracement of the intermediate fall from 139.26-94.12) adds credence to this view and signal major reversal has commenced but first leg of this wave C has possibly ended at 149.79, hence wave 2 has commenced with wave A ended at 126.09, followed by wave B at 141.06, wave C commenced and could have ended at 109.49, above 125.00 would add credence to this view.
On the downside, if said resistance at 124.04 continues to hold, then downside risk remains for another corrective fall to 122.40, then 122.00-10, however, reckon downside would be limited and 121.60-65 (38.2% Fibonacci retracement of 114.85-125.82) and bring another rise later. A daily close below 121.60-65 would defer and suggest top is formed instead, risk correction to 121.00 and possibly towards support at 120.60 but reckon 120.30-35 (50% Fibonacci retracement) would limit downside and psychological level at 120.00 should hold.
Recommendation: Buy at 121.60 for 124.50 with stop below 120.60.
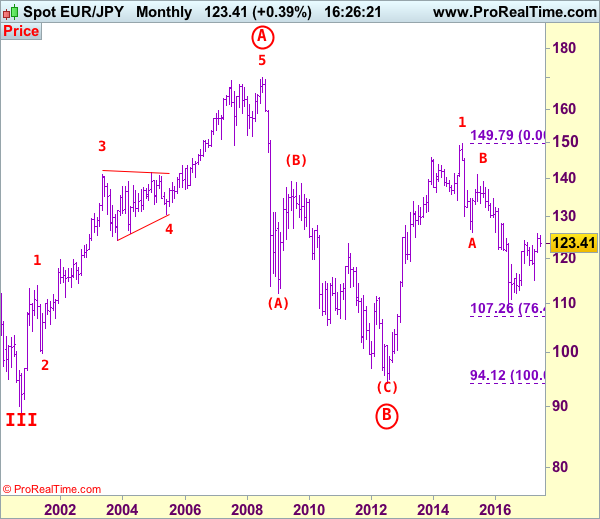
To re-cap the corrective upmove from the record low of 88.93 (18 Oct 2000), the wave A from there is subdivided as: 1:88.93-113.72, 2:99.88 (1 Jun 2001), 3:140.91 (30 May 2003), 4:124.17 (10 Nov 2003) and 5 ended at record high of 169.97 (21 Jul 2008). The brief but sharp selloff to 112.08 is viewed as a-b-c x a-b-c wave (A) of B. The subsequent rebound to 139.26 is (B) of B and (C) of (B) has possibly ended at 94.12 and in any case price should stay well above previous chart support at 88.93, bring rally in larger degree wave C towards 150.00.
USD/CHF Elliott Wave Analysis
USD/CHF – 0.9745
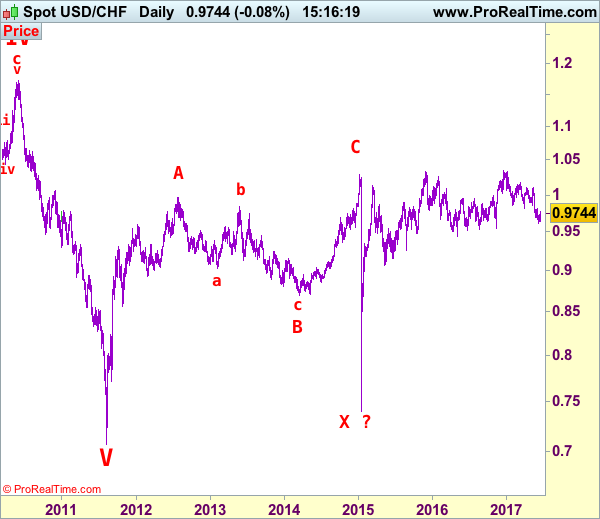
USD/CHF – Wave IV ended at 1.1730 and wave V has possibly ended at 0.7068
Although the greenback retreated to 0.9641, renewed buying interest emerged there and dollar has rebounded again after Fed’s rate hike, suggesting a temporary low has possibly been formed at 0.9613 earlier this month, hence consolidation above this level would be seen with mild upside bias for test of resistance at 0.9808-13, however, a daily close above this level is needed to add credence to this view, bring retracement of recent decline to 0.9855-60, then towards 0.9900. Having said that, near term overbought condition should limit upside and price should falter well below psychological resistance at 1.0000, bring another decline later.
Our preferred count on the daily chart is that early selloff to 0.9630 is an end of the larger degree wave III and major correction is unfolding from there with a leg ended at 1.2298 (Nov 2008 with (a): 1.0625, (b):1.0011 and (c):1.2298), wave b ended at 0.9910 with (a): 1.0370, (b): 1.1967, (c): 0.9910. The rise from there to 1.1730 is the wave c which also marked the end of wave IV and wave V has possibly ended at 0.7068.
On the downside, expect pullback to be limited to 0.9700 and bring another rebound. Below this week’s low at 0.9641 would risk another test of this month’s low at 0.9613 but break there is needed to revive bearishness and signal the decline from 1.0344 top has resumed for further weakness to 0.9600, then towards previous chart support at 0.9550 (Nov 2016 low), however, still reckon downside would be limited and price should stay well above another chart point at 0.9444 (2016 low)..
Recommendation: Exit short entered at 0.9800 and turn long at 0.9700 for 0.9900 with stop below 0.9600
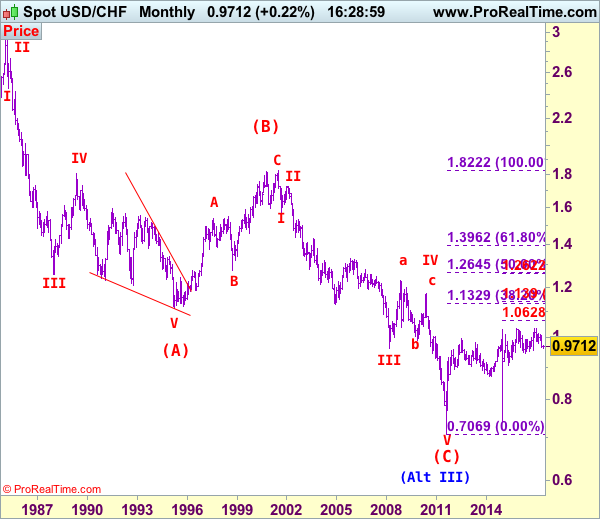
Dollar's long-term downtrend started from 2.9343 (Feb 1995) and it was unfolding as a (A)-(B)-(C) with (A): 1.1100, (B): 1.8310 (26 Oct 2000), then followed by another impulsive wave (C) with wave III ended at 0.9630 (Mar 2008). Under this count, correction in wave IV has possibly ended at 1.1730 and wave V already broke below support at 0.9630 and met indicated downside target at 0.7500 and 0.7400. The reversal from 0.7068 suggests the wave V has possibly ended and the breach of resistance at 0.9595 add credence to this view and indicated upside target at 1.0000 had been met, however, the sharp retreat from 1.0296 to 0.7401 suggests choppy trading would be seen but price should stay above said record low at 0.7068.
EUR/GBP Daily Outlook
Daily Pivots: (S1) 0.8704; (P) 0.8755; (R1) 0.8788; More...
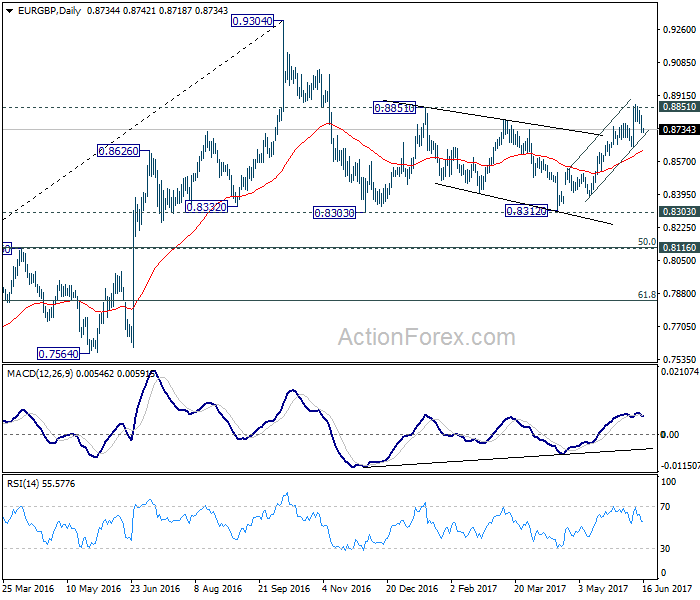
EUR/GBP's retreat from 0.8865 extended lower but it's holding above 0.8639 support so far. Intraday bias remains neutral first. We'd still expect strong support from 0.8639 to contain downside and bring rise resumption. Decisive break of 0.8851 resistance will pave the way to retest 0.9304 high. However, break of 0.8639 support will now indicate near term topping and bring deeper pull back 0.8529 resistance turned support and below.
In the bigger picture, price actions from 0.9304 are viewed as a medium term corrective pattern. The leg from 0.9304 should have completed after testing 0.8332 structural support. But it's too early to say that larger rise from 0.6935 is resuming. Rejection from 0.9304 will extend the consolidation with another falling leg. Meanwhile, firm break of 0.9304 will target 0.9799 (2008 high). In case of another decline, we'd expect strong support from 0.8116 cluster support (50% retracement of 0.6935 to 0.9304 at 0.8120) to contain downside and bring rebound.
Yen Stays Pressured after BoJ Stands Pat, Dollar and Sterling Lack Follow Through Buying
BoJ left monetary policies unchanged today as widely expected. Benchmark interest is kept at -0.1%. Meanwhile, under the yield curve control framework, the central bank continues to target 10 year JGB yield at around 0%. Annual pace of asset purchase is held at JPY 80T. Locally, BoJ noted that "private consumption has shown increased resilience against a background of steady improvement in the employment and income situation". Globally, BoJ said that overseas economies were "continuing to grow at a moderate pace as a whole". Overall tone in the central's statement was slightly more upbeat than the previous one.
The Japanese yen is trading as the weakest major currency for the week. It's partly due to talk of an exit in ultra-loose monetary policy globally. In particular, Fed maintained the forecast of a total of three hikes this year. Three BoE policy makers voted for a rate hike yesterday. Recovery in US treasury yield also lifted USD/JPY up. 10 year yield continues to try to draw support from 38.2% retracement of 1.336 to 2.621 at 2.130. It's still held below 2.229 resistance and maintains bearish outlook. But downside momentum is seen as diminishing as in daily MACD. The markets could finally make up their mind on reversal or not next week.
Both Dollar and Sterling firmed up mildly after respective central bank meeting. But they are overwhelmed by the strength in commodity currencies, in particular Canadian Dollar. Also it should be noted that both EUR/USD and EUR/GBP are holding above key near term support at 1.1109 and 0.8639 respectively. There is no confirmation of reversal in neither pair. Except versus the Japanese Yen, the Dollar and Sterling still have much to prove.
Talking about the Pound, the negotiation between UK and EU on Brexit is scheduled to start next Monday. It's reported that EU has already sent its positioning papers to London four days ago. And by now UK has yet to return an equivalent document. Prime Minister Theresa May's cabinet is still split over the approach on the negotiation, with grow voice to push for a softer Brexit.
On the data front, New Zealand business NZ manufacturing index rose to 58.5 in May. Eurozone May CPI final will be featured in European session. US housing starts and building permits, labor market conditions index, U of Michigan consumer sentiment will be featured.
EUR/GBP Daily Outlook
Daily Pivots: (S1) 0.8704; (P) 0.8755; (R1) 0.8788; More...
EUR/GBP's retreat from 0.8865 extended lower but it's holding above 0.8639 support so far. Intraday bias remains neutral first. We'd still expect strong support from 0.8639 to contain downside and bring rise resumption. Decisive break of 0.8851 resistance will pave the way to retest 0.9304 high. However, break of 0.8639 support will now indicate near term topping and bring deeper pull back 0.8529 resistance turned support and below.
In the bigger picture, price actions from 0.9304 are viewed as a medium term corrective pattern. The leg from 0.9304 should have completed after testing 0.8332 structural support. But it's too early to say that larger rise from 0.6935 is resuming. Rejection from 0.9304 will extend the consolidation with another falling leg. Meanwhile, firm break of 0.9304 will target 0.9799 (2008 high). In case of another decline, we'd expect strong support from 0.8116 cluster support (50% retracement of 0.6935 to 0.9304 at 0.8120) to contain downside and bring rebound.
Economic Indicators Update
| GMT | Ccy | Events | Actual | Forecast | Previous | Revised |
|---|---|---|---|---|---|---|
| JPY | Monetary Policy Statement | |||||
| 22:30 | NZD | Business NZ Manufacturing Index May | 58.5 | 56.8 | 56.9 | |
| 9:00 | EUR | Eurozone CPI M/M May | -0.10% | -0.10% | ||
| 9:00 | EUR | Eurozone CPI Y/Y May F | 1.40% | 1.40% | ||
| 9:00 | EUR | Eurozone CPI - Core Y/Y May F | 0.90% | 0.90% | ||
| 12:30 | CAD | International Securities Transactions (CAD) Apr | 12.14B | 15.13B | ||
| 12:30 | USD | Housing Starts May | 1.21M | 1.17M | ||
| 12:30 | USD | Building Permits May | 1.25M | 1.23M | ||
| 14:00 | USD | Labor Market Conditions Index | 3 | 3.5 | ||
| 14:00 | USD | U. of Michigan Confidence (JUN P) | 97.3 | 97.1 |
Trade Idea: EUR/JPY – Buy at 123.40
EUR/JPY - 124.10
Recent wave: wave v of (C) ended at 94.12 and major correction in wave A has ended at 149.79
Trend: Near term up
New strategy :
Buy art 123.40, Target: 125.30, Stop: 122.80
Position: -
Target: -
Stop:-
As the single currency found good support at 122.40 and has staged a strong rebound above resistance at 124.04, signaling low has been formed there and consolidation with upside bias is seen for this rebound to bring at least a strong retracement of recent decline, hence further gain to 124.70-75, then 125.00 would be seen, however, break of resistance at 125.31 is needed to retain bullishness and suggest the correction from 125.82 has ended, bring eventual retest of this level later this month.
In view of this, we are looking to buy euro on dips as 123.40-50 should limit downside and bring another rebound later. Below 122.90-00 would defer and risk another fall to said support at 122.40 but only break there would signal the erratic decline from 125.82 top is still in progress for correction of early upmove to 122.00, then 121.70-75.
Our latest preferred count is that wave (ii) is ABC-X-ABC which ended at 123.33 and wave (iii) is unfolding with wave iii ended at 100.77, followed by wave iv at 111.57 and wave v as well as the wave (iii) has ended at 97.04, followed by wave (iv) at 111.43 and wave (v) has ended at 94.12 which is also the end of the larger degree v, this also implied the major wave (C) has also ended there, hence major correction has commenced from there with (A) leg unfolding in its lower degree wave c which has possibly ended at 145.69. Under this count, A-B-C wave (B) has commenced with A leg ended at 136.23, wave B at 143.79 and wave C has possibly ended at 149.79.
Our larger degree count is that the decline from 139.26 is wave (C) and is sub-divided into a diagonal triangle i-ii-iii-iv-v with wave i - 105.44, wave ii- 123.33, wave iii - 97.03, wave iv - 111.43, followed by the final wave v as well as the end of wave (C) at 94.12, this also mark the bottom of larger degree wave B. Under this count, major rise in wave C has commenced as an impulsive wave with minor wave III ended at 145.69, wave V is still in progress for further gain to 150.00. Having said that, this so-called wave V could well be the first leg of larger degree 5-waver wave C and this wave C should bring at least a retest of wave A top at 169.97 (July 2008).