Sample Category Title
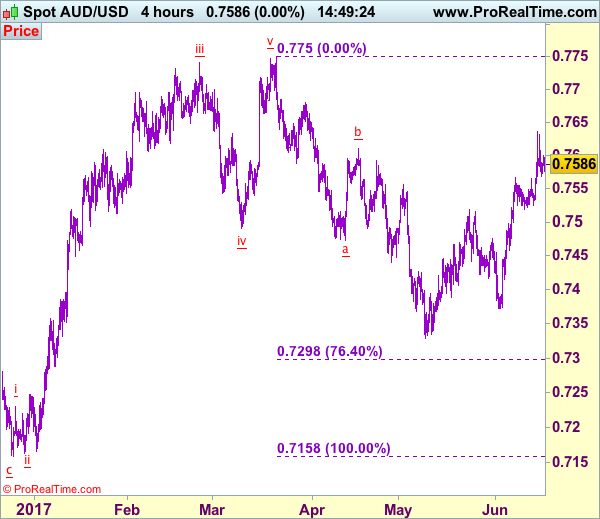
Trade Idea: AUD/USD – Buy at 0.7525
AUD/USD – 0.7587
Recent wave: Wave 5 ended at 1.1081 and major correction has commenced for fall to 0.7000 and then towards 0.6500-10
Trend: Near term up
Original strategy :
Buy at 0.7525, Target: 0.7670, Stop: 0.7465
Position: -
Target: -
Stop: -
New strategy :
Buy at 0.7525, Target: 0.7670, Stop: 0.7465
Position: -
Target: -
Stop:-
As the Australian dollar has retreated after meeting resistance at 0.7636 earlier this week, suggesting consolidation below this level would be seen and pullback t0 0.7550-60 cannot be ruled out, however, reckon support at 0.7524 would limit downside and bring another rise later, above said resistance at 0.7636 would extend recent upmove from 0.7329 towards resistance at 0.7680 but loss of momentum should limit upside and price should falter below chart point at 0.7750.
In view of this, we are looking to buy aussie on dips as 0.7520-25 should limit downside and bring another rise. Only below support at 0.7457 would abort and suggest top is possibly formed, bring weakness to 0.7415-20 but price should stay well above key support at 0.7372, bring another rebound later.
On the 4-hour chart, the move from 0.8066 is the wave 5 with i: 0.8860, ii: 0.8315, wave iii is an extended move ended at 1.0183, iv: 0.9706 and wave v has ended at 1.1081 (also the top of entire wave 5). The subsequent selloff is the major correction which is unfolding as ABC-X-ABC and 2nd A leg has ended at 0.8848, followed by a-b-c wave B which ended at 0.9758, hence, 2nd C wave is now in progress and indicated downside target at 0.7000 and 0.6950 had been met, so further fall to 0.6710-20 cannot be ruled out.
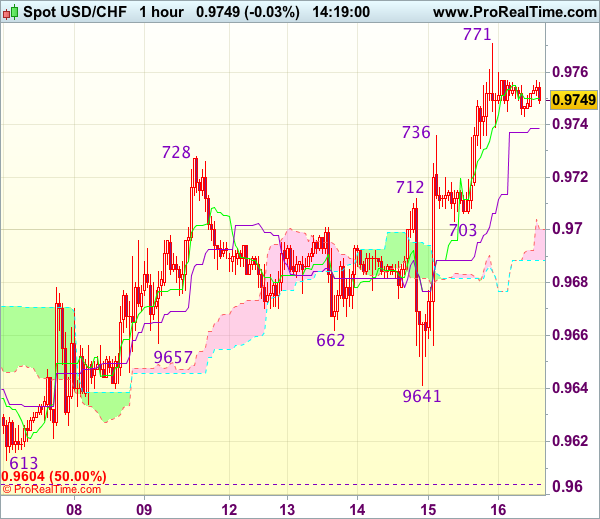
Trade Idea : USD/CHF – Buy at 0.9705
USD/CHF - 0.9748
Most recent candlesticks pattern : N/A
Trend : Near term up
Tenkan-Sen level : 0.9749
Kijun-Sen level : 0.9739
Ichimoku cloud top : 0.9700
Ichimoku cloud bottom : 0.9689
Original strategy :
Buy at 0.9705, Target: 0.9805, Stop: 0.9670
Position : -
Target : -
Stop : -
New strategy :
Buy at 0.9705, Target: 0.9805, Stop: 0.9670
Position : -
Target : -
Stop : -
As the greenback has eased after surging to 0.9771 yesterday, suggesting minor consolidation below this level would be seen and pullback to 0.9720 cannot be ruled out, however, reckon support at 0.9703 would limit downside and bring another rise later, above said resistance at 0.9771 would extend recent rise from 0.9613 low to resistance at 0.9808, however, reckon previous resistance at 0.9825 would hold from here due to near term overbought condition, bring retreat later.
In view of this, we re looking to buy dollar on pullback as 0.9700-05 should limit downside. Below 0.9680 would defer and risk weakness towards said support at 0.9641 but only break there would abort and revive bearishness, this would also suggest the rebound from 0.9613 has ended instead, bring retest of this level later.
Forex Technical Analysis: EUR/USD, USD/JPY, GBP/USD
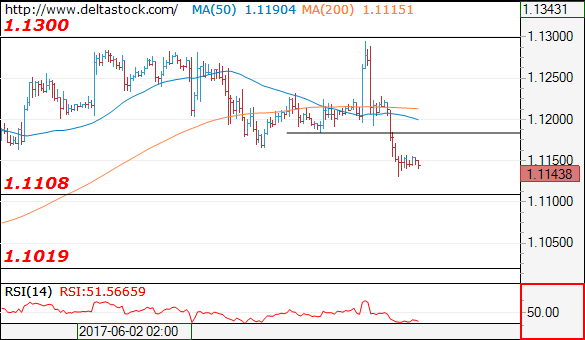
EUR/USD
Current level - 1.1143
The outlook here is bearish below 1.1180 intraday resistance, for a slide towards 1.1108 low, en route to 1.1020 major support.
| Resistance | Support | ||
| intraday | intraweek | intraday | intraweek |
| 1.1180 | 1.1360 | 1.1108 | 1.1022 |
| 1.1300 | 1.1610 | 1.1020 | 1.0838 |
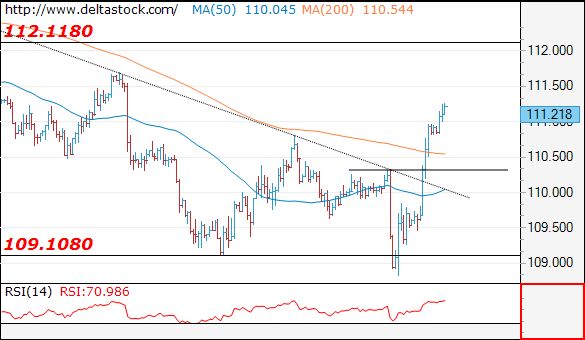
USD/JPY
Current level - 111.28
Yesterday's break through 110.35 confirms a reversal of the whole slide from 114.35 and the bias is positive, for a rise towards 112.10 area. Initial support lies at 110.80, followed by 110.35.
| Resistance | Support | ||
| intraday | intraweek | intraday | intraweek |
| 111.70 | 112.10 | 110.80 | 109.08 |
| 112.10 | 114.30 | 110.20 | 108.12 |
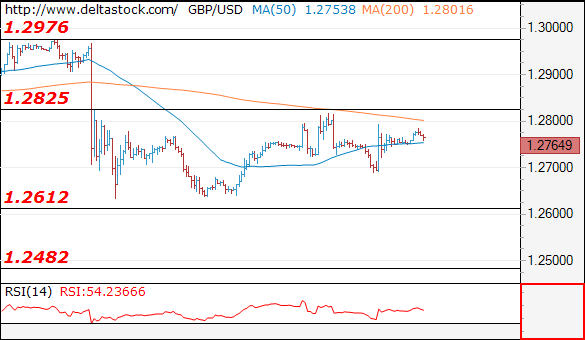
GBP/USD
Current level - 1.2746
The outlook remains bearish below 1.2825 resistance area, for a slide towards 1.2610 zone.
| Resistance | Support | ||
| intraday | intraweek | intraday | intraweek |
| 1.2830 | 1.2970 | 1.2685 | 1.2610 |
| 1.2880 | 1.3050 | 1.2610 | 1.2480 |
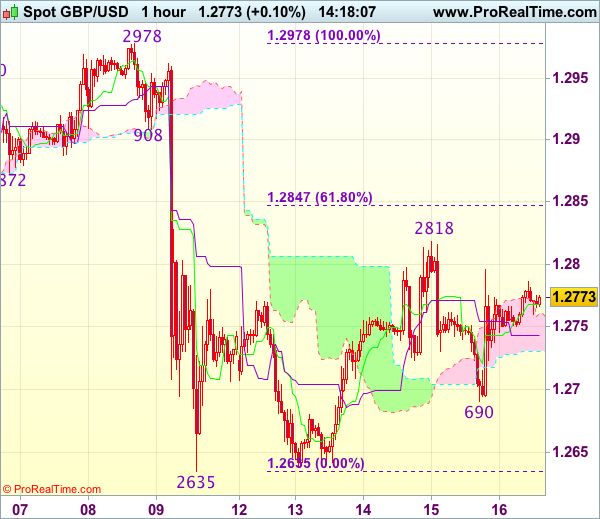
Trade Idea : GBP/USD – Hold short entered at 1.2790
GBP/USD - 1.2777
Most recent candlesticks pattern : N/A
Trend : Near term down
Tenkan-Sen level : 1.2768
Kijun-Sen level : 1.2743
Ichimoku cloud top : 1.2761
Ichimoku cloud bottom : 1.2730
Original strategy :
Sold at 1.2790, Target: 1.2690, Stop: 1.2800
Position : - Short at 1.2790
Target : - 1.2690
Stop : - 1.2800
New strategy :
Hold short entered at 1.2790, Target: 1.2690, Stop: 1.2800
Position : - Short at 1.2790
Target : - 1.2690
Stop : - 1.2800
Although the British pound retreated from 1.2818 to yesterday’s low at 1.2690, the subsequent rebound suggests consolidation would be seen, however, as long as 1.2795-00 holds, mild downside bias remains for another fall to 1.2680-90, break there would retain bearishness and signal the rebound from 1.2635 has ended, bring further fall to 1.2650, then towards said support at 1.2635.
In view of this, we are holding on to our short position entered at 1.2790. Only above said resistance at 1.2818 would defer and risk a strong rebound to 1.2845-50 (61.8% Fibonacci retracement of 1.2978-1.2635) but upside should be limited to 1.2870-80.
USDCAD Prepares For A Retest Of The Trend Line
Key Points:
- Price action collapses below bullish trend line.
- RSI Oscillator strongly oversold.
- ABCD pattern completes and retest of the trend line is likely in the coming session.
The USDCAD has benefitted from a strong trend line that has been supporting price action since early January, 2017. Subsequently, the trend line has proved fairly reliable in trading long reversals but price action has proved elusive in the past week and dropped sharply through the trend line. However, the move was primarily fundamental in nature and some interesting technical factors might be just about to signal a retest.
In fact, the primary reason for the recent decline was a fundamental response to a shock announcement from the Bank of Canada that they intend to review their current level of stimulus with a desire to taper. Although this provides some useful forward guidance for the market, it fails to provide either a timeline or the extent to which the central bank intends to taper their QE. Subsequently, the initial sharp decline is likely to be short term and reactionary rather than a medium term change to the equilibrium between the two currencies. In comparison, the U.S. Federal Reserve has largely communicated a time line of rate hikes and their desire to taper which is likely to only see upward momentum for the pair.
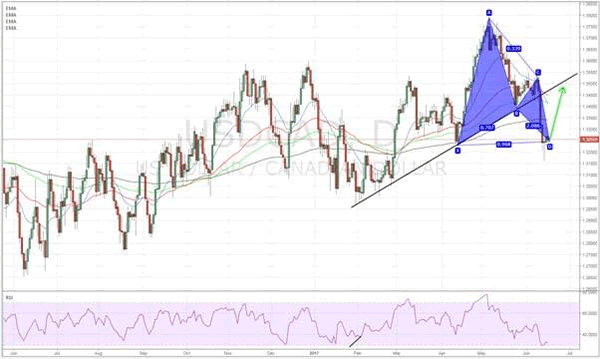
A quick technical analysis of the Loonie largely demonstrates the above factors with price actions collapse below the medium term bullish trend line. However, it's clear that the RSI Oscillator is currently strongly within oversold territory which suggests that, at the least, a mean reversion is likely to occur. Additionally, an ABCD pattern appears to have just completed which should see price action rising back towards the trend line, around the 1.3500 handle, over the next few sessions.
Ultimately, the stage is now set for a textbook rally and retest of the trend line, especially given the completion of the ABCD pattern. Subsequently, the scenario which I strongly favour, both fundamentally and technically, is a short period of sideways moderation before an upside break towards the trend line at 1.3500. At that point, it's likely that price action will run into some resistance around the 1.3535 mark and a momentum stall could occur. However, given the technical and rising gap between the U.S. and Canadian economies (Canada faces a potential property crash and falling oil prices) this level of depressed valuation is only going to last for a short period of time.
Market Update – Asian Session: BOJ On Hold With Unchanged JGB Purchase Amount Target And Economic Assessment
US Session Highlights
(US) JUN EMPIRE MANUFACTURING: 19.8 V 5.0E; new orders: +18.1 v -4.4 prior
(US) JUN PHILADELPHIA FED BUSINESS OUTLOOK: 27.6 V 24.9E
(US) MAY IMPORT PRICE INDEX M/M: -0.3% V -0.1%E; Y/Y: 2.1% V 2.9%
(US) INITIAL JOBLESS CLAIMS: 237K V 241KE; CONTINUING CLAIMS: 1.94M V 1.92ME
(US) JUN NAHB HOUSING MARKET INDEX: 67 V 70E
(US) MAY INDUSTRIAL PRODUCTION M/M: 0.0% V 0.2%E; CAPACITY UTILIZATION: 76.6% V 76.8%E
The recent sell-off in tech stocks continued today, dragging the broader market lower. The morning saw most stock markets open down on the day as concerns about Pres Trump's ongoing investigations and more likely Fed hikes to come sank in. After economic data releases, investors gained more confidence, sending most indices higher, but just lower than yesterday's close.
US markets on close: Dow -0.1%, S&P500 -0.2%, Nasdaq -0.5%
Best Sector in S&P500: Utilities
Worst Sector in S&P500: Materials
Biggest gainers: FTR +3.2%; HRB +3.0%; HOG +2.9%
Biggest losers: KR -18.9%; NUE -7.6%; WFM -6.7%
At the close: VIX 10.9 (+0.3pts); Treasuries: 2-yr 1.36% (flat), 10-yr 2.16% (+2bps), 30-yr 2.78% (flat)
US movers afterhours
HOS: Announces new credit facility; +22.8% afterhours
FNSR: Reports Q4 $0.52 v $0.50e, R$358M v $362Me; +7.8% afterhours
BAH: Discloses civil and criminal investigation by Dept of Justice into cost accounting practices - filing; -13.3% afterhours
STLD: Guides Q2 $0.60-0.64 v $0.84e, cites higher costs and lower value-added shipments on plant upgrade and certain quality issues
Politics
(US) Vice President Pence has reportedly hired outside counsel to assist with ongoing Russian investigation - Wash Post
(US) Special counsel Mueller said to probe business dealings of Jared Kushner as part of probe into Russia interference in elections - press
Key economic data
(JP) BOJ LEAVES INTEREST RATE ON EXCESS RESERVES (IOER) UNCHANGED AT -0.10%; AS EXPECTED; Keeps Economic Assessment unchanged
(NZ) NEW ZEALAND MAY BUSINESS MANUFACTURING PMI: 58.5 V 56.9 PRIOR (16-month high)
(CL) CHILE CENTRAL BANK (BCCH) LEAVES OVERNIGHT RATE TARGET UNCHANGED AT 2.50%; AS EXPECTED
Notes and Observations
Indices mixed as investors digest the widely anticipated FOMC rate hike yesterday, even as some analysts warn about the rising risks of "policy error" at the Fed on expectations of low inflation being transitory.
USD majors in narrow ranges; USD/JPY extending gains to 111.20, a 2-week high. BOJ lefts its policy settings unchanged with -0.1% IOER and 0.0% target for 10-yr JGB yield as part of YCC policy. BOJ maintained its overall economic assessment as "economy has been turning towards a moderate expansion" and raised its Consumption view to one of "increased resilience." No references to tapering plans are made, as speculated by local press earlier this month.
PBOC nearly doubled its reverse repo operations to CNY290B and set Yuan fix at 2-week low as part of policy response to the latest Fed decision.
Speakers and Press
China
(CN) China insurance regulator CIRC: Illegal sales of Hong Kong insurance products led to asset outflows and money laundering - press
(CN) China Iron and Steel Association (CISA): Iron ore prices are rational given the high inventories - press
(CN) China urged to closely monitor Fed's balance sheet plans - Chinese press
Japan
(JP) Japan Gov't Advisory Member Ito: Not surprising that BoJ bond purchases are dropping, central bank will purchase what's needed to keep yield near zero target
Korea
(KR) South Korea Vice Finance Min: June exports are expected to rise; Conditions may be difficult in H2 - press
(KR) South Korea Finance Minister: To use dialogue with China to hopefully ease row over THAAD
Asian Equity Indices/Futures (23:30ET)
Nikkei +0.5%, Hang Seng +0.4%, Shanghai Composite -0.2%, ASX200 +0.3%, Kospi -0.1%
Equity Futures: S&P500 +0.1%; Nasdaq +0.2%, Dax +0.2%, FTSE100 -0.1%
FX ranges/Commodities/Fixed Income (23:30ET)
EUR 1.1140-1.1155; JPY 110.85-111.25; AUD 0.7575-0.7600; NZD 0.7200-0.7215
Aug Gold flat at 1,254/oz; July Crude Oil flat at $44.45/brl; July Copper flat at $2.57/lb
SPDR Gold Trust ETF daily holdings fall 1.2 tonnes to 853.7 tonnes; 2nd straight decline
(CN) PBOC to inject combined CNY290B v CNY150B prior in 7-day, 14-day and 28-day reverse repos
(CN) PBOC SETS YUAN MID POINT AT 6.7995 V 6.7852 PRIOR; weakest Yuan fix since June 2nd
(CN) China MoF sells 30-yr bonds, avg yield 3.9763%, bid-to-cover 1.57x
(AU) Australia Finance Ministry (AOFM) sells A$800M in 2.25% 2028 bonds; avg yield 2.4988%; bid-to-cover 3.26x
Asia equities notable movers
Australia
A2 Milk (ATM.NZ) +7.9%; Raises FY17 Rev NZ$545M (prior NZ$525M)
AMP Ltd (AMP) +1.5%; considering sale of life insurance unit - Australia press
BHP (BHP) +0.1%; Mackenzie confirmed to succeed Nasser as Chairman
Japan
Shiseido (4911) +3.3%; Raised at Goldman Sachs
Toshiba (6502) +1.3%; Hynix-led team said to emerge as a favorite to acquire chip unit - Japan press
Hong Kong
Cowell E Holdings Inc (1415) +5.5; Profit Alert: Guides H1 to record a significant improvement y/y
KWG Property Holdings (1813) +0.9%; Reports May pre-sales CNY3.88B
Ngai Shun Holdings (1246) -6.7%; Issues FY16/17 profit warning
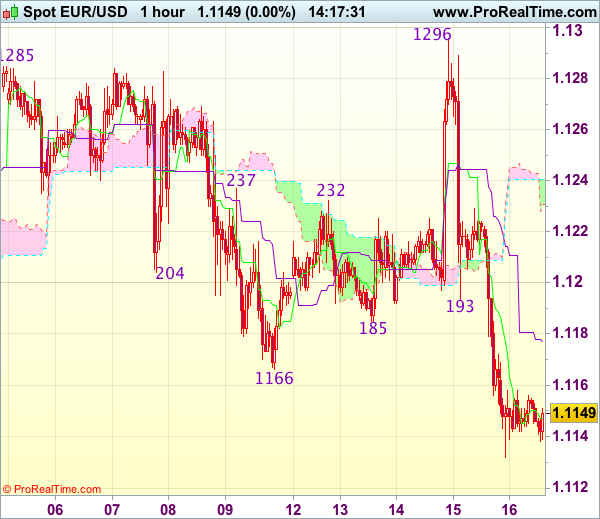
Trade Idea : EUR/USD – Sell at 1.1190
EUR/USD - 1.1155
Most recent candlesticks pattern : N/A
Trend : Near term down
Tenkan-Sen level : 1.1148
Kijun-Sen level : 1.1177
Ichimoku cloud top : 1.1241
Ichimoku cloud bottom : 1.1231
Original strategy :
Sell at 1.1190, Target: 1.1090, Stop: 1.1225
Position : -
Target : -
Stop : -
New strategy :
Sell at 1.1190, Target: 1.1090, Stop: 1.1225
Position : -
Target : -
Stop : -
This week’s selloff from 1.1296 signals top has been formed there and consolidation with downside bias is seen for this move to bring a strong retracement of recent upmove, hence further fall to previous support at 1.1109 would be seen, however, break there is needed to retain bearishness and extend further weakness to 1.1076 and possibly towards 1.1050 but price should stay above previous resistance at 1.1025.
In view of this, we are looking to sell euro on recovery as 1.1185-90 should limit upside and bring another decline. Above 1.1225-30 would defer and risk a stronger rebound to 1.1250 but price should falter well below said resistance at 1.1296, bring another decline later.
Trade Idea : USD/JPY – Buy at 110.40
USD/JPY - 111.16
Most recent candlesticks pattern : N/A
Trend : Near term up
Tenkan-Sen level : 111.06
Kijun-Sen level : 110.38
Ichimoku cloud top : 109.59
Ichimoku cloud bottom : 109.56
Original strategy :
Buy at 109.90, Target: 110.90, Stop: 109.55
Position : -
Target : -
Stop : -
New strategy :
Buy at 110.40, Target: 111.40, Stop: 110.05
Position : -
Target : -
Stop : -
As the greenback has surged again and broke above previous resistance at 110.81 (now support), adding credence to our view that low has been formed at 108.82 and the rise from there shall bring retracement of recent decline from 114.37, hence further gain to 111.40, then 111.60 (50% Fibonacci retracement of 114.37-108.82) would be seen, however, near term overbought condition should limit upside to previous resistance at 111.71 and price should falter well below another resistance at 112.13.
In view of this, we are looking to buy dollar on pullback but at a higher level. Whilst a return move to 110.81 cannot be ruled out, reckon another previous resistance at 110.35 would contain downside and bring another rise later.
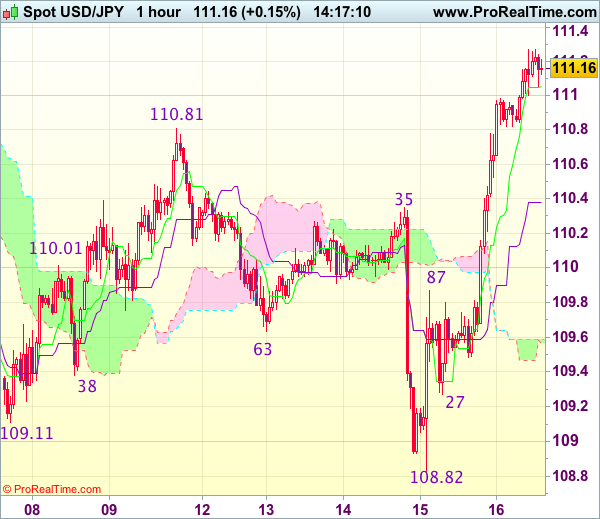
USD/JPY Is Trading Around 1.11
Market movers today
Today is a very quiet day in terms of data releases. We get the rate decision from the Central Bank of Russia, where we expect a cut to 9.00% from 9.25%.
In the US, we get the preliminary consumer confidence print from University of Michigan in June, which economists expect to remain unchanged around 97.1. Also building permits and housing starts data are due today.
Fed's Kapaln is due to speak t onight .
We also get the final HICP inflat ion data for the euro area in May.
The oil market will monitor the release of the weekly US oil rig count tonight for signs of a negat ive supply response to the fall in the oil price.
Selected market news
Bank of Japan (BoJ) kept its policy unchanged at its meet ing this morning. Hence, keeping the key policy unchanged at minus 0.1%, its target for the yield on 10Y JGB unchanged at 0 and asset purchases unchanged at previous levels. BoJ maintains the view that the Japanese economy is turning towards a moderate expansion. It has revised its view on global growth and consumpt ion upwards and signals in general its confidence that the recovery has been gaining moment um. 'Private consumpt ion has increased resilience against a background of steady improvement in the employment and income situation', is the current wording, which is more upbeat than the wording in April when consumpt ion was 'just ' resilient . Now the focus turns to the press conference where the market is likely to be looking for hints about how the cent ral bank eventually plans to exit its st imulus. USD/JPY is trading around 1.11 and little affected by the outcome.
The negative sent iment plaguing financial markets after the hawkish FOMC meet ing on Wednesday eased overnight with Asian stocks up around 0.5% and European and US equity futures posting small gains. Commodity markets are also trading with a slight ly more positive tone, e.g. the price on LME copper is up 0.3% t oday. The USD is holding on to recent gains.
Greece has reached a deal with internat ional creditors on its bailout package paving the way for the count ry to repay EUR7bn in debt that expires next month.
In the UK pieces are starting to fall into place after last week's elect ion. Yesterday, it was reported that a deal between the Conservat ives and the DUP is expected to be finalised and announced next week paving the way for the Conservat ive government to cont inue. Furthermore, UK and EU Brexit negot iators Davis and Barnier announced that talks will start on Monday.
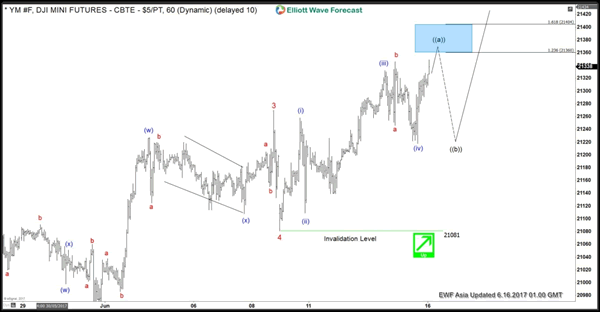
Elliott Wave View: Dow Jones Short Term Pullback
Short term Dow Jones Elliott Wave view suggests the rally from 4/19 low is unfolding as a diagonal Elliott Wave structure where Minor wave 1 ended at 21010 (4/26), Minor wave 2 ended at 20474 (5/18), Minor wave 3 ended at 21270 (6/8), and Minor wave 4 ended at 21081 (6/8). Minor wave 5 is in progress and subdivided into a zigzag Elliott Wave structure. Up from 6/8 low, Minute wave ((a)) is expected to complete at 21360 – 21404. Index should then pullback in Minute wave ((b)) to correct cycle from 6/8 low before the rally resumes. We don’t like selling the proposed pullback. Buyers should appear once Minute wave ((b)) pullback is over in 3, 7, or 11 swing.
Dow Jones 1 Hour Elliott Wave Chart