Sample Category Title
AUD/JPY Candlesticks and Ichimoku Analysis
Weekly
• Last Candlesticks pattern: Shooting star
• Time of formation: 13 Mar 2017
• Trend bias: Down
Daily
• Last Candlesticks pattern: Bearish engulfing pattern
• Time of formation: 16 Feb 2017
• Trend bias: Near term down
Although the Australian dollar did fall to 81.80 last week, as the pair has rebounded after failing to penetrate this support, suggesting further consolidation would be seen, however, reckon upside would be limited to 83.85-90 and bring another decline later, below said support at 81.80 would signal the rebound from 81.50 has ended, bring retest of this level first. A drop below this level would extend recent decline from 88.15 top to support at 81.10-15, however, near term oversold condition should limit downside and reckon 80.00 psychological support would hold from here, bring rebound later.
On the upside, expect recovery to be limited to the lower Kumo (now at 83.45) and bring another decline. Above 83.85-90 would risk another bounce towards indicated resistance at 84.55 but only a break above this level would abort and suggest low has been formed instead, risk a stronger rebound to 85.00-10, however, another indicated previous resistance at 85.75 should remain intact, bring another decline later.
Recommendation: Hold short entered at 83.65 for 81.65 with stop above 84.00.

On the weekly chart, as aussie has rebounded after failing to penetrate support at 81.80 and a white candlestick was formed, suggesting further consolidation above recent low at 81.50 would be seen, however, reckon upside would be limited to 83.40-50 and 83.85-90 should hold, bring another decline later, below 81.80 would bring retest of 81.50. A drop below this level would extend the fall from 88.15 top to support at 81.10-15, a weekly close below there would retain bearishness and suggest the rise from 72.50 has ended, then further fall to 80.50 and possibly psychological support at 80.00 would follow.
On the upside, expect recovery to be limited to 83.40-50 and bring another decline. Only a weekly close above resistance at 84.55 would suggest low is formed instead, bring a stronger rebound to 85.00, then towards resistance at 85.75 but only break there would abort and signal low is formed instead, bring further subsequent gain to 86.00 and then 86.50-60, however, price should falter below resistance at 87.50.

US Rate Decision And UK Jobs Data In Focus
The growing anticipation that the Federal Reserve may raise interest ratesthis evening has offered minimal support to the Greenback during early trading with prices edging below 97.00 as of writing. With the probability of a rate hike in June’sFOMC meeting currently at 99.6%, investors will most likely direct their attention towards the FOMC statement and economic projections for clarity on future rate hike timings.
It should be kept in mind that the recent weakness in US inflation has not only sparked concerns for the health of the US economy but also created uncertainty around the Federal Reserve’s policy plan for 2017. A dovish tone in the pending FOMC press conference coupled with a downward drift in the “dot plot” could fuel the Dollar bear rally as questions are raised over the Fed’s ability to hike rates twice more this year. It will also be interesting to see if the weak first quarter GDP Print for 2017 causes any change to the economic projections.
Focusing on the Greenback, the currency has had a turbulent year.I feel the outlook remains tilted to the downside as political uncertainty in Washington and soft economic data weighs heavily on the currency. With a Dovish hike on the cards in today’s meeting, the Dollar Index could find itself under renewed selling pressure. From a technical standpoint, the breakdown below 97.00 may entice bears to target 96.50.
UK Jobs report in focus
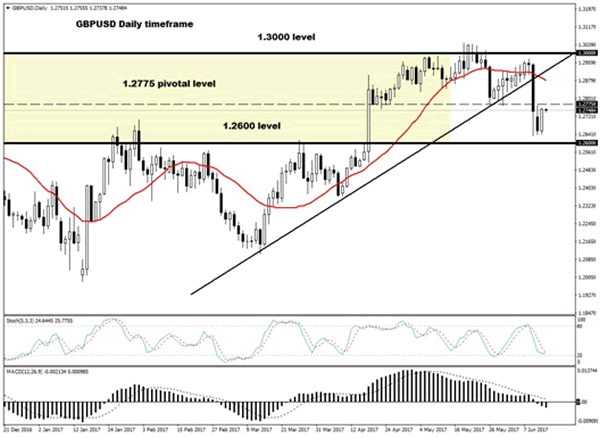
The Pound popped higher on Tuesday as currency investors remained cautiously optimistic over a softer Brexit following last week’s UK election outcome, resulting in a hung parliament. A vulnerable US Dollar played a role in the upside with short-term bulls sending the GBPUSD towards the 1.2775 resistance. Although the political uncertainty in the UK and pending Brexit negotiations are stillin focus, much attention will be directed towards the UK jobs report this morning.
While Britain’s unemployment rate continues to improve, the shrinking average weekly earnings remain a cause for concern and will be heavily scrutinized by investors on release. If average earnings fail to build momentum, consumers may feel the heat especially after inflation has hit a four-year high at 2.9% in May. With rising consumer prices, political uncertainty and ongoing Brexit woes all adding to the messy mix, it will be interesting to see how the Bank of England responds in Thursday’s MPC meeting.
Sterling/Dollar is bearish on the daily charts with the dynamic 1.2775 resistance acting as a level of interest. Repeated weakness below 1.2775 could encourage a further decline towards 1.2600.
report showed an unexpected increase in US Crude stockpiles last week which fueled oversupply fears. The downside was complimented by news of Nigeria and Libya pushing OPEC’s output higher last month for the first time this year. With oversupply woes still a recurring theme, and investors becoming increasing skeptical over the effectiveness of the production cuts led by OPEC and Russia to rebalance the markets, WTI remains vulnerable to further selling pressure. US Shale remains a threat to the OPEC deal with markets observing how the cartel reacts when the surging output from the US seizes market share from other OPEC members.
On the daily charts, WTI Crude has created consistently lower lows and lower highs which fulfills the prerequisites of a bearish trend. The downside momentum should encourage sellers to send prices towards $45.50. In an alternative scenario, a technical bounce towards $46.50 could attract bears to instigaterenewed rounds of selling with $45.50 acting as a first target.
Commodity spotlight – Gold
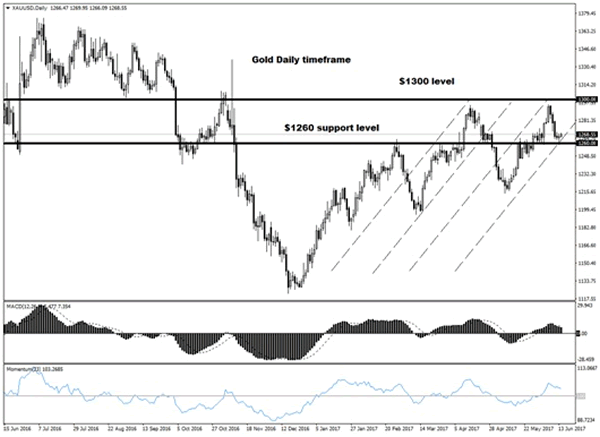
The looming US interest rate hike this evening has had little impact on Gold with prices rebounding towards $1270 during early trade. Although this zero-yielding metal remains dictated by US interest rate expectations, speculations of a dovish hike in June have supported prices. With risk aversion from Brexit developments and political uncertainty in the US likely to accelerate the flight to safety in the medium to longer term, Gold bulls could receive enough encouragementto keep the metal above $1260. From a technical standpoint, the daily bullish outlook on Gold remains valid as long as prices remain above $1260.
AUD/USD Candlesticks and Ichimoku Analysis
Weekly
• Last Candlesticks pattern: Shooting doji
• Time of formation: 20 Feb 2017
• Trend bias: Sideways
Daily
• Last Candlesticks pattern: Bearish engulfing pattern
• Time of formation: 21 Mar 2017
• Trend bias: Near term down
Aussie has maintained a firm undertone after staging a strong rebound from 0.7372 earlier this month, adding credence to our view that a temporary low has been formed at 0.7329 last month, hence consolidation with upside bias remains for the rebound from there to extend gain to another previous resistance at 0.7611, having said that, aussie needs to break this level to signal the fall from 0.7750 top has ended and bring subsequent rise towards resistance at 0.7680 but price should falter below chart resistance at 0.7750.
On the downside, whilst initial pullback to 0.7500 cannot be ruled out, reckon the Tenkan-Sen (now at 0.7470) would limit downside and bring another rise later. Below 0.7415-20 would defer and risk weakness towards said support at 0.7372 which is likely to hold from here. Only below said support at 0.7372 would revive bearishness and suggest the rebound from 0.7329 has ended, bring retest of this level, break there would extend recent fall from 0.7750 top to 0.7300 and possibly 0.7250-60 but reckon downside would be limited to 0.7200-10 and price should stay well above indicated previous chart support at 0.7158.
Recommendation: Buy at 0.7475 for 0.7675 with stop below 0.7375.

On the weekly chart, last week’s strong rebound did form a white candlestick, adding credence to our view that low has been formed at 0.7329, hence consolidation with upside bias remains for further gain towards previous resistance at 0.7611, however, break there is needed to signal the fall from 0.7750 has ended at 0.7329, bring subsequent rise towards resistance at 0.7680, having said that, price should falter below said resistance at 0.7750.
On the downside, although pullback to 0.7500 cannot be ruled out, reckon the Tenkan-Sen (now at 0.7470) would limit downside and bring another rebound. A weekly close below the Kijun-Sen (now at 0.7454) would risk weakness to 0.7400 but only break of said support at 0.7372 would suggest the rebound from 0.7329 has ended and revive bearishness for retest of this level. A break there would extend recent decline from 0.7750 to 0.7290-00 and possibly towards 0.7230, however, downside should be limited to 0.7200 and price should stay well above previous support at 0.7158, risk from there is seen for a rebound to take place later.

Trade Idea : USD/CHF – Hold short entered at 0.9720
USD/CHF - 0.9681
Most recent candlesticks pattern : N/A
Trend : Near term down
Tenkan-Sen level : 0.9682
Kijun-Sen level : 0.9682
Ichimoku cloud top : 0.9699
Ichimoku cloud bottom : 0.9687
Original strategy :
Sold at 0.9720, Target: 0.9620, Stop: 0.9720
Position : - Short at 0.9720
Target : - 0.9620
Stop : - 0.9720
New strategy :
Hold short entered at 0.9720, Target: 0.9620, Stop: 0.9720
Position : - Short at 0.9720
Target : - 0.9620
Stop : - 0.9720
Dollar’s retreat after meeting resistance at 0.9728 late last week has retained our bearishness and consolidation with mild downside bias remains for weakness to 0.9657 support, however, break of 0.9640 is needed to signal the rebound from 0.9613 has ended, bring retest of this level first. A break below this level would extend recent decline to 0.9600-05 (50% projection of 1.0100-0.9692 measuring from 0.9808) later.
In view of this, we are holding on to our short position entered at 0.9720. Above said resistance at 0.9728 would abort and signal a temporary low has been formed at 0.9613 last week instead, bring a stronger rebound to 0.9761 resistance but price should falter below resistance at 0.9808.

EUR/GBP Daily Outlook
Daily Pivots: (S1) 0.8763; (P) 0.8807; (R1) 0.8834; More...
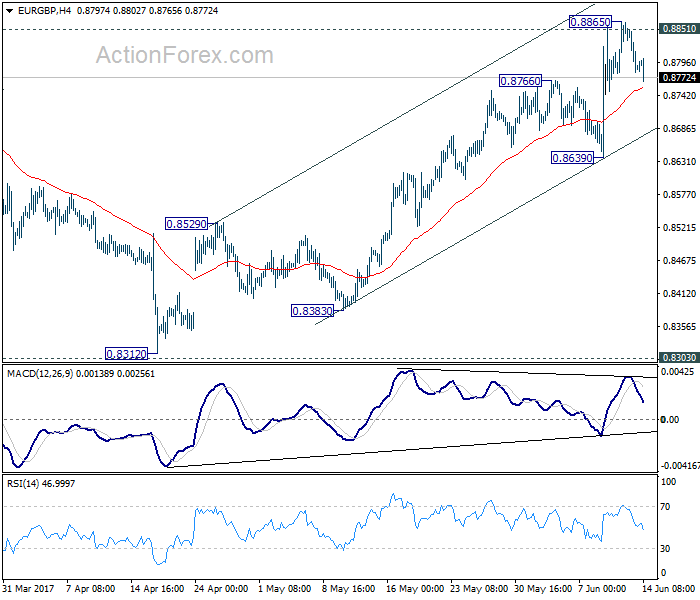
Despite edging higher to 0.8865, EUR/GBP cannot sustain above 0.8851 resistance and retreated. Intraday bias is turned neutral for some consolidation. At this point, we'd expect 0.8639 support to hold and bring another rise. Firm break of 0.8851 will pave the way to retest 0.8304 high. . At this point, there is no clear sign of larger up trend resumption yet. Hence, we'll be cautious on topping around 0.9304. However, break of 0.8639 support will now indicate near term topping and bring deeper pull back to 55 day EMA (now at 0.8615) and below.
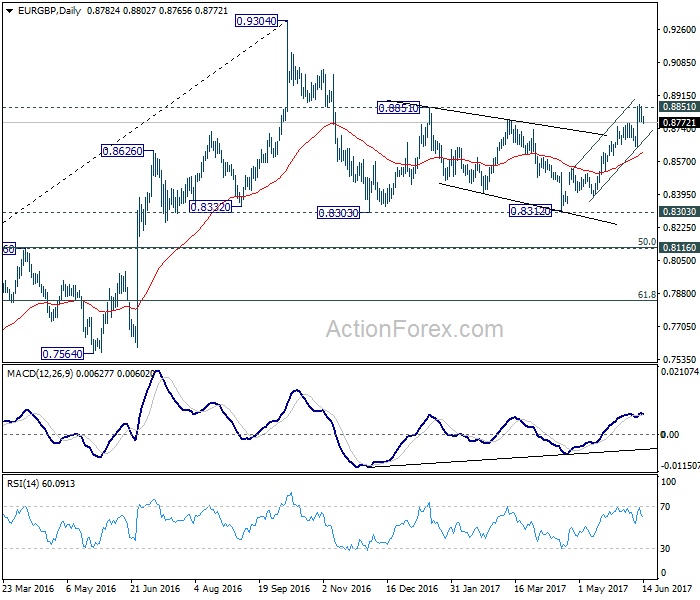
In the bigger picture, price actions from 0.9304 are viewed as a medium term corrective pattern. The leg from 0.9304 should have completed after testing 0.8332 structural support. But it's too early to say that larger rise from 0.6935 is resuming. Rejection from 0.9304 will extend the consolidation with another falling leg. Meanwhile, firm break of 0.9304 will target 0.9799 (2008 high). In case of another decline, we'd expect strong support from 0.8116 cluster support (50% retracement of 0.6935 to 0.9304 at 0.8120) to contain downside and bring rebound.
EUR/AUD Daily Outlook
Daily Pivots: (S1) 1.4816; (P) 1.4856; (R1) 1.4911; More...
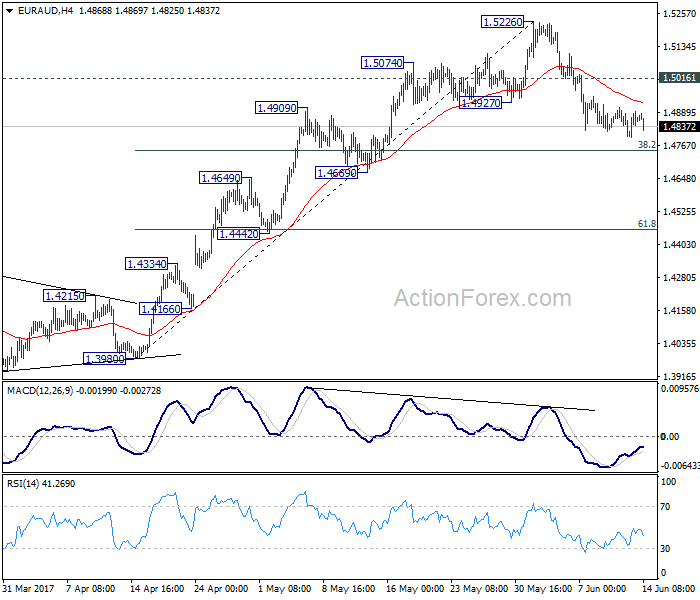
The correction from 1.5226 in EUR/AUD is still in progress and might extend to 38.2% retracement of 1.3980 to 1.5226 at 1.4750. But we'd expect strong support from 1.4669 to contain downside and bring rebound. Above 1.5015 minor resistance will turn bias to the upside for 1.5226 first. Larger rise from 1.3624 is expected to resume later. Break of 1.5226 will target next medium term fibonacci level at 1.5455.
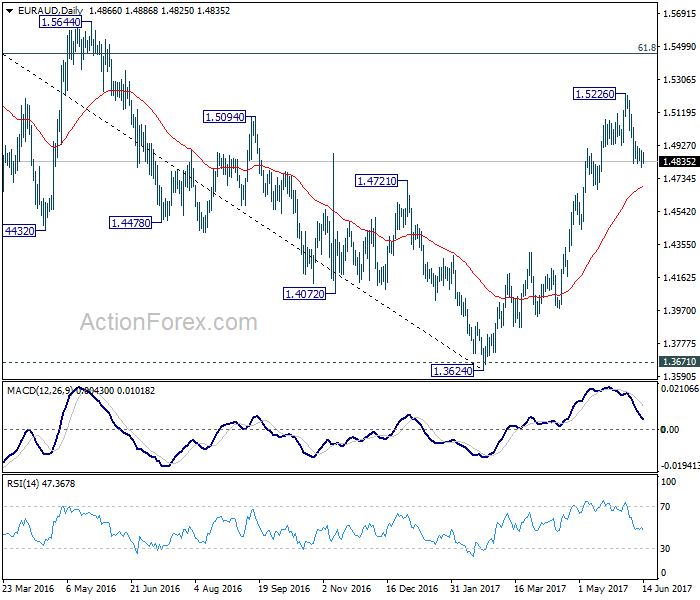
In the bigger picture, price actions from 1.6587 medium term top are viewed as a corrective pattern. Such correction should be completed at 1.3624 after defending 1.3671 key support. Rise from 1.3642 is now expected to target 61.8% retracement of 1.6587 to 1.3624 at 1.5455. Sustained break there will pave the way to retest 1.6587. In any case, outlook will now stay cautiously bullish as long as 1.4669 support holds. Break of 1.4669 will dampen the bullish view and would at least bring deeper fall back to 55 week EMA (now at 1.4539).
Trade Idea : GBP/USD – Sell at 1.2845
GBP/USD - 1.2788
Most recent candlesticks pattern : N/A
Trend : Near term down
Tenkan-Sen level : 1.2768
Kijun-Sen level : 1.2728
Ichimoku cloud top : 1.2709
Ichimoku cloud bottom : 1.2683
New strategy :
Sell at 1.2845, Target: 1.2745, Stop: 1.2880
Position : -
Target : -
Stop : -
As the British pound has surged again after staged a strong rebound yesterday, suggesting further consolidation above last week’s low at 1.2635 would be seen and initial upside risk remains for gain to 1.2805-10 (50% Fibonacci retracement of 1.2978-1.2635), however, reckon 1.2845-50 (61.8% Fibonacci retracement) would hold from here, bring retreat later, below the Kijun-Sen (now at 1.2728) would bring weakness to 1.2680-85 but break of latter level is needed to signal the rebound from 1.2635 has ended, then fall to 1.2650 would follow.
In view of this, we are looking to sell cable on recovery as 1.2845-50 should limit upside. Above 1.2870-80 would suggest recent decline has ended at 1.2635 instead, risk a stronger rebound to 1.2905-10 and possibly 1.2930 but price should falter well below resistance at 1.2978.

GBP/JPY Daily Outlook
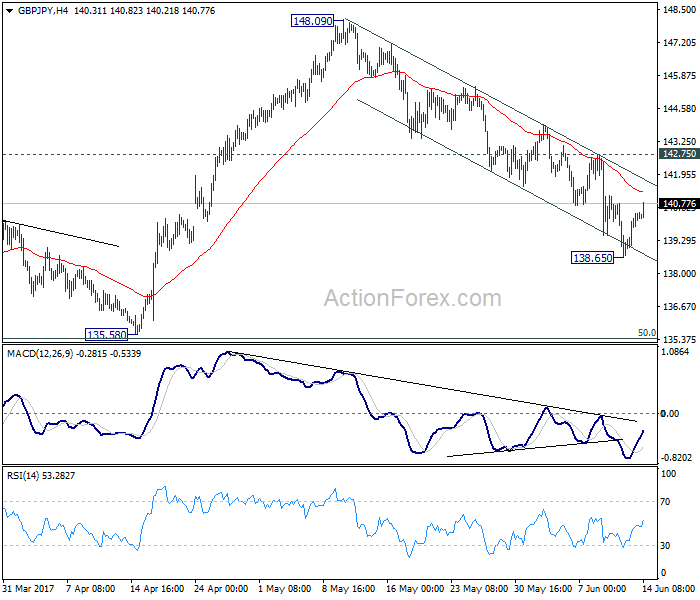
Daily Pivots: (S1) 139.37; (P) 139.88; (R1) 140.84; More....
Intraday bias in GBP/JPY is turned neutral with the current recovery. But near term outlook stays bearish with 142.75 resistance intact. Fall from 148.09 could still extend lower. In that case, we'd look for bottoming signal around 135.58, which is close to 135.39 fibonacci level, to bring rebound. Break of 142.75, nonetheless, will argue that fall from 148.09 is completed and turn bias back to the upside for this resistance.
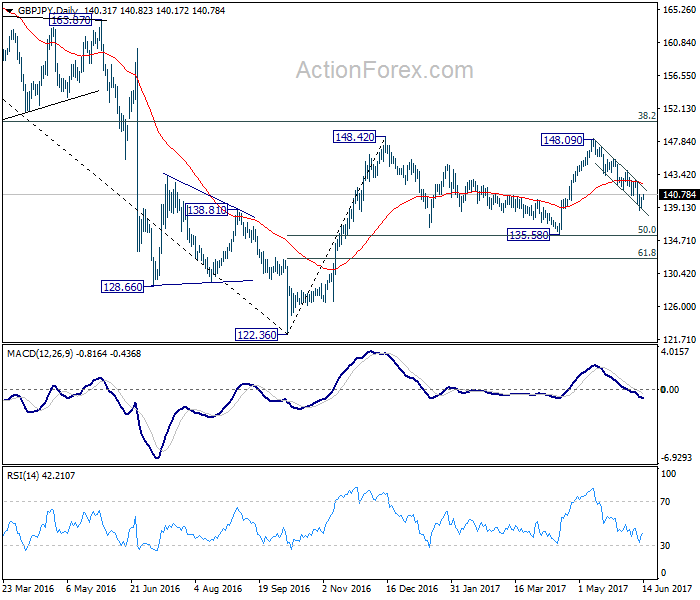
In the bigger picture, while the fall from 148.09 is deeper than expected, we're not bearish in the cross yet. Price action from 148.42 is possibly developing into a sideway pattern with fall from 148.09 as the third leg. Deeper decline could be seen but we're looking for strong support from 135.58 and 50% retracement of 122.36 to 148.42 at 135.39 to contain downside. Rise from 122.36 is still mildly in favor to resume at a later stage. However, sustained break of 135.58/39 will confirm reversal and target a retest on 122.36 low.
EUR/JPY Daily Outlook
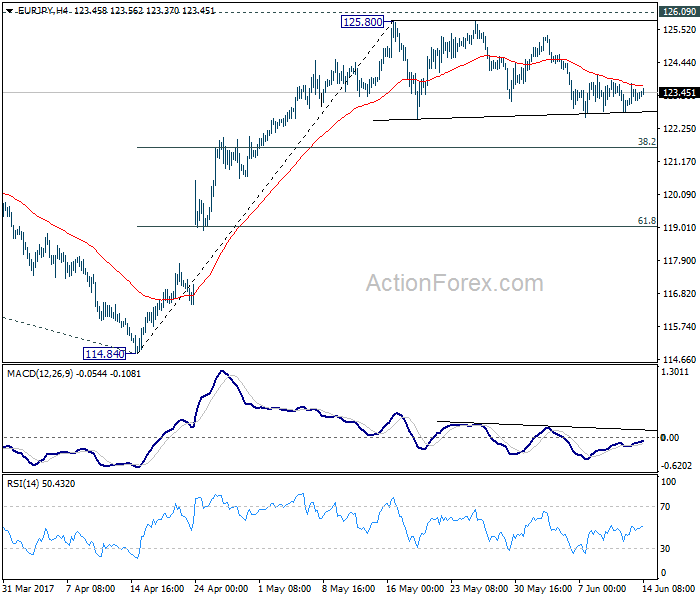
Daily Pivots: (S1) 123.01; (P) 123.38; (R1) 123.74; More...
EUR/JPY continues to gyrate in consolidation from 125.80 and intraday bias stays neutral. Deeper decline cannot be ruled out. But in that case, downside should be contained by 38.2% retracement of 114.84 to 125.80 at 121.61 to bring rise resumption. We're staying mildly bullish in the cross. And, break of 126.09 key resistance will extend the whole rebound from 109.03 to 100% projection of 109.03 to 124.08 from 114.84 at 129.89. Nonetheless, firm break of 121.61 will dampen our bullish view and bring deeper fall to 61.8% retracement at 119.02.
In the bigger picture, focus is staying on 126.09 support turned resistance. Decisive break there will confirm completion of the down trend from 149.76. And in such case, rise from 109.20 is at the same degree and should target 141.04 resistance and above. Meanwhile, rejection from 126.09 and break of 114.84 will extend the fall from 149.76 through 109.20 low.

EUR/CHF Daily Outlook
Daily Pivots: (S1) 1.0845; (P) 1.0853; (R1) 1.0867; More...
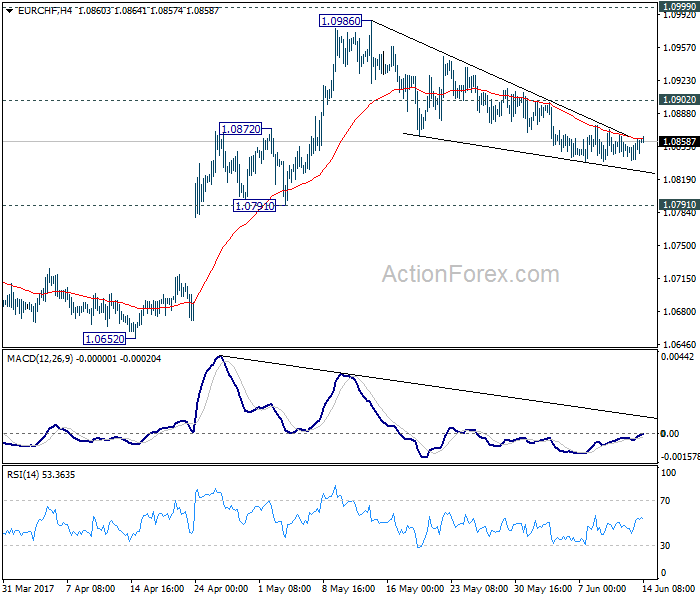
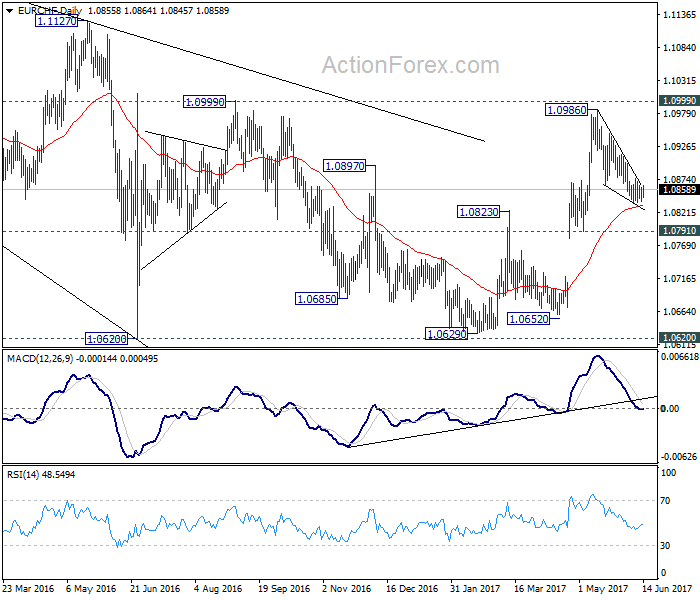
No change in EUR/CHF's outlook. The corrective pull back from 1.0986 extend lower. But we'd expect strong support from 1.0791/0872 support zone, probably around 55 day EMA (now at 1.0832) to complete the correction from 1.0986. Break of 1.0902 minor resistance will turn bias back to the upside for 1.0986/0999. Overall, rise from 1.0629 is expected to resume later.
In the bigger picture, the price actions from 1.1198 are seen as a corrective move. Such correction could have completed after defending 38.2% retracement of 0.9771 to 1.1198 at 1.0653. Decisive break of 1.0999 resistance will target a test on 1.1198 high. For now, this will be the preferred case as long as 1.0791 support holds.