
Sample Category Title
Forex Technical Analysis: EUR/USD, USD/JPY, GBP/USD
EUR/USD
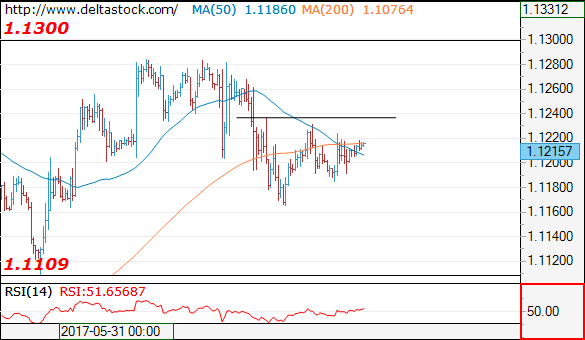
Current level - 1.1215
The overall outlook remains negative below 1.1240 minor resistance, for a slide towards 1.1108 low. Initial support lies at 1.1165.
| Resistance | Support | ||
| intraday | intraweek | intraday | intraweek |
|
1.1240 |
1.1360 |
1.1165 |
1.1022 |
|
1.1300 |
1.1610 |
1.1109 |
1.0838 |
USD/JPY
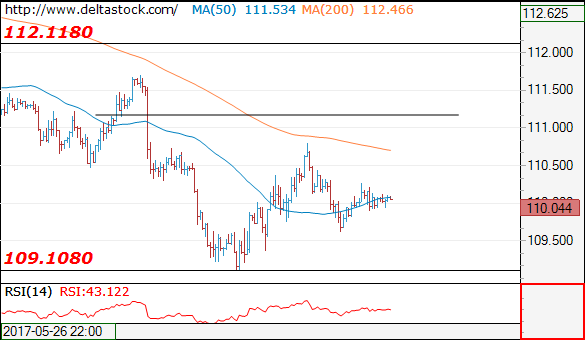
Current level - 110.04
The outlook here is neutral and only a violation of the crucial dynamic resistance at 110.40 will signal trend dynamics for a rise towards 112.10 area.
| Resistance | Support | ||
| intraday | intraweek | intraday | intraweek |
|
110.40 |
112.10 |
109.65 |
109.08 |
|
110.80 |
114.30 |
109.08 |
108.12 |
GBP/USD
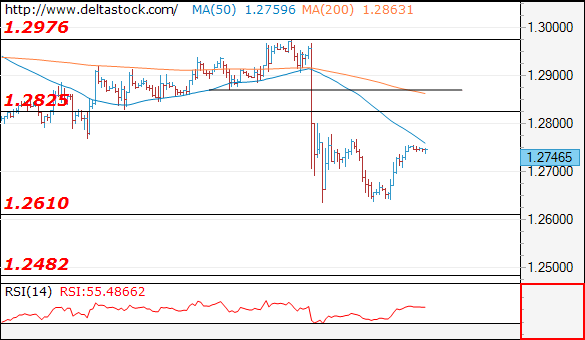
Current level - 1.2746
The recent rebound above 1.2610 major support signals a positive intraday bias, for a possible test of 1.2830 hurdle. Minor intraday support lies at 1.2735.
| Resistance | Support | ||
| intraday | intraweek | intraday | intraweek |
|
1.2830 |
1.2970 |
1.2735 |
1.2610 |
|
1.2880 |
1.3050 |
1.2610 |
1.2480 |
FOMC Set To Hike, But What About The ‘Dots’?
Today, all eyes will be on the much-awaited FOMC policy decision. This will be one of the 'bigger' meetings, which includes fresh economic forecasts, an updated 'dot plot', as well as a press conference by Chair Yellen. The forecast is for the Committee to raise borrowing costs by 25bps, something overwhelmingly supported by market pricing. The implied probability for such action currently rests at 99.6%. Given that a rate hike is fully priced in at this stage, we think market focus will mostly be on any potential changes to the 'dot plot'. In addition, market participants may look for clues as to when the Fed will begin normalizing its enormous balance sheet.
Economic developments have been quite disappointing recently. Inflation has slowed, inflation expectations have declined notably, wage growth is flat, and expectations regarding fiscal stimulus have diminished. As such, we expect Chair Yellen to maintain a cautious stance with regards to the economic progress. Having said that though, a cautious tone does not necessarily imply that the dollar will weaken in the aftermath. The market is already extremely pessimistic with regards to the pace of future rate increases.
Following this hike, the next one is fully priced in for June 2018, which means investors are anticipating a pause in the Fed's normalizing cycle. So, in case the 'dot plot' is left untouched, signaling one more hike in 2017 and another three in 2018, this could be enough to revive speculation regarding another rate increase this year and perhaps keep investors from unwinding their long USD positions. In such a case, the reaction in USD may be somewhat positive. In order for the dollar to weaken notably, the 'dots' would likely need to be revised lower, in our view.
EUR/USD has been moving in a sideways manner since the ECB meeting, oscillating between the 1.1160 (S1) barrier and the resistance of 1.1240 (R1). Nevertheless, the price structure on the 4-hour chart suggests that an uptrend is in place since the 10th of April. Therefore, even if the Fed leaves the 'dot plot' unchanged and the EUR/USD declines, we would treat such a setback as a corrective phase. Given the continued recovery in the Euro area and the removal of the ECB's interest rate easing bias, we expect the bulls to take the reins again soon and push the battle up for a test near 1.1300 (R2). On the other hand, if the Fed revises its rate path down, we would expect the aforementioned test to come today, without a preceding correction.
USD/JPY also traded quietly yesterday, staying slightly below the crossroad of the 110.30 (R1) resistance line and the downtrend line taken from the peak of the 11th of May. In case the rate path stays untouched, the rate may trade higher and break above that resistance zone. Such a break could initially aim for the next resistance of 110.75 (R2). Now, in case the plot is downgraded, USD/JPY could tumble below the support of 109.70 (S1), overcome the next at 109.35 (S2), and perhaps challenge the 108.90 (S3) territory.
As for the rest of today's highlights:
During the European day, UK employment data for April are due out. The unemployment rate is expected unchanged, average weekly earnings including bonuses are forecast to have risen at the same pace as previously, while earnings excluding bonuses are anticipated to have slowed slightly. Considering that inflation accelerated notably in April, unchanged or slowing wages would push real wages further into the negative territory, something that could weigh on the pound.
As for the US indicators, we get CPI and retail sales data, all for May. Kicking off with the CPIs, the headline rate is expected to have declined again, albeit marginally, while the core rate is anticipated to have held steady. As for the retail sales, the forecast is for both the headline and the core rates to have ticked down from previously, but to have remained within the positive territory. Even though a slight slowdown in the headline CPI and retail sales could hurt the dollar somewhat on the news, the currency's forthcoming direction will probably be decided by the FOMC signals later in the day.
Besides Fed Chair Yellen, we have one more speaker on the agenda: ECB Vice President Vitor Constancio.
EUR/USD
Support: 1.1160 (S1), 1.1110 (S2), 1.1075 (S3)
Resistance: 1.1240 (R1), 1.1300 (R2), 1.1370 (R3)
USD/JPY
Support: 109.70 (S1), 109.35 (S2), 108.90 (S3)
Resistance: 110.30 (R1), 110.75 (R2), 111.25 (R3)
Dollar Slightly Down ahead of Fed Meeting; Kiwi at 3½-Month High
The dollar was slightly down as the Asian trading session was coming to a halt. The New Zealand dollar recovered after initially dropping as the country's current account deficit as a proportion of GDP widened to its most in the first quarter of the year. Other data during the Asian session pertained to China.
Looking at the dollar index, a broad measure of the US currency's strength, it was down 0.1% and below the 97 level with the close of Asian markets trading. Against the yen, the greenback was flat, marginally above the 110-yen level. Euro/dollar was slightly up at 1.1219. Pound/dollar was also up, eyeing the 1.28 level.
The Federal Reserve will be completing its two-day meeting today during which it is expected to announce a 25 bps interest rate rise for its benchmark rate to reach a target range of 1 to 1.25%. A press conference by Fed Chair Janet Yellen will follow after the rate decision announcement. Investors will be looking for guidance on the future path of rate hikes as well as the Fed's plan to unwind its mammoth-size balance sheet. Should Fed officials communicate a dovish outlook, then the greenback is expected to weaken. US inflation data later in the day will also attract attention.
Turning to New Zealand, the kiwi suffered losses versus its US counterpart as the country's current account deficit reached NZ$8.13 billion, its most as a percentage of GDP. Kiwi/dollar fell to 0.7198 at its lowest but later recovered to reach a three-and-a-half-month high of 0.7239.
In terms of Chinese data, industrial output numbers showed output increasing 6.5% year-on-year in May, beating expectations of a 6.3% rise and coinciding with April's respective rate. Retail sales also came above forecasts projecting a 10.6% year-on-year growth to record a rise by 10.7%. Investment didn't expand as strongly as expected though, growing by 8.6% on an annual basis, negatively comparing to the expected 8.8% and April's 8.9%. Dollar/yuan was up and close to the day's high of 6.79 with the close of Asian markets.
Moving from forex markets to commodities, gold was last up two-tenths of a percent, trading at $1268 an ounce, ahead of investor cautiousness regarding the Fed meeting. WTI and Brent crude were both down 0.9% and 0.8%, at $46.04 and $48.35 a barrel respectively. The Energy Information Administration's (EIA) weekly report on US crude oil inventories will be released later in the day.
Technical Outlook: USDJPY – Downside Remains At Risk While Tenkan-Sen/200 SMA Cap, FOMC In Focus
The pair is struggling to sustain gains above 110.00 handle, with falling 10SMA continuing to cap and keeping the downside at risk. Overall bearish structure supports the notion as the price stays below key barriers at 110.41 (daily Tenkan-sen) and 110.59 (200SMA). Return below Monday's low at 109.62 would attract key support at 109.11 (07 June low). Last Friday's high at 110.81 (reinforced by 20SMA) marks pivotal barrier and break here would sideline persisting downside risk. Outcome of FOMC meeting is expected to trigger stronger movements and signal near-term direction.
Res: 110.35, 110.41, 110.59, 110.81
Sup: 109.95, 109.62, 109.38, 109.11
What Is Gold’s Next Move After US FED Interest Rate Decision on 14th June, 2017?
Technical analysis chart of Gold with Volume and On Balance Volume indicators, and support and resistance lines, may give guidance as to the direction Gold may take a!er FED Interest rate decision.
The recent fall in price over the last three days does not have support from volume and this suggests a bounce should be expected here or very soon. Additionally, there is strong, bullish support for Gold's price at about 1,260. These support the idea of upwards movement a!er the FED Interest rate decision.
However, the latest and now most important signal comes from On Balance Volume breaking below support. This is bearish.
Given that a technical analysis approach would expect Gold to move mostly in the direction of least resistance and away from greatest support, the expectation is for Gold to breakout upwards. But because of On Balance Volume's bearish signal, any upside movement is expected to be relatively short lived.
Elliott Wave Analysis: BTCUSD Trading In Final Stages Of An Impulse
Bitcoin is unfolding an impulsive pattern to the upside, which means that red wave 4 correction has ended around the 1800 mark. We now see a five wave impulsive movement which unfolded in black wave 3 and found a top near the 3000 level. Wave 3 can so be completed and recent pullback could represent black wave 4 correction. That said, if wave 4 correction is completed then we can expect a new recovery to follow into the final black wave 5, but if price contniues from current levels lower, then it can be safe to say, that a top has been already placed and that a depeer correction can be in progress.
BTCUSD, 4H
Technical Outlook: AUDUSD – Fresh Bulls Probe Again Above 100SMA
The Aussie dollar rallied in early European trading, boosted by weaker US dollar and overall solid Chinese data and broke above descending daily cloud top at 0.7539. Fresh bulls are pressuring key near-term barriers at 0.7555/65 (100SMA/top of five-day congestion). Sustained break here is needed to signal continuation of the bull-leg from 0.7369 (02 June trough), which is also the third wave of five-wave cycle from 0.7328 (09 May low), towards targets at 0.7588 (Fibo 61.8% of 0.7749/0.7328 descend) and 0.7604 (FE 123.6% of wave C).
Failure to clear 0.7555/65 pivots would signal prolonged congestion, with key near-term support at 0.7525 (200SMA) expected to hold dips and keep intact overall bullish structure.
Fed's decision due later today is expected to give firmer direction signals.
Res: 0.7565, 0.7588, 0.7604, 0.7632
Sup: 0.7539, 0.7525, 0.7506, 0.7490
Trade Idea: GBP/USD – Sell at 1.2850
GBP/USD – 1.2755
Recent wave: Wave V of larger degree wave (III) has ended at 1.1986 and major correction has commenced from there for gain to 1.3000 and 1.3140-50
Trend: Near term up
Original strategy :
Sell at 1.2820, Target: 1.2620, Stop: 1.2880
Position: -
Target: -
Stop: -
New strategy :
Sell at 1.2850, Target: 1.2650, Stop: 1.2910
Position: -
Target: -
Stop:-
Cable’s rebound after holding above indicated support at 1.2635 (last week’s low) has retained our view that further consolidation above this level would be seen and another bounce to 1.2800-05 cannot be ruled out, however, reckon upside would be limited to 1.2845-50 and bring another decline, below 1.2680 would bring test of said support at 1.2635, break there would extend recent decline from 1.3048 for retracement of recent upmove to 1.2600 but downside should be limited to 1.2550 and reckon previous support at 1.2515 would hold from here.
Our preferred count on the daily chart is that cable's rebound from 1.3500 (wave (A) trough) is unfolding as a wave (B) with A ended at 1.7043, followed by triangle wave B and wave C as well as wave (B) has ended at 1.7192, the subsequent selloff is the larger degree wave (C) which is still unfolding with minor wave (III) of larger degree wave 3 ended at 1.1986, hence wave (IV) correction is in progress which could either be a triangle wave (IV) of a complex formation but upside should be limited to 1.3500 and price should falter well below 1.4000, bring another decline in wave (V) of 3 for weakness to 1.1500, then 1.1200.
On the upside, expect recovery to be limited to 1.2800-05 and 1.2850 should hold, bring another decline. Above 1.2860-70 would defer and suggest low is possibly formed instead, risk a stronger rebound towards 1.2900 but price should falter well below this week’s high at 1.2978 and bring another decline later.

Trade Idea: GBP/JPY – Sell at 141.50
GBP/JPY - 140.65
Recent wave: Medium term low formed at 120.50 and (A)-(B)-(C) major correction has commenced with (A) leg ended at 148.45, hence wave (B) is unfolding for retreat to 131.00-10.
Trend: Near term up
Original strategy:
Sell at 141.30, Target: 139.30, Stop: 141.90
Position: -
Target: -
Stop: -
New strategy :
Sell at 141.50, Target: 139.50, Stop: 142.10
Position: -
Target: -
Stop:-
As sterling found good support at 138.70 earlier this week and has staged a strong rebound, retaining our view that further consolidation above this level would be seen and corrective bounce to 141.00-10 cannot be ruled out, however, reckon upside would be limited and renewed selling interest should emerge around 141.40-50, bring another decline later, below 139.40-50 would bring another test of said support at 138.70 but break there is needed to signal the decline from 148.11 top has resumed and may extend further weakness to 138.45-50.
In view of this, would not chase this fall here and we are looking to sell sterling again on further subsequent recovery as upside should be limited to 141.40-50 and bring another decline. Above 141.90-00 would defer and risk rebound to 142.40-50 but said resistance at 142.75 should limit upside and bring another selloff later.
Our preferred count is that larger degree wave V with circle is unfolding from 251.12 with wave (I) 219.34, (II): 241.38 and wave (III) is subdivided into 1: 192.60, 2: 215.89 (23 Jul 2008) and wave 3 ended at 118.87 earlier in 2009. The correction from there to 162.60 is wave 4 which itself is a double three and is labeled as first a-b-c ended at 151.53, followed by wave x at 139.03, 2nd a ended at 162.60, 2nd b at 146.75 and 2nd c leg of wave 4 ended at 163.00. Therefore, the decline from 163.00 to 116.85 is now treated as wave 5 which also marked the end of larger degree wave (III), hence wave (IV) major correction has commenced for retracement of the wave (III) from 241.38 and upside target at 183.95-00 (50% Fibonacci retracement of the wave (II) from 241.38) had been met, a drop below 160.00 would suggest wave (IV) has ended at 195.85, bring decline in wave (V) for initial weakness to 130 (already met) and 120.

EUR/CHF Elliott Wave Analysis
EUR/CHF : 1.0852
EUR/CHF: Major wave 5 trough ended at 0.8426 and correction has commenced from there for subsequent gain towards 1.1400-1.1500.
As the single currency has remained under pressure after breaking previous support at 1.0866, suggesting the fall from 1.0988 is still in progress and marginal weakness from here cannot be ruled out, however, a daily close below previous support at 1.0792 is needed to signal recent rise has ended and extend the fall from 1.0988 towards previous minor resistance at 1.0720. Looking ahead, only a drop below 1.0720 would suggest top is formed instead, risk weakness towards said support at 1.0656 first.
To recap our preferred count, the decline from 1.6828 (end wave (B)) is labeled as the beginning of wave (C) which should unfold as an impulsive move with 1: 1.5326, 2: 1.6377 and wave 3 is sub-divided into (i): 1.4300, (ii): 1.5880 and wave (iii) is still unfolding with (1): 1.4577, (2): 1.5448 and wave (3) is an extended 3rd with i: 1.5006, ii: 1.5383, wave iii: 1.3073, then wave iv ended at 1.3925 and wave v at 1.3073, wave (4) ended at 1.3925 and wave (5) has ended at 1.2765 which also marked the low of wave (iii) and wave (iv) has ended at 1.3835 and wave (v) as well as larger degree wave 3 has ended at 1.0075. The selloff from 1.2650 signals wave 4 has ended there and we are taking a view that the wave 5 could also have ended 0.8426, hence consolidation is seen with mild upside bias for rebound to 1.1000 first, then towards 1.1400.
On the upside, above 1.0875-80 wold bring recovery to 1.0920 but break there is needed to signal low is formed, bring test of 1.0949 resistance, only a daily close above there would signal the pullback from 1.0988 has ended and bring retest of this level. Looking ahead, above said resistance at 1.0988 would confirm recent rise has resumed and extend further gain to another previous resistance at 1.1001, break there would signal the upmove from 1.0622 low (2016 low) is still in progress for headway to 1.1018, then 1.1050 but reckon resistance at 1.1107 would limit upside and price should falter well below 2016 high at 1.1129.
Recommendation: Hold long entered at 1.0905 for 1.1105 with stop below 1.0805.

The long-term downtrend started from 1.9626 (Apr 1985) to 1.4166 (Sep 1995) is treated as wave (A) with A:1.6285 (Dec 1987), B: 1.9342 (May 1992) and C: 1.4166, then wave (B) ended at 1.6828 with A: 1.7147 (Feb 1997), B: 1.4398 (Sep 2001), C: 1.6828 (Nov 2007), therefore, wave (C) is now in progress with the breakdown indicated as above. This wave (C) already met indicated downside target at 1.1455/60 and 1.1300, it could have ended at 0.8426, consolidation with mild upside bias is seen for gain to 1.1000 and later towards 1.2000.
