
Sample Category Title
Trade Idea : EUR/USD – Hold short entered at 1.1230
EUR/USD - 1.1216
Most recent candlesticks pattern : N/A
Trend : Up
Tenkan-Sen level : 1.1216
Kijun-Sen level : 1.1205
Ichimoku cloud top : 1.1203
Ichimoku cloud bottom : 1.1199
Original strategy :
Sold at 1.1230, Target: 1.1130, Stop: 1.1240
Position : - Short at 1.1230
Target : - 1.1130
Stop : - 1.1240
New strategy :
Hold short entered at 1.1230, Target: 1.1130, Stop: 1.1240
Position : - Short at 1.1230
Target : - 1.1130
Stop : - 1.1240
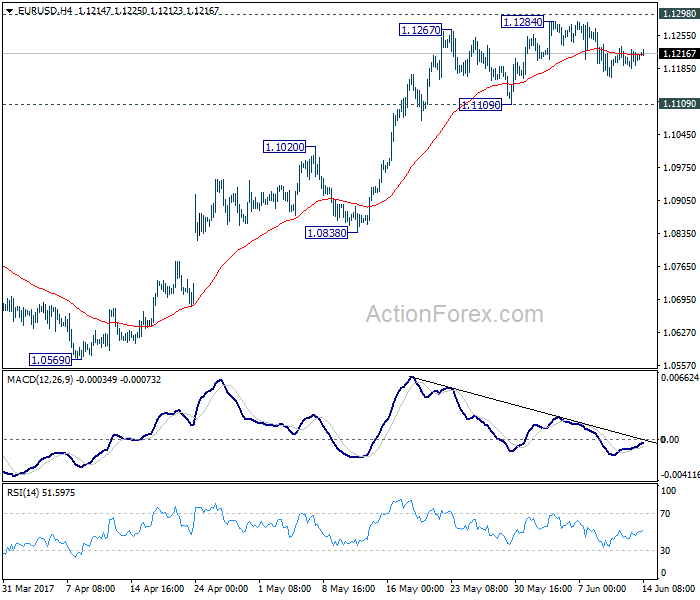
The single currency found support at 1.1185 yesterday and has rebounded, suggesting further consolidation would be seen, however, as long as indicated resistance at 1.1232-37 holds, bearishness remains for weakness to 1.1180-85, break there would signal the rebound from 1.1166 has ended, bring retest of this level but below there is needed to extend the fall from 1.1285 top for retracement of early upmove to 1.1145-50 and then towards 1.1120, however, support at 1.1109 should hold from here.
In view of this, we are holding on to our short position entered at 1.1230. Only above 1.1265-70 would abort and bring retest of 1.1285, only break there would revive bullishness and confirm recent upmove has resumed and extend further gain to previous chart resistance at 1.1300, break there would encourage for headway to 1.1340-45 and later towards chart point at 1.1366.

Trade Idea : USD/JPY – Stand aside
USD/JPY - 110.10
Most recent candlesticks pattern : N/A
Trend : Down
Tenkan-Sen level : 110.04
Kijun-Sen level : 110.09
Ichimoku cloud top : 110.22
Ichimoku cloud bottom : 109.97
New strategy :
Stand aside
Position : -
Target : -
Stop : -
The greenback traded narrowly after meeting resistance at 110.27 yesterday and further sideways trading is in store, although mild downside bias is seen for weakness to 109.63 support, dollar needs to penetrate previous support at 109.38 to signal the rebound from last week’s low of 109.11 has ended at 110.81 and bring retest of this level. A drop below there would confirm recent decline has resumed for further fall to 109.00, then 108.75-80, however, near term oversold condition would limit downside and reckon 108.50 would hold.
If said support at 109.38 continues to hold, then further consolidation would take place and another bounce to 110.35-40 cannot be ruled out, however, upside should be limited to 110.60 and price should falter below 110.81. Only break of this resistance would signal the erratic rise from 109.11 low is still in progress for further gain to 111.00 and possibly 111.20-30 but price should falter well below resistance at 111.71, bring retreat later. As near term outlook is mixed, would be prudent to stand aside in the meantime.

EUR/USD Daily Outlook
Daily Pivots: (S1) 1.1189; (P) 1.1206 (R1) 1.1228; More....
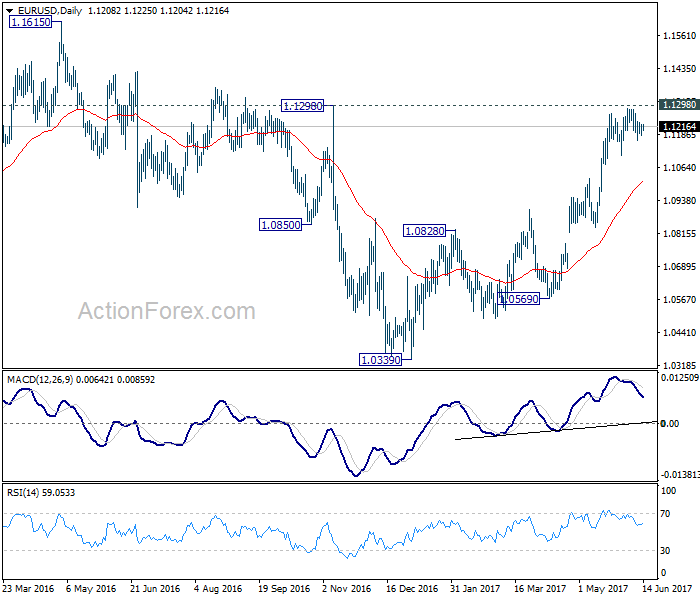
EUR/USD continues to gyrate in range below 1.1284 and intraday bias remains neutral at this point. Focus remains on 1.1298 key resistance. Decisive break there will carry larger bullish implication and target 1.1615 resistance next. On the downside, break of 1.1109 support will indicate short term topping and rejection from 1.1298. In such case, intraday bias will be turned to the downside for 1.0838 support.
In the bigger picture, the case for medium term reversal continues to build up with EUR/USD staying far above 55 week EMA (now at 1.0922). Also, bullish convergence condition is seen in weekly MACD. Focus will now be on 1.1298 key resistance. Rejection from there will maintain medium term bearishness and would extend the whole down trend from 1.6039 (2008 high). However, firm break of 1.1298 will indicate reversal. In such case, further rally would be seen back to 1.2042 support turned resistance next.
GBP/USD Daily Outlook
Daily Pivots: (S1) 1.2676; (P) 1.2716; (R1) 1.2791; More...
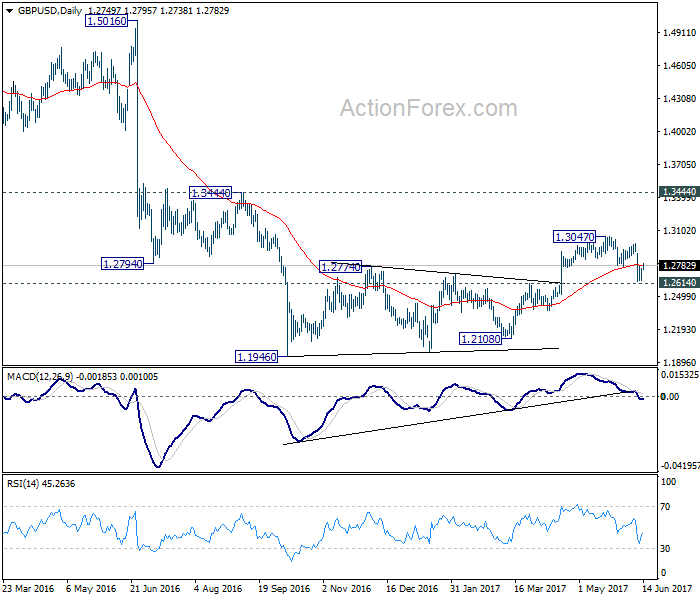
Recovery from 1.2633 is still in progress and might extend. But still, we'd expect upside to be limited below 1.2977 resistance to bring fall resumption. We continue to favor the case that consolidation pattern from 1.1946 has completed at 1.3047 already. Decisive break of 1.2614 resistance turned support would confirm our bearish view and target a test on 1.1946 low next. However, break of 1.2977 will dampen our view and turn bias back to the upside for 1.3047 and above.
In the bigger picture, fall from 1.7190 is seen as part of the down trend from 2.1161. Price actions from 1.1946 medium term low are seen as a consolidation pattern, which could have completed after hitting 55 week EMA. Break of 1.1946 low will target 61.8% projection of 1.5016 to 1.1946 from 1.3047 at 1.1150 next. In case the consolidation from 1.1946 extends, outlook will stay remain bearish as long as 1.3444 resistance holds.
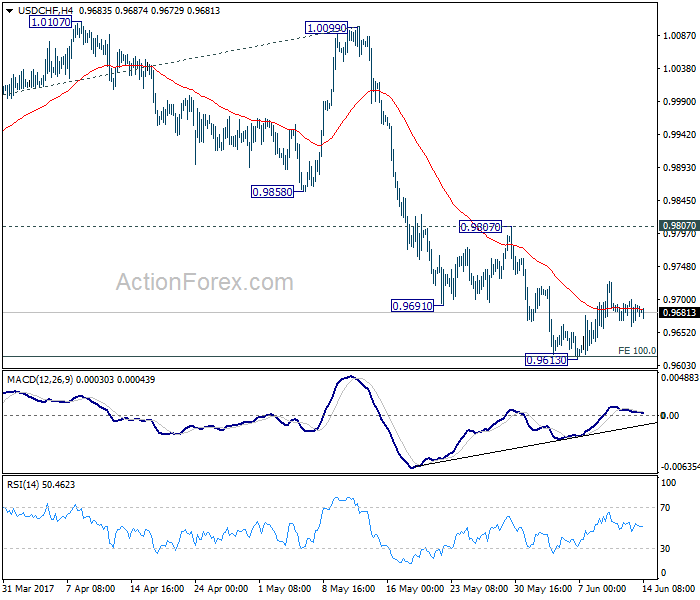
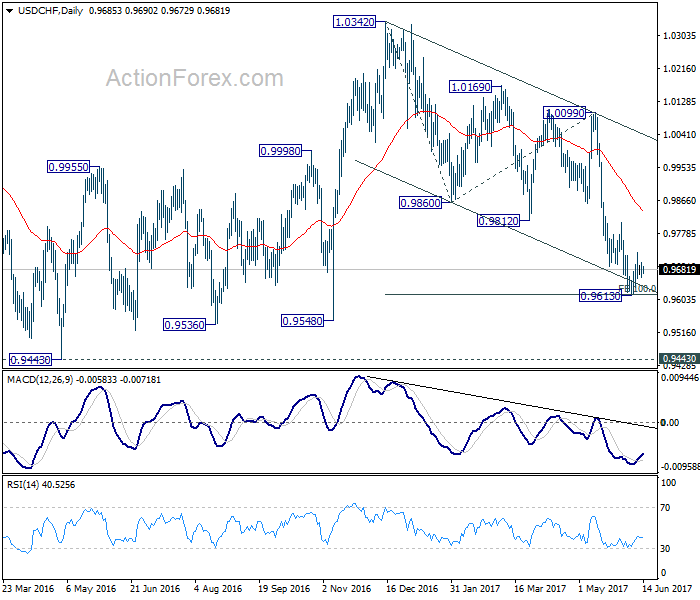
USD/CHF Daily Outlook
Daily Pivots: (S1) 0.9672; (P) 0.9683; (R1) 0.9697; More.....
USD/CHF is staying in the consolidation pattern from0.9613 and intraday bias remains neutral at this point. Since 0.9807 resistance remains intact, near term outlook is cautiously bearish for further fall. Break of 0.9613 will extend the whole decline from 1.0342 to 0.9548 support and below. We'd start to look for bottoming signal again as it approaches 0.9443 key support level. However, considering bullish convergence condition in 4 hour MACD, break of 0.9807 will indicate near term reversal and turn outlook bullish for 1.0099 resistance next.
In the bigger picture, USD/CHF is still bounded in medium term range of 0.9443/1.0342 for the moment. Consolidative trading would likely continue and medium term outlook remains neutral. Break of 1.0342 key resistance is needed to confirm underlying bullish momentum in the pair. Meanwhile, downside attempts should be contained by 0.9443 key support level. However, sustained break of 0.9443 will carry larger bearish implication and target 0.9 handle.
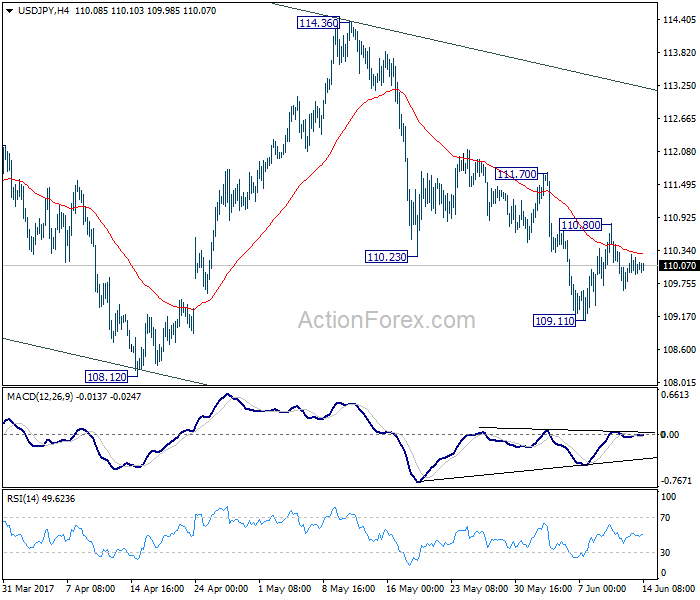
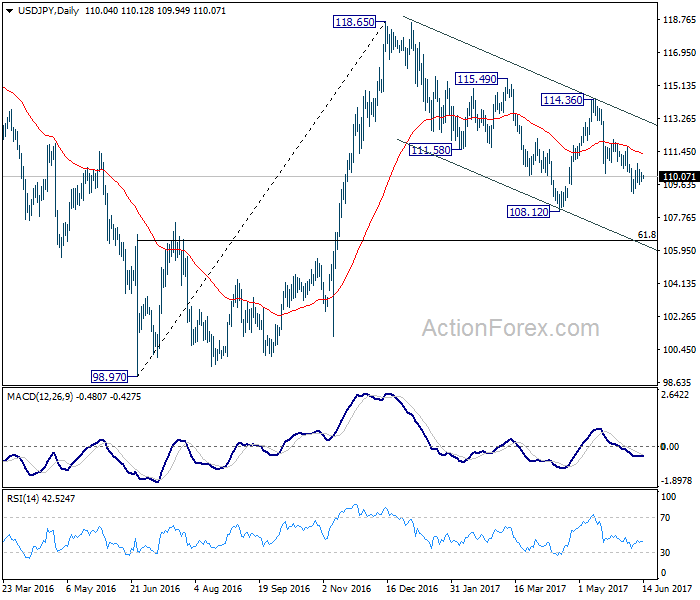
USD/JPY Daily Outlook
Daily Pivots: (S1) 109.56; (P) 109.99; (R1) 110.37; More...
USD/JPY is staying in consolidation in range of 109.11 /110.80. Intraday bias stays neutral at this point. With 111.70 resistance intact, near term outlook remains mildly bearish and deeper decline is expected. Below 109.11 will resume the fall from 114.36 and target 108.12 low first. Break will extend the whole corrective fall from 118.65 to 61.8% retracement of 98.97 to 118.65 at 106.48. We will look for bottoming sign there. Meanwhile, break of 110.70 will indicate near term reversal and turn bias back to the upside for 114.36 resistance instead.
In the bigger picture, price actions from 125.85 high are seen as a corrective pattern. It's uncertain whether it's completed yet. But in case of another fall, downside should be contained by 61.8% retracement of 75.56 to 125.85 at 94.77 to bring rebound. Overall, rise from 75.56 is still expected to resume later after the correction from 125.85 completes.
Market Update – Asian Session: China Economic Data Steadies Ahead Of The Fed Decision
US Session Highlights
(US) Goldman Economist Chain Store Sales w/e Jun 10th w/w: +1.1%; Y/Y: +0.5%
(US) MAY PPI FINAL DEMAND M/M: 0.0% V 0.0%E; Y/Y: 2.4% V 2.3%E; Ex Food and Energy M/M: 0.3% v 0.1%e; Y/Y: 2.1% v 1.9%e
(CA) Bank of Canada (BoC) Gov Poloz: Reiterates low interest rates have been used to offset shocks
With all eyes clearly on the outcome of the FOMC meeting tomorrow, equity markets gained strength again, as Techs recovered some lost ground from the past two days. Renewed interest in stocks took the S&P, the Dow, and the Russell 2000 to close at new all-time highs. A rate hike seems almost fully discounted; however, the market will be looking for signals from the meeting statement and Yellen's speech post interest rate announcement. All S&P sectors made positive gains for the day; Materials and Energy were the out-performers, gaining 1.2% and 0.7% respectively, Technology gained 0.6%
US markets on close: Dow +0.4%, S&P500 +0.5%, Nasdaq +0.7%
Best Sector in S&P500: Materials
Worst Sector in S&P500: Telecom
Biggest gainers: FTR +8.5%; SWN +5.1%; CHK +.47%
Biggest losers: MYL -2.9%; FOXA -2.4%; YHOO -2.1%
At the close: VIX 10.4 (-1.0pts); Treasuries: 2-yr 1.36% (flat), 10-yr 2.21% (flat), 30-yr 2.86% (-1bps)
US movers afterhours
HRB Reports Q4 $3.76 v $3.51e, Rev $2.33B v $2.32Be; adj EBITDA $904M v $812M y/y; +10.6% afterhours
ALXN Names Paul J. Clancy CFO; effective July 10th (from BIIB); +3.7% afterhours
SQNS File to sell ADS shares through Canaccord; -5.9% afterhours
Politics
(US) White House spokesperson: Pres Trump has the right but no intention to fire Special Councel Mueller - press
Key economic data
(CN) CHINA MAY FIXED ASSETS EX RURAL YTD Y/Y: 8.6% (4-month low) V 8.8%E
(CN) CHINA MAY INDUSTRIAL PRODUCTION Y/Y: 6.5% V 6.4%E; YTD Y/Y: 6.7% V 6.6%E
(CN) CHINA MAY RETAIL SALES Y/Y: 10.7% V 10.7%E; YTD Y/Y: 10.3% V 10.3%E
(AU) AUSTRALIA JUNE WESTPAC CONSUMER CONFIDENCE INDEX: 96.2 V 98.0 PRIOR, M/M: -1.8% V -1.1% PRIOR (3rd straight decline)
(NZ) NEW ZEALAND Q1 CURRENT ACCOUNT BALANCE (NZ$): 0.24B V +1.00BE
Speakers and Press
China
(CN) China National Bureau of Stats (NBS): China economy remains stable in May with improvement
(CN) China May Power Consumption +5.1% y/y – Chinese Press
Japan
(JP) Japan reportedly seeking talks on North Korea with China and South Korea - Japan press
Australia
(AU) JPMorgan expects RBA interest rates to bottom at 1.00%, down from 1.50% current - press
Korea
(KR) South Korea foreign bond inflows rose by a net of KRW2.1T in May (5th straight rise) - FSS
Asian Equity Indices/Futures (00:30ET)
Nikkei flat, Hang Seng -0.3%, Shanghai Composite -0.6%, ASX200 +0.9%, Kospi -0.3%
Equity Futures: S&P500 -0.1%; Nasdaq -0.2%, Dax -0.1%, FTSE100 flat
FX ranges/Commodities/Fixed Income (00:30ET)
EUR 1.1205-1.1220; JPY 109.95-110.15; AUD 0.7530-0.7545; NZD 0.7200-0.7225
Aug Gold +0.2% at 1,272/oz; July Crude Oil -1.0% at $45.99/brl; July Copper flat at $2.60/lb
(US) Weekly API Oil Inventories: Crude: +2.8M v -4.6M prior (first build in 4 weeks)
(CN) PBOC SETS YUAN MID POINT AT 6.7939 V 6.7954 PRIOR
(CN) PBOC to inject combined CNY90B v CNY50B prior in 7-day, 14-day and 28-day reverse repos
(CN) China Finance Ministry sells 2-yr bonds at 3.620%; bid-to-cover 2.64x; Sells 5-yr bonds at 3.565%, bid-to-cover 3.76x
Asia equities notable movers
Australia
Capitol Health (CAJ) +20%; Sells NSW assets to I-MED radiology network for A$81.5M cash; Guides FY17 Radiology EBITDA at top of guided range ~A$21.5M
Melbourne IT (MLB) +2.2%; Affirms FY17 underlying EPS A$0.17-0.19; EBITDA A$37.5-41.5M - investor presentation
Vocus (VOC) +0.8%; Affirms FY17 underlying net ~A$160-165M; EBITDA ~A$365-375M; Rev ~A$1.8B - investor slides
Telstrea (TLS) flat; Confirms to cut 1,400 jobs as part of cost cutting efforts
Japan
Yamato Holdings (9064) +1.8%; said to plan 15% raise on parcel delivery fees - Nikkei
Honda (7267) +0.9%; Reportedly plans to add 2.2K jobs to speed Chinese SUV output - Nikkei
Toshiba (6502) -3.3%; Said to delay the submission of FY16 annual securities report by at least 1-month - Japan press
Hong Kong
NetDragon Websoft Holdings (777) +4.8%; Reports Q1 core segment profit CNY168.8M, +78.9% y/y
Skyworth Digital (751) +0.7%; Reports FY16 net HKD$1.31B, -39.6% y/y
China Sandi Holdings (910) -1.8%; Profit warning: Guides FY17 Net loss v profit HK$160.
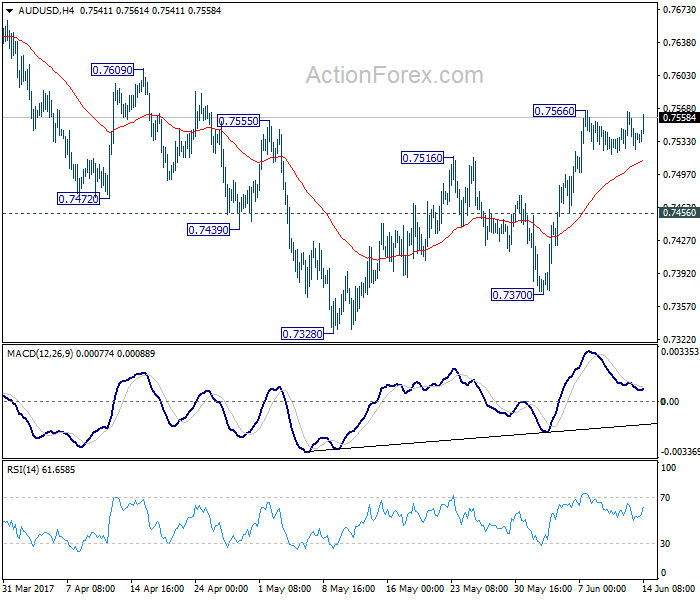
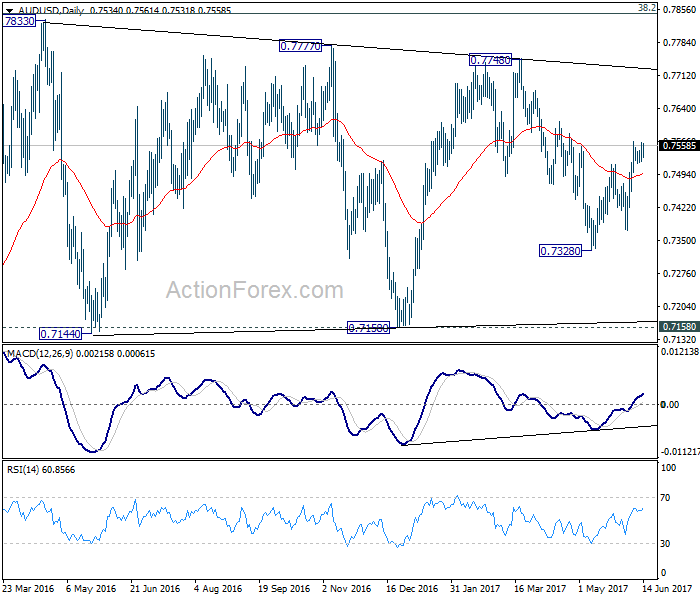
AUD/USD Daily Outlook
Daily Pivots: (S1) 0.7519; (P) 0.7542; (R1) 0.7559; More....
At this point, AUD/USD is still bounded in right range below 0.7566 temporary top and intraday bias remains neutral first. With 0.7456 minor support intact, further rally is in favor. Above 0.7566 will extend the rise from 0.7328 and target 0.7748 resistance. In that case, we'll be cautious on topping again as it approaches medium term fibonacci level at 0.7849. On the downside, below 0.7456 minor support will turn bias back to the downside for 0.7328 short term bottom.
In the bigger picture, we're still treating price actions from 0.6826 low as a corrective pattern. And, as long as 38.2% retracement of 0.9504 to 0.6826 at 0.7849 holds, long term down trend from 1.1079 is expected to resume sooner or later. Break of 0.6826 low will target 0.6008 key support level. However, firm break of 0.7849 will indicate that rise from 0.6826 is developing into a medium term rebound, rather than a sideway pattern. In such case, stronger rise should be seen to 55 month EMA (now at 0.8091) and above.
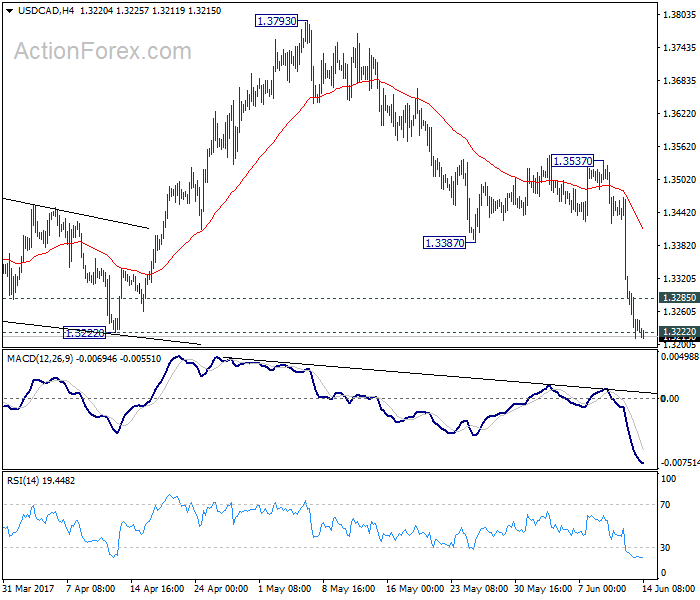
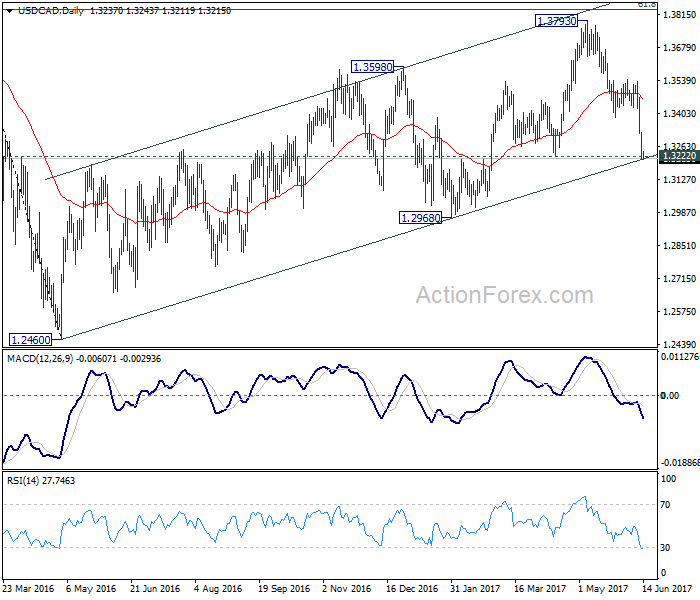
USD/CAD Daily Outlook
Daily Pivots: (S1) 1.3193; (P) 1.3259; (R1) 1.3306; More....
USD/CAD drops further to as low as 1.3211 so far as the decline from 1.3793 extends. Intraday bias remains on the downside with focus on 1.3222 support, which is close to medium term channel support. As noted before, we're holding on to the view that whole choppy rise from 1.2460 has completed at 1.3793. Decisive of 1.3222 will affirm our bearish view and target 1.2968 key support for confirmation. On the upside, above 1.3285 minor resistance will turn bias neutral and bring recovery. But upside should be limited by 1.3387/3537 resistance zone to bring another decline.
In the bigger picture, price actions from 1.4689 medium term top are seen as a correction pattern. The first leg has completed at 1.2460. Rise from 1.2460 is seen as the second leg and could have completed at 1.3793, ahead of 61.8% retracement of 1.4689 to 1.2460 at 1.3838. Break of 1.3222 should indicate the start of the third leg while further break of 1.2968 should confirm. In that case, USD/CAD should decline through 1.2460 support to 50% retracement of 0.9406 to 1.4869 at 1.2048.
Dollar Stays Broadly Weak as Markets Await US CPI and Then FOMC
US markets regained strength overnight with DOW and S&P 500 closed at record highs as selloff in tech stocks stabilized. DOW gained 92.8 pts, or 0.44% to end the day at 21328.47. S&P 500 rose 10.96 pts, or 0.45% to close at 2440.35. However, no strength was seen in treasury yields as 10 year yield lost -0.006 to close at 2.207, staying well below 2.297 resistance and maintains near term bearish outlook. In the currency markets, Canadian Dollar remains the strongest one as boosted by hawkish twist in BoC officials' rhetorics. Meanwhile, Dollar is trading as the weakest major currency for the week. The development argues that traders could be quite concerned with a dovish FOMC hike today.
Fed to hike but focus on projections and vote
FOMC meeting is the major focus of the day. Fed is widely expected to raise the federal fund rate by 25bps to 1.00-1.25%. Markets are pricing in near 100% chance of that and there is little chance for Fed to give us a surprise there. But traders are very cautious as it's now getting more unsure on whether Fed will hike again in September. The new economic projections to be released today will probably hold the first key to this. The vote split for today's decision will be another hint on how divided the committee is regarding the economic outlook. Fed chair Janet Yellen will likely release more information on Fed's plan to shrink its balance sheet too.
Dollar selling might accelerate if EUR/USD breaks 1.13 firmly
Technically, dollar is staying generally bearish except versus Sterling. EUR/USD is holding above 1.1109 support and is mildly in favor to take out 1.1298 key resistance, which would carry larger bullish implications. USD/JPY is holding below 111.70 resistance, which suggests that fall from 114.36 is still in progress for 108.12 and below, to extend the larger decline from 118.65 (Dec high). USD/CAD breached 1.3222 key support level which now further affirms the case of medium term reversal and puts1.3 handle into focus. Overall, the greenback will be vulnerable if Fed hints at a rate path that is slower than originally planned. And a strong break of 1.13 in EUR/USD could trigger accelerated selloff in the greenback.
PM May said Brexit negotiation to start next week
In UK, Prime Minister Theresa May confirmed that the negotiation with EU on Brexit will formally start on January 19 as originally planned. May announced while she was meeting with French President Emmanuel Macron that "the timetable for the Brexit negotiation remains on course and will begin next week." And she emphasized that "we have been very clear we want to maintain a close relationship and a close partnership with the EU and individual member states into the future, including in the areas we've discussed this evening."
While the negotiation may really start next week, UK's stance on it is still very unclear after last week's election. There were calls for a multi-party negotiation team and a softer Brexit approach. Meanwhile, Labour has indicated that they will not agree a Brexit consensus with the Conservatives until May ditches her "no deal is better than a bad deal" rhetoric.
On the data front
China industrial production rose 6.5% yoy in May, fixed assets investments rose 8.6% yoy, retail sales rose 10.7% yoy. Japan industrial production was finalized at 4.0% mom in April. Australia Westpac consumer confidence dropped -1.8% in June. New Zealand current account balance turned into NZD 0.24b surplus in Q1.
German CPI was finalized at -0.2% mom, 1.5% yoy in May. UK employment data will be a key focus in European session. Sterling will look into the data for more upside momentum while traders await tomorrow's BoE announcement. Eurozone will release industrial production and employment.
While FOMC rate decision and press conference is the major focus, Dollar will first face the test of CPI in early US session. Retail sales and business inventories will also be released.
USD/CAD Daily Outlook
Daily Pivots: (S1) 1.3193; (P) 1.3259; (R1) 1.3306; More....
USD/CAD drops further to as low as 1.3211 so far as the decline from 1.3793 extends. Intraday bias remains on the downside with focus on 1.3222 support, which is close to medium term channel support. As noted before, we're holding on to the view that whole choppy rise from 1.2460 has completed at 1.3793. Decisive of 1.3222 will affirm our bearish view and target 1.2968 key support for confirmation. On the upside, above 1.3285 minor resistance will turn bias neutral and bring recovery. But upside should be limited by 1.3387/3537 resistance zone to bring another decline.
In the bigger picture, price actions from 1.4689 medium term top are seen as a correction pattern. The first leg has completed at 1.2460. Rise from 1.2460 is seen as the second leg and could have completed at 1.3793, ahead of 61.8% retracement of 1.4689 to 1.2460 at 1.3838. Break of 1.3222 should indicate the start of the third leg while further break of 1.2968 should confirm. In that case, USD/CAD should decline through 1.2460 support to 50% retracement of 0.9406 to 1.4869 at 1.2048.
Economic Indicators Update
| GMT | Ccy | Events | Actual | Forecast | Previous | Revised |
|---|---|---|---|---|---|---|
| 22:45 | NZD | Current Account Balance Q1 | 0.24B | 1.00B | -2.34B | -2.42B |
| 0:30 | AUD | Westpac Consumer Confidence Jun | -1.80% | -1.10% | ||
| 2:00 | CNY | Retail Sales Y/Y May | 10.70% | 10.80% | 10.70% | |
| 2:00 | CNY | Fixed Assets Ex Rural YTD Y/Y May | 8.60% | 8.80% | 8.90% | |
| 2:00 | CNY | Industrial Production Y/Y May | 6.50% | 6.50% | 6.50% | |
| 4:30 | JPY | Industrial Production M/M Apr F | 4.00% | 4.10% | 4.00% | |
| 4:30 | JPY | Capacity Utilization M/M Apr | 4.30% | -1.60% | ||
| 6:00 | EUR | German CPI M/M May F | -0.20% | -0.20% | -0.20% | |
| 6:00 | EUR | German CPI Y/Y May F | 1.50% | 1.50% | 1.50% | |
| 8:30 | GBP | Jobless Claims Change May | 10.0K | 19.4K | ||
| 8:30 | GBP | Claimant Count Rate May | 2.30% | |||
| 8:30 | GBP | ILO Unemployment Rate 3M Apr | 4.60% | |||
| 8:30 | GBP | Average Weekly Earnings 3M/Y Apr | 2.40% | 2.40% | ||
| 9:00 | EUR | Eurozone Industrial Production M/M Apr | 0.50% | -0.10% | ||
| 9:00 | EUR | Eurozone Employment Q/Q Q1 | 0.30% | 0.30% | ||
| 12:30 | USD | CPI M/M May | 0.00% | 0.20% | ||
| 12:30 | USD | CPI Y/Y May | 2.00% | 2.20% | ||
| 12:30 | USD | CPI Core M/M May | 0.20% | 0.10% | ||
| 12:30 | USD | CPI Core Y/Y May | 1.90% | 1.90% | ||
| 12:30 | USD | Advance Retail Sales May | 0.10% | 0.40% | ||
| 12:30 | USD | Retail Sales Less Autos May | 0.20% | 0.30% | ||
| 14:00 | USD | Business Inventories Apr | 0.30% | 0.20% | ||
| 14:30 | USD | Crude Oil Inventories | 3.3M | |||
| 18:00 | USD | FOMC Rate Decision | 1.25% | 1.00% |