
Sample Category Title
Market To Focus On Fed Projections After Rate Hike
Dollar steady ahead of Fed rate decision
The US dollar is lower against the British pound, the Canadian dollar, the euro and the New Zealand dollar ahead of a busy day for the greenback. US inflation and retail sales will be published on Wednesday, June 14 at 8:30 am EDT. The data release will have little impact on the central bank decision but together with the economic assessment of Fed members will help the market evaluate the price of the USD.
The U.S. Federal Reserve will release its policy statement on Wednesday, June 14 at 2:00 pm EDT. The American central bank is widely anticipated to raise the benchmark Fed funds rates by 25 basis points. The CME FedWatch tool is showing a 99.6 percent that the target rate will be in the 100–125 basis points range. The Fed will also publish its economic projections to be followed by a press conference with Fed Chair Janet Yellen at 2:30 pm EDT.
The Fed raised interest rates by 25 basis points in December of 2015 and 2016 and again in March to this year. The USD has struggled in 2017 despite the growing monetary policy divergence with other major economies due to the escalation of political risk surrounding the Trump administration. The economic projections contain the forecasts from FOMC members for the next two years and will be full of insights into what will be the next move by the Fed.
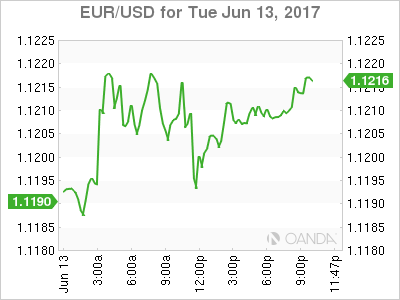
The EUR/USD gained 0.044 percent on Tuesday. The single currency is trading at 1.1205 ahead of the release of the Federal Open Market Committee (FOMC) statement on Wednesday. The European economy appears to be on the mend and even though the European Central Bank (ECB) has been careful in keeping optimism in check by keeping the size of the stimulus program unchanged despite pressure from Germany. The risk of a further breakdown of the European Union has been minimized after the decisive victory of Emmanuel Macron.
Political risk in an ongoing concern pressuring the USD as the Trump administration is immersed in a probe of Russian connections with two high profile testimonies raising more questions than the intended search for answers.
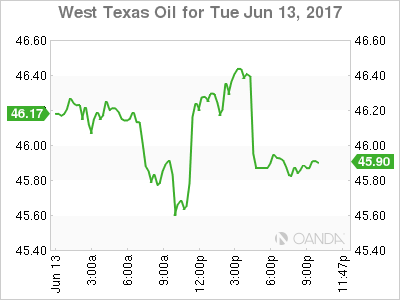
The price of oil rose 0.306 percent on Tuesday. The price of West Texas Intermediate is trading at $46.27 despite the sluggish growth of supply last year even before the Organization of the Petroleum Exporting Countries (OPEC) production cut agreement was put in place. US production has offset the efforts from the OPEC and other major producers with the major factor being stagnant demand for energy despite lower prices.
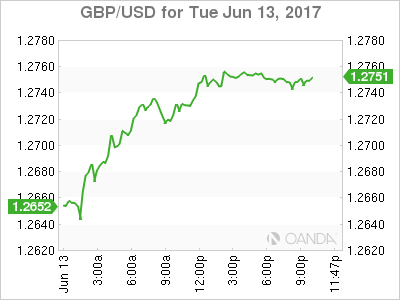
The GBP/USD gained 0.804 percent in the last 24 hours. The pound is trading at $1.2746 after a surge in inflation ahead of the Bank of England (BoE) policy meeting later this week. The GBP continues to appreciate against the dollar on the back of the results of the UK snap elections where the Conservatives lost a majority and are now looking to partner to get back into power. The probability of a softer Brexit is feeling the pound’s rise, although the fact remains that its based on a very uncertain outcome. The BoE is not expected to change its monetary policy this week, but it had already predicted higher inflation and does not have enough information to give a good assessment on the fate of Brexit.
Market events to watch this week:
Wednesday, June 14
4:30 am GBP Average Earnings Index 3m/y
8:30 am USD CPI m/m
8:30 am USD Core CPI m/m
8:30 am USD Core Retail Sales m/m
8:30 am USD Retail Sales m/m
10:30 am USD Crude Oil Inventories
2:00 pm USD FOMC Economic Projections
2:00 pm USD FOMC Statement
2:00 pm USD Federal Funds Rate
2:30 pm USD FOMC Press Conference
6:45 pm NZD GDP q/q
9:30 pm AUD Employment Change
Thursday, June 15
3:30 am CHF Libor Rate
3:30 am CHF SNB Monetary Policy Assessment
3:30 am CHF SNB Press Conference
4:30 am GBP Retail Sales m/m
7:00 am GBP MPC Official Bank Rate Votes
GBP Monetary Policy Summary
GBP Official Bank Rate
8:30 am USD Unemployment Claims
Tentative JPY Monetary Policy Statement
Friday, June 16
Tentative JPY BOJ Policy Rate
2:30 am JPY BOJ Press Conference
8:30 am CAD Core Retail Sales m/m
8:30 am USD Building Permits
Fine Fed Lines To Be Drawn
A rate hike is virtually certain in the day ahead but the communication that comes with it is a major mystery. The pound was the top performer while the yen lagged. Chinese and Japanese industrial production data is up next. The English video ahead of the Fed for Premium subscribers was posted yesterday.
A hike Wednesday is 95% priced in but beyond that is a mystery. Earlier this year, the debate was about three or four hikes but given the soft inflation data, that's been scaled back to two or three hikes. For September a 28% chance of another hike is priced in and for December it's 50/50.
The market will search for clarity in the statement, forecasts, dot plots and press conference. Most believe Yellen will signal some kind of wait-and-see stance that makes the next hike conditional on better growth and inflation.
Alternatively, the Fed could continue to insist that better numbers are right around the corner. That would be consistent with their previous stance but it would go against some of the most cautious comments from FOMC members recently.
Ultimately, how the market reacts will depend on how any shift is communicated. In the March dot plot, 5 members saw a total of four hikes in 2017, 9 saw three, 1 saw two and 2 saw no more changes. It would require six members to shift from three hikes to two in order to move the consensus; that's highly unlikely.
But the dot plot may not be the sole medium. The statement is also a complex means to signal a shift towards a more conditional approach because it's always conditional. A slight change in the line saying 'The Committee expects that economic conditions will evolve in a manner that will warrant gradual increases in the federal funds rate' could be sufficient but it's a delicate task.
Before the Fed, the focus is on China with May retail sales and industrial production up next. Consumers continue to spending with sale forecast to rise 10.7% y/y while industrial production is forecast to rise 6.4%.
Impressively, Japan was almost able to keep pace with the industrial growth in China. April production rose 5.7% in the preliminary report and final data is expected to show similar growth. Don't expect significant market moves on the Chinese or Japanese data but continue to watch the yuan fix.
Gold Inches Lower, PPI Matches Forecast
Gold has posted small gains in the Tuesday session, and is down 0.16%. In North American trade, spot gold is trading at $1263.31 per ounce. In the US, PPI dropped to 0.0%, matching the forecast. On Wednesday, we'll get a look at key retail sales and CPI reports. As well, the Federal Reserve is expected to raise interest rates by a quarter-point, to 1.00 percent. With such a large number of major events, traders should be prepared for volatility in gold prices on Wednesday.
The political turmoil in Britain could worsen and send jittery investors to safe-haven gold. It has been a week to forget for Prime Minister Theresa May, as the aftershocks of her stunning election debacle continue to rock the country. The reeling Conservatives find themselves short of a majority in parliament, and have pinned their hopes of remaining in power on reaching an agreement with the DUP, a small conservative Irish party. However, no deal has been reached as of yet, and the continuing political vacuum could push gold prices higher. Meanwhile, the Brexit negotiations are scheduled to commence on June 19, but there are signs that Europeans will ask for a delay in the start of talks, given the precarious political situation in Britain. On Tuesday, Denmark's Finance Minister, Kristian Jensen, said that he hoped that the inconclusive UK vote would lead to a "time out", so that the UK can rethink its approach to Brexit. The Europeans are delighted by May's troubles, as she will have to soften her approach her previously hard-nosed approach to Brexit. If the new government expresses a willingness to negotiate a "soft Brexit", which keeps the UK in the single market, this would be a positive development for British businesses.
The markets are keeping a close eye on the Federal Reserve, which will make an interest rate announcement on Wednesday. The markets have priced in a quarter-point hike, at close to 100%, so it would be a major shock if the Fed doesn't make a move. What's in store after that? An additional rate hike seems much less likely in the third quarter, with the CME forecasting the odds of a September move at just 28%. The markets are skeptical about another rate hike unless the political situation in Washington shows signs of stabilizing. The Trump administration remains in damage control mode, as it's difficult to assess the damage from the dramatic evidence of ex-FBI director James Comey. The Trump administration continues to lurch from one crisis to another, and President Trump seems disconnected not just from the Democrats, but from many Republican lawmakers as well. The Fed and the markets have serious concerns with regard to Trump's ability to move forward with his economic agenda, and this sentiment could weigh on the US dollar.
Strong British CPI Report Boosts Pound
The British pound has halted this week's slide in the Tuesday session. GBP/USD is up 0.65%, as it trades at 1.2740. On the release front, British CPI gained 2.9%, beating the forecast of 2.7%. This was the strongest gain in CPI since June 2013. In the US, inflation levels were far less impressive, as PPI dropped to 0.0%, matching the forecast. Wednesday promises to be busy. The UK will release wage growth and unemployment claims. Over in the US, we'll get a look at key retail sales and CPI reports. As well, the Federal Reserve is expected to raise interest rates by a quarter-point, to 1.00 percent. With such a large number of major events, traders should be prepared for volatility from GBP/USD on Wednesday.
It has been a week to forget for Prime Minister Theresa May, as the aftershocks of her stunning election debacle continue to rock the country. One of May's critics called her a "dead woman walking", but she seems determined to plod ahead and continue to lead the country. The Conservatives find themselves short of a majority in parliament, and have pinned their hopes of remaining in power on reaching an agreement with the DUP, a small conservative Irish party. However, no deal has been reached as of yet, and the continuing political vacuum could weigh on the pound, which has dropped sharply since the election. Meanwhile, the Brexit negotiations are scheduled to commence on June 19, but there are signs that Europeans will ask for a delay in the start of talks, given the precarious political situation in Britain. On Tuesday, Denmark's Finance Minister, Kristian Jensen, said that he hoped that the inconclusive UK vote would lead to a "time out", so that the UK can rethink its approach to Brexit. The Europeans are delighted by May's troubles, as she will have to soften her approach her previously hard-nosed approach to Brexit. If the new government expresses a willingness to negotiate a "soft Brexit", which keeps the UK in the single market, this would be a positive development for British businesses, and could boost the pound, which has taken a beating since the Brexit vote last June.
All eyes are on the Federal Reserve, which wraps up its policy meeting on Wednesday. The markets have priced in a quarter-point hike, at close to 100%, so it would be a major shock if the Fed doesn't make a move. What's in store after that? An additional rate hike seems much less likely in the third quarter, with the CME forecasting the odds of a September move at just 28%. The markets are skeptical about another rate hike unless the political situation in Washington shows signs of stabilizing. The Trump administration remains in damage control mode, as it's difficult to assess the damage from the dramatic evidence of ex-FBI director James Comey. The Trump administration continues to lurch from one crisis to another, and President Trump seems disconnected not just from the Democrats, but from many Republican lawmakers as well. The Fed and the markets have serious concerns with regard to Trump's ability to move forward with his economic agenda, and this sentiment could weigh on the US dollar.
Yen Hugs 110 as US Inflation Report Matches Estimate
USD/JPY is showing little movement on Tuesday, as the pair trades at the 110 level in the North American session. On the release front, Japanese BSI Manufacturing Index disappointed, with a weak reading of -2.9 points. This was well off the estimate of +1.5 points. In the US, PPI dropped to a flat 0.0%, matching the forecast. On Wednesday, the US releases key retail sales and CPI reports. As well, the Federal Reserve is expected to raise interest rates by a quarter-point, to 1.00 percent.
Central banks will be in focus this week, with interest rate announcements out of the US and Japan. All eyes are on the Federal Reserve, which holds its monthly policy meeting later on Wednesday. The markets have priced in a quarter-point hike, at close to 100%, so it would be a major shock if the Fed doesn't make a move. What's in store after that? An additional rate hike seems much less likely in the third quarter, with the CME forecasting the odds of a September move at just 28%. The markets are skeptical about another rate hike unless the political situation in Washington shows signs of stabilizing. The Trump administration remains in damage control mode, as it's difficult to assess the damage from the dramatic evidence of ex-FBI director James Comey. The Trump administration continues to lurch from one crisis to another, and President Trump seems disconnected not just from the Democrats, but from many Republican lawmakers as well. The Fed and the markets have serious concerns with regard to Trump's ability to move forward with his economic agenda, and this sentiment could weigh on the US dollar.
The BoJ will release its rate statement on Thursday. The BoJ has maintained an ultra-loose monetary policy in order to prop up inflation and domestic demand. Although the economy has recently received a boost from stronger global demand, inflation remains well below the central bank's 2.0% target, and consumer demand has been soft. The BoJ is unlikely to shift directions and tighten policy anytime soon, but analysts will be combing through the rate statement and BoJ Governor Haruhiko Kuroda's press conference, looking for nuances in BoJ language. A key component of the BoJ's policy has been bond purchases, but the bank has slowly been reducing these purchases, and could make reference to the slowdown in the bond-buying program on Thursday. If the central bank's message is more hawkish than expected, the yen could respond with gains.
Loonie Extends Gains after Poloz Echoes Wilkins’ Hawkish Comments; Pound Gains on above Expectations UK CPI
The Canadian dollar made strong gains after Bank of Canada officials' hawkish comments suggested a rate rise was nearer. Sterling was higher on forecast-beating UK inflation data. The dollar index was lower as the FOMC begins a two-day policy meeting.
The main data out of the European session was the UK CPI report which helped the pound recover some losses made following Thursday's post-UK elections tumble. However, sterling's gains may be limited due to political risks as Prime Minister Theresa May fights to secure her government as she aims strike a deal with the DUP to pass her legislative program. A deal has not been reached yet after a meeting with the DUP leader today.
Cable rose to a high of $1.2736, steadily rising throughout the session from the $1.2650 area after UK inflation jumped to its highest in nearly four years in May. The annual inflation rate rose 2.9% in May to beat both forecasts and April's rate of 2.7%. On a monthly basis, inflation rose 0.3% in May, beating expectations of a 0.2% rise but coming below April's 0.5%. Core prices rose 2.6% in the year versus 2.4% forecast, the fastest pace since late 2012.
Out of the Eurozone, the German ZEW investor confidence survey rose to 88 this month, above May's 83.9 and forecasts for a rise to 85. The data had little impact on the euro, which traded steadily against the dollar just above the key $1.1200 level to as high as $1.1224.
In the US, core PPI, the key gauge of underlying producer price pressures that excludes food, energy and trade services, rose 2.1% year-on-year, while headline PPI rose 2.4% over the past 12 months versus 2.3% expected, which would help endorse a Fed rate hike. The dollar rose versus the yen after the data to a session high of 110.21 yen. There is caution as the FOMC meeting gets underway today with a policy announcement due on Wednesday. Most economists expect the Fed to raise its benchmark rate by 25 basis points to a target range of 1.00 to 1.25% at this meeting. Fed Chair Janet Yellen is due to hold a press conference soon after the announcement. Since the Fed rate hike is widely expected already, what would be more important to investors would be to see whether there will be any details about the Fed's plans on winding down its huge balance sheet.
The Canadian dollar was one of the best performing major currencies today and touched a two-month high against the greenback. The trigger was a shift in rhetoric from the Bank of Canada after two officials made some hawkish comments that suggested the central bank was starting to make the case for a modest tightening in monetary policy later this year, much sooner than many people had thought. The BOC had until now a "lower for longer" standpoint on rates. But comments on Monday by Senior Deputy Governor Carolyn Wilkins led to a repricing of the BOC rate hike path after she stated that they were assessing whether the current monetary policy stimulus will be required going forward. She noted how the Canadian economy had improved significantly, especially first quarter growth data. BOC Governor Steven Poloz, in an interview with CBC Radio today, basically echoed Wilkins' comments and signaled that rates won't be on hold forever, mentioning that the rate cuts put in place in 2015 have largely done their work.
The USD/CAD pair dropped to $1.3223, the lowest level since April 13. The loonie's direction could also be impacted by crude oil inventory data due later today from the American Petroleum Institute. A drawdown would be supportive for the Canadian dollar, which is sensitive to oil prices. WTI oil last traded down to $45.54 a barrel.
Gold prices fell for a fifth consecutive day to touch $1259.16 an ounce, as the precious metal was being weighed down by the prospects of a Fed rate hike.
Trade Idea Wrap-up: USD/CHF – Hold short entered at 0.9720
USD/CHF - 0.9672
Most recent candlesticks pattern : N/A
Trend : Near term down
Tenkan-Sen level : 0.9682
Kijun-Sen level : 0.9682
Ichimoku cloud top : 0.9689
Ichimoku cloud bottom : 0.9687
Original strategy :
Sold at 0.9720, Target: 0.9620, Stop: 0.9720
Position : - Short at 0.9720
Target : - 0.9620
Stop : - 0.9720
New strategy :
Hold short entered at 0.9720, Target: 0.9620, Stop: 0.9720
Position : - Short at 0.9720
Target : - 0.9620
Stop : - 0.9720
The greenback met resistance at 0.9728 late last week and has retreated, retaining our bearishness and consolidation with mild downside bias remains for weakness to 0.9657 support, however, break of 0.9640 is needed to signal the rebound from 0.9613 has ended, bring retest of this level first. A break below this level would extend recent decline to 0.9600-05 (50% projection of 1.0100-0.9692 measuring from 0.9808) later.
In view of this, we are holding on to our short position entered at 0.9720. Above said resistance at 0.9728 would abort and signal a temporary low has been formed at 0.9613 last week instead, bring a stronger rebound to 0.9761 resistance but price should falter below resistance at 0.9808.

Trade Idea Wrap-up: GBP/USD – Look to sell again higher
GBP/USD - 1.2727
Most recent candlesticks pattern : N/A
Trend : Near term down
Tenkan-Sen level : 1.2699
Kijun-Sen level : 1.2688
Ichimoku cloud top : 1.2799
Ichimoku cloud bottom : 1.2715
New strategy :
Look to sell again higher
Position : -
Target : -
Stop : -
As the British pound has recovered after holding above indicated support at 1.2635, retaining our view that further consolidation would be seen and gain to 1.2750-60 cannot be ruled out, however, still reckon upside would be limited to 1.2780 and price should falter below 1.2805-10, bring another decline later.
Below 1.2680-85 would bring weakness to 1.2650 but break of said support at 1.2635 is needed to confirm recent decline has resumed for weakness to 1.2616 (previous resistance turned support) and possibly towards 1.2575-80, however, reckon downside would be limited to 1.2550. As near term outlook is mixed, would be prudent to stand aside for now.

Trade Idea Wrap-up: EUR/USD – Hold short entered at 1.1230
EUR/USD - 1.1212
Most recent candlesticks pattern : N/A
Trend : Up
Tenkan-Sen level : 1.1205
Kijun-Sen level : 1.1205
Ichimoku cloud top : 1.1215
Ichimoku cloud bottom : 1.1208
Original strategy :
Sold at 1.1230, Target: 1.1130, Stop: 1.1240
Position : - Short at 1.1230
Target : - 1.1130
Stop : - 1.1240
New strategy :
Hold short entered at 1.1230, Target: 1.1130, Stop: 1.1240
Position : - Short at 1.1230
Target : - 1.1130
Stop : - 1.1240
Although the single currency has rebounded after finding support at 1.1185 and further consolidation would be seen, as long as indicated resistance at 1.1232-37 holds, bearishness remains for weakness to 1.1180-85, break there would signal the rebound from 1.1166 has ended, bring retest of this level but below there is needed to extend the fall from 1.1285 top for retracement of early upmove to 1.1145-50 and then towards 1.1120, however, support at 1.1109 should hold from here.
In view of this, we are holding on to our short position entered at 1.1230. Only above 1.1265-70 would abort and bring retest of 1.1285, only break there would revive bullishness and confirm recent upmove has resumed and extend further gain to previous chart resistance at 1.1300, break there would encourage for headway to 1.1340-45 and later towards chart point at 1.1366.

Trade Idea Wrap-up: USD/JPY – Stand aside
USD/JPY - 110.07
Most recent candlesticks pattern : N/A
Trend : Down
Tenkan-Sen level : 110.12
Kijun-Sen level : 109.95
Ichimoku cloud top : 110.28
Ichimoku cloud bottom : 110.19
New strategy :
Stand aside
Position : -
Target : -
Stop : -
Although the greenback slipped to 109.63 yesterday, dollar needs to penetrate previous support at 109.38 to signal the rebound from last week’s low of 109.11 has ended at 110.81 and bring retest of this level. A drop below there would confirm recent decline has resumed for further fall to 109.00, then 108.75-80, however, near term oversold condition would limit downside and reckon 108.50 would hold.
If said support at 109.38 continues to hold, then further consolidation is in store and another bounce to 110.35-40 cannot be ruled out, however, upside should be limited to 110.60 and price should falter below 110.81. Only break of this resistance would signal the erratic rise from 109.11 low is still in progress for further gain to 111.00 and possibly 111.20-30 but price should falter well below resistance at 111.71, bring retreat later. As near term outlook is mixed, would be prudent to stand aside in the meantime.
