Sample Category Title
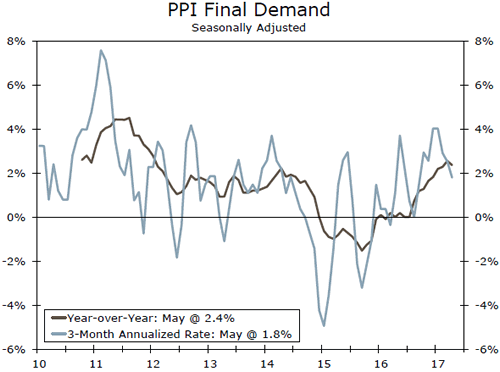
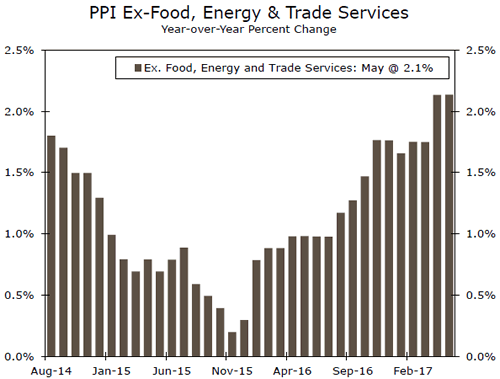
Producer Price Inflation Pauses in May
Matching expectations and coming off a sizeable, broad based gain in April, the PPI for final demand was unchanged in May. Core PPI was soft on the month as well, but the trend over the past year has been up.
Services Holding Firm
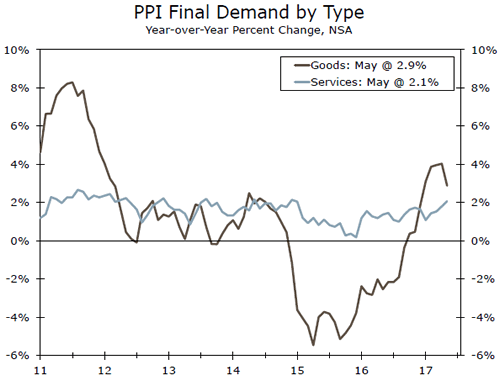
Goods prices fully retraced April's gain, dropping 0.5 percent on the month as energy prices fell 3.0 percent and wholesale food prices declined 0.2 percent.
Accounting for about two-thirds of the overall index, services prices rose 0.3 percent on the month and 2.1 percent over the past year - the fastest annual gain since December 2014.
Core Wholesale Inflation Remains Gradual
Our preferred measure of core PPI (excluding energy, food and trade services) dipped 0.1 percent on the month, but remains at its fastest annual pace on record. Pipeline price pressures also showed some signs of moderation last month as processed goods edged up just 0.1 percent and unprocessed goods fell 3.0 percent.
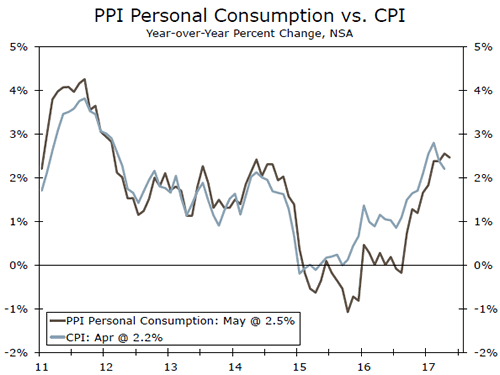
The PPI for personal consumption remained flat, supporting expectations for a modest May consumer inflation performance.
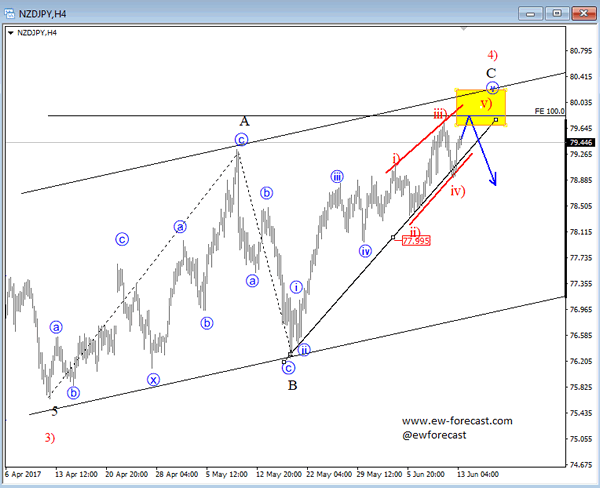
NZDJPY Trading In Final Stages Of A Big Recovery; A Reversal Can Follow
NZDJPY is trading in final stages of a higher degree three wave recovery, labeled as a big wave 4). We see current impulse higher as part of an unfolding wave C, that will ideally see limited upside around the upper channel line and Fibonacci ratio of 100. On that note, a potential ending diagonal pattern in sub-wave v of C can be unfolding, that can after its completion push price strongly into the opposite direction.
NZDJPY, 4H
Dollar Stabilizes ahead of FOMC Decision
- Equities in the US and Europe both show gains between 0.25% and 1.0% as the tech correction has apparently run its course, at least for now.
- The May NIFB small business optimism Index was unchanged at a historical high of 104.5. It suggests businesses have kept their post-Trump optimism despite signs that introducing policies will be difficult. The most sub-components showed little variation too. Worth mentioning, the employment and the actual compensation sub-indices increased.
- Finland's Sipila's Center Party and Finance Minister Petteri Orpo's National Coalition are now counting on keeping their coalition together after Foreign Minister Timo Soini and 19 loyalists formed a new legislative group and pledged support for the government.
- The German ZEW economic sentiment index was strong, but showed a mixed picture. While the current situation component rose to 88, near cycle peaks and exceeding expectations, the expectations sub-index unexpectedly dropped to 18.6 from 20.6, which was lower than expected. All in all, the release shows that the German economy is moving at full speed.
- Crude oil prices showed modest gains on Tuesday after a report showed that OPEC's output climbed in May despite an production agreement to curb supply. Nigeria and Libya offset cuts of their peers. Brent fell to $48.26/barrel from $48.67/barrel.
- UK inflation exceeded expectations in May, pushing yields sharply higher. Headline CPI rose a higher than expected 0.3% M/M and 2.9% Y/Y, up from 0.5% M/M and 2.7% Y/Y in April. Producer prices for May were in line with expectations. The higher consumer price inflation is still linked with the depreciation of sterling. We don't expect the BoE to act when they meet on Thursday, also given current political uncertainty; but we keep close eye on gilts.
- US producer prices were a tad above expectations, especially core ones. It should be welcomed by the FOMC, which is looking for some faster inflation. Indeed, headline PPI was up 2.4% Y/Y, down from 2.5% Y/Y in April, but above the expected 2.3% Y/Y. PPI excluding food and energy was up 0.3% M/M (0.1% M/M expected) and 2.1% Y/Y (up from 1.9% Y/Y previously).
Rates
Core bond yields and especially gilt yields higher
In a thinly traded session, talk about the outcome of the FOMC meeting, to be released tomorrow, dominated, even as the rise in US PPI didn't go by completely unnoticed. Core bonds moved lower in early European trading, but moved by and large sideways afterwards, with US Treasuries dropping slightly after the PPI release. The eco data (see headlines), aside from a sluggish response on the PPI, were flatly ignored. UK gilts, on the contrary, sold off in a move that started after the inflation data release. We should also mention critical words from a Bundesbank governor and FM Schaeuble regarding the ECB monetary policy, as they pushed the short end of the German curve higher. They look forward to a speedy debate on and the gradual unwinding of the unconventional measures. At the same time, ECB Liikanen defended the dovish policy stance as he said the economic recovery was not sufficiently strong to raise inflation. A substantial degree of stimulus is needed, he echoed Mario Draghi's words.
At the time of writing, the German yield curve shifted 2 (2-yr) to 2.6 bps (10-yr) higher with the 30-yr yield added slightly less (1.3 bps). The US yield curve shifts 0.8 bps (2-yr) to 1.4 bps (30-yr) higher. In the EMU bond market, the spread narrowing wave of past days continued with Greece, Portugal, Spain and Italy coming in 3-4 bps at the 10-yr tenor versus Germany.
German officials ask for a discussion on the ECB policy. Bundesbank Wuermeling said: "You don't have to be a hawk to ask for an early discussion because the process of building up neutrality in monetary policy is very very long so you have to start it early to avoid turbulence". "We still have the foot on the accelerator, and you probably won't be surprised to hear that the Bundesbank is advocating a discussion about this monetary stance". "To say that the interest rates won't be lower is half the way of the U-turn". That corroborates with our analysis of the ECB meeting that the ECB took away half of its easing bias to be able to delay the discussion on the APP programme. German FM Schaeuble spoke in a similar sense: Low interest rates have distorted risk-taking: "We need to exit current monetary policy in a timely manner" and return to "more normal policy". "It's not easy for the ECB, with all due respect"
The ECB is unlikely to include Greek bonds in its asset-purchase program for the foreseeable future, a person familiar with the matter said, as European creditors aren't prepared to offer substantially easier repayment terms on bailout loans to improve the nation's debt outlook. The euro area FMs will meet though on June 15 to discuss debt relief measures that might change the ECB viewpoint.
Currencies
Dollar stabilizes ahead of FOMC decision
Today, FX traders were in a wait-and-see modus ahead of tomorrow's FOMC decision. USD/JPY gained a few ticks as global equities recovered from the tech correction and as core bond yields rose a few basis points. EUR/USD held a tight range close to and mostly just north of 1.12 as there was little news from the EMU to guide any directional move.
Overnight, Asian equities recouped part of the yesterday's losses as the US driven tech correction eased. USD/JPY tried to regain the 110 barrier. EUR/USD lost a few ticks and dropped (temporarily) below 1.12.
There was no dominant story for FX trading. The EMU eco data were second tier and showed a mixed picture (e.g. German ZEW investor sentiment). European equities opened higher, but moved mostly sideways intraday. Core yields in the US and Europe rose a few basis points, with the interest rate differential narrowing slightly in favour of the euro. However, all this was not enough to inspire a real directional move. EUR/USD settled in a tight range in the low 1.12 area. USD/JPY tried to sustain north of 110.
The US NFIB small business confidence was in line with expectations. US PPI was marginally stronger than expected. The dollar gained a few ticks upon the release but this report again was too light to unlock the stalemate going into tomorrow's FOMC decision. EUR/USD currently trades in the 1.1210 area. USD/JPY is changing hand at around 110.15.
Sterling rebounds slightly on higher UK inflation
Today, sterling selling eased. The political uncertainty remains high, but the battle for Theresa May's political survival has apparently become less aggressive than it was over the previous days. Sterling gradually started a bottoming-out process. Mid-morning, the May UK inflation rate rose more than expected, from 2.7% to 2.9%. Core inflation was also above consensus at 2.6% Y/Y. Higher inflation might at some point lead to a difficult balancing act of for the BoE. After the release, UK bond yields rose about 6 bps. However, with growth and growth expectations declining and given the extreme degree of political and economic uncertainty, a BoE rate hike is highly unlikely in the near future. Still, sterling slightly regained ground after the inflation data, both against the euro and the dollar. EUR/USD dropped to the low 0.88 area. Cable rebounded north of 1.27. Even so, the rise of sterling was modest given the rise in UK yields. For now, we consider today's intraday rebound as a technical correction on the recent setback rather than anything else.
Bank of Canada Takes a More Hawkish Turn
Bank of Canada Senior Deputy Governor Carolyn Wilkins spoke at the University of Manitoba today. Her speech focused on the diversity, and thus strength of both the Canadian economy generally, and recent economic growth specifically. While there were caveats strewn throughout, the speech read largely hawkish, suggesting that the Bank of Canada is beginning to consider removing some of the monetary policy stimulus currently in the system.
Wilkins referred to the Canadian economy as "move[ing] past the adjustment to lower oil prices", pointing to healthy first quarter growth figures. It was duly noted that the current level of commodity prices and ongoing U.S. policy uncertainty may constrain investment to a more muted pace going forward.
Regionally, new economic models developed at the Bank of Canada to provide more timely estimates of provincial growth suggest that economic growth is beginning to broaden out across provinces as well.
Across industries, the Bank is encouraged by the breadth of growth and changing sources of growth. Wilkins noted that computer system design and related services is now as large an industry as motor vehicles and aerospace.
The labour market was also seen as encouraging and "largely consistent with the evolution of economic activity".
Softness in price measures, including core inflation and wages was noted, and seen as suggesting "ongoing spare capacity", and consistent with the lagged effects of past economic slack. At the same time, Wilkins provided a reminder that monetary policy acts with a lag - that is, the Bank of Canada is not setting monetary policy for the economy we experience today, but to shape the economy we will experience tomorrow. She likened the decision-making framework to driving a car, suggesting that if you saw a red light down the road you'd probably let up on the gas ahead of time, rather than slamming the brakes at the last second.
Key Implications
This speech definitely falls in the 'hawkish' column, continuing the recent trend in Bank of Canada communications that has taken place alongside strengthening economic data. Consistent with our research, the Bank appears to be encouraged with the breadth of economic growth that has emerged in Canada in recent quarters. The broadening of growth suggests an economy that is increasingly finding its legs and shaking off past setbacks.
Two specific remarks stand out as particularly hawkish. First, the car metaphor and its reminder to readers that monetary policy is a forward looking exercise clearly suggests that the Bank wants markets to remember that interest changes can be in more than one direction. Second, clearly a message was intended in the choice of language when stating that "Governing Council will be assessing whether all of the considerable monetary policy stimulus presently in place is still required", as well as the adjective "significant", used later to describe the current monetary stimulus.
This speech may be sending a clear signal, but don't expect the Bank of Canada to hit the hike button just yet. A significant haze of uncertainty continues to hang over the economy, and although it is likely that inflation is at or near a nadir, this has yet to be borne out in the data. Rather than signaling imminent action, today's remarks are more likely to be aimed at preparing markets for eventual monetary tightening. As economic data remains robust and inflation begins to come back, we would expect a gradual monetary tightening cycle to begin, but think this is most likely to take place in early 2018.
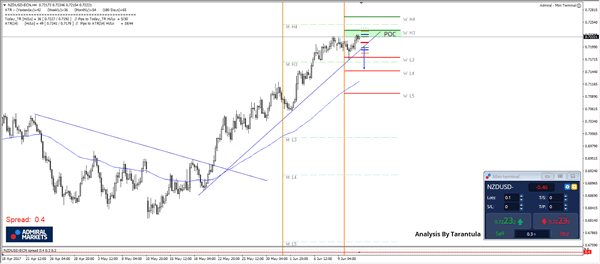
NZD/USD Close to a Possible Retracement
The NZD/USD, popular Kiwi has been in a steady uptrend since the price has broken descending trendline. The movement has been made in a steady zig zag motion which indicates a strong bullish trend. At this point the price is close to POC zone (W H3, ATR high) and the zone is kept below M H4 strong camarilla resistance. 0.7230-40 could reject the price towards the ascending trend line 0.7198 and further down to 0.7145 if trend line breaks. A violation of 0.7250 where the price breaks and closes above it, would negate a possible drop.
CAC Ticks Higher on Strong Eurozone Sentiment Report
The CAC index has reversed directions and posted slight gains on Tuesday, rising 0.31 percent. Early in the North American session, the CAC is at 5260.25 points. On the release front, French Final Nonfarm Payrolls remained at 0.4%, edging above the estimate of 0.3%. Eurozone ZEW Economic Sentiment improved to 37.7, beating the estimate of 37.2 points. On Wednesday, the eurozone publishes Employment Change and Industrial Production. In the US, it's a busy day, with the release of retail sales and CPI. As well, the Federal Reserve is expected to increase interest rates by a quarter-point to 1.00%.
The CAC started the week with losses, as European stock markets reacted to sharp losses on the Nasdaq, which dropped 1.8% on the Friday session. Heavyweight technology stocks were lower, and Apple led the downturn with losses of close to 4 percent. This had a negative impact on the French financial stocks, as BNP Paribas and Societe Generale lost ground. The French stock markets didn't show much reaction to the French parliamentary election, in President Emmanuel Macron won the most votes. The first round was held on Sunday, and the second round, slated for June 18, will determine the makeup of the 557-seat National Assembly. French President Emmanuel Macron has hit a chord with the public with his call for a united, prosperous France, and he appears headed for a massive majority in parliament. The traditional left-right divide in French politics appears to have dissolved, at least for now, as Macron's En Marche party, which is barely a year old, is poised to take over France. Macron is expected to put forward pro-business legislation, which will not sit well with the powerful labor unions. Macron wants to streamline government and overhaul labor laws, in order to kickstart the economy and create jobs. Any changes to France's generous employment benefits is bound it be contentious, but a strong majority in parliament will make Macron's job easier.
The Federal Reserve has commenced its monthly policy meeting and will issue a rate statement on Wednesday. The markets have priced in a quarter-point hike at almost 100%, which would be the second increase in 2017. The dollar is unlikely to show much movement, unless the Fed shocks and doesn't press the rate trigger. What's in store after that? The markets are skeptical about another rate hike in the second half, unless the political situation in Washington shows signs of stabilizing. The Trump administration remains in damage control mode, as it's difficult to assess the damage from the dramatic evidence of ex-FBI director James Comey. The Trump administration continues to lurch from one crisis to another, and President Trump seems disconnected not just from the Democrats, but from many Republican lawmakers as well. The Fed and the markets have serious concerns with regard to Trump's ability to move forward with his economic agenda, and this sentiment could weigh on the US dollar.
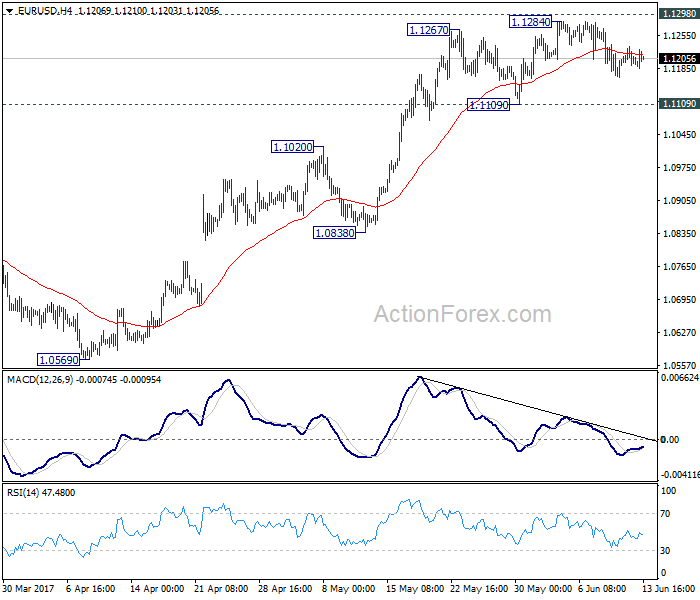
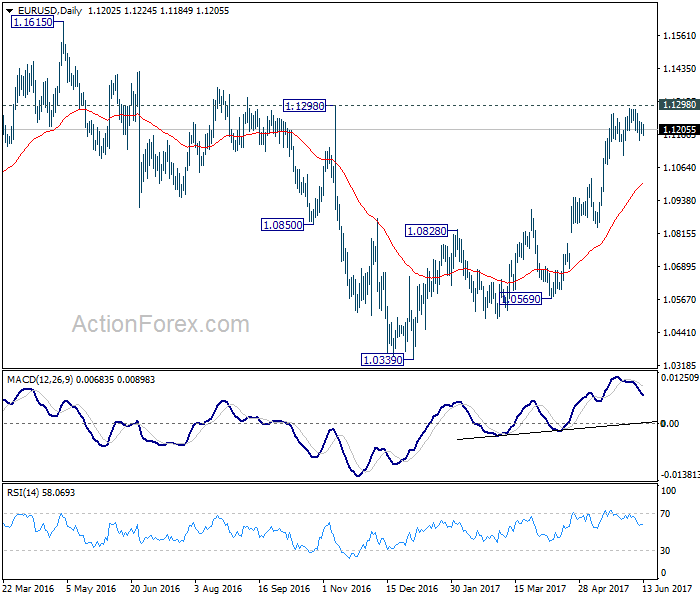
EUR/USD Mid-Day Outlook
Daily Pivots: (S1) 1.1186; (P) 1.1209 (R1) 1.1227; More....
EUR/USD is staying in consolidation below 1.1284 temporary top and intraday bias remains neutral. Focus stays on 1.1298 key resistance. Decisive break there will carry larger bullish implication and target 1.1615 resistance next. On the downside, break of 1.1109 support will indicate short term topping and rejection from 1.1298. In such case, intraday bias will be turned to the downside for 1.0838 support.
In the bigger picture, the case for medium term reversal continues to build up with EUR/USD staying far above 55 week EMA (now at 1.0922). Also, bullish convergence condition is seen in weekly MACD. Focus will now be on 1.1298 key resistance. Rejection from there will maintain medium term bearishness and would extend the whole down trend from 1.6039 (2008 high). However, firm break of 1.1298 will indicate reversal. In such case, further rally would be seen back to 1.2042 support turned resistance next.
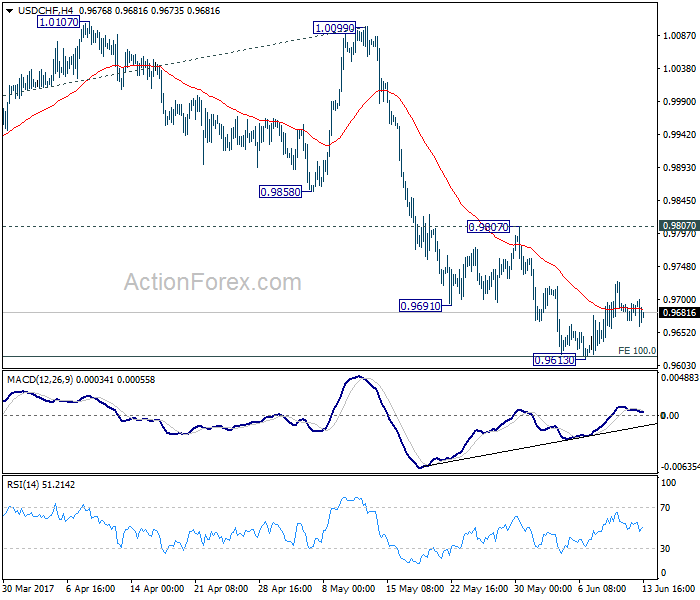
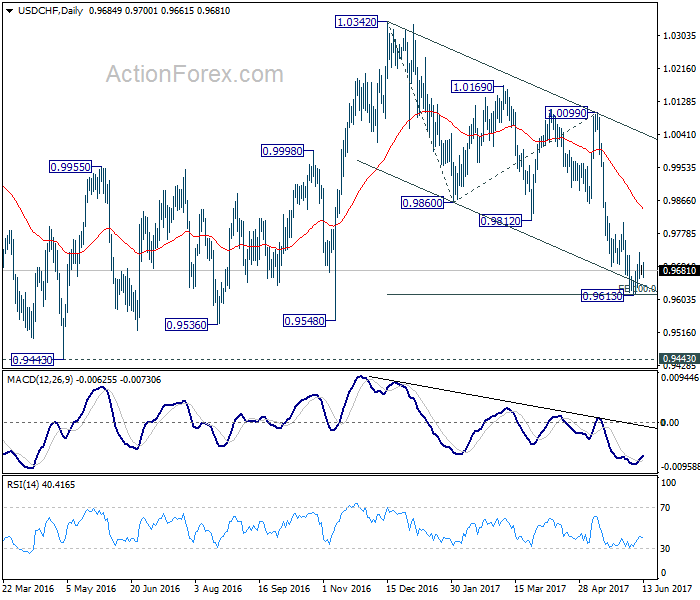
USD/CHF Mid-Day Outlook
Daily Pivots: (S1) 0.9672; (P) 0.9683; (R1) 0.9697; More.....
Intraday bias in USD/CHF remains neutral as the consolidation pattern from 0.9613 is still extending. Since 0.9807 resistance stays intact, near term outlook is cautiously bearish for further fall. Break of 0.9613 will extend the whole decline from 1.0342 to 0.9548 support and below. We'd start to look for bottoming signal again as it approaches 0.9443 key support level. However, considering bullish convergence condition in 4 hour MACD, break of 0.9807 will indicate near term reversal and turn outlook bullish for 1.0099 resistance next.
In the bigger picture, USD/CHF is still bounded in medium term range of 0.9443/1.0342 for the moment. Consolidative trading would likely continue and medium term outlook remains neutral. Break of 1.0342 key resistance is needed to confirm underlying bullish momentum in the pair. Meanwhile, downside attempts should be contained by 0.9443 key support level. However, sustained break of 0.9443 will carry larger bearish implication and target 0.9 handle.
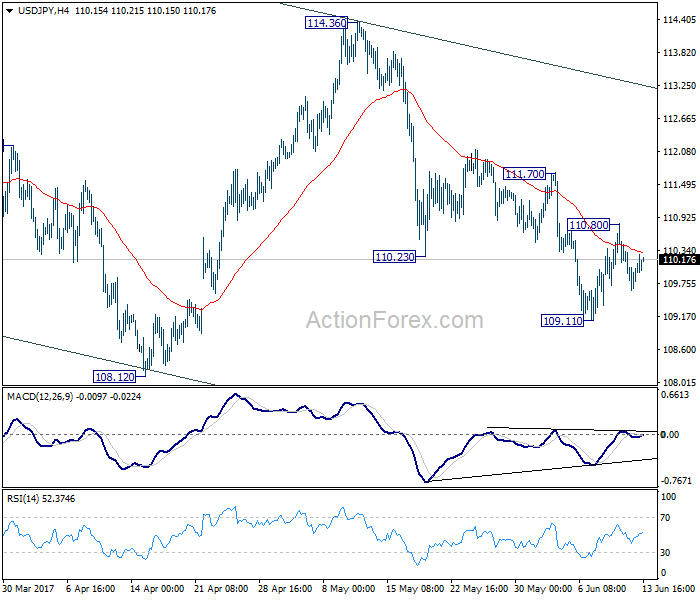
USD/JPY Mid-Day Outlook
Daily Pivots: (S1) 109.56; (P) 109.99; (R1) 110.37; More...
Intraday bias in USD/JPY stays neutral as consolidation continues in range of 109.11/110.80. Overall outlook is unchanged. With 111.70 resistance intact, , near term outlook remains mildly bearish and deeper fall is expected. Below 109.11 will target 108.12 low first. Break will extend the whole corrective fall from 118.65 to 61.8% retracement of 98.97 to 118.65 at 106.48. We will look for bottoming sign there. Meanwhile, break of 110.70 will indicate near term reversal and turn bias back to the upside for 114.36 resistance instead.
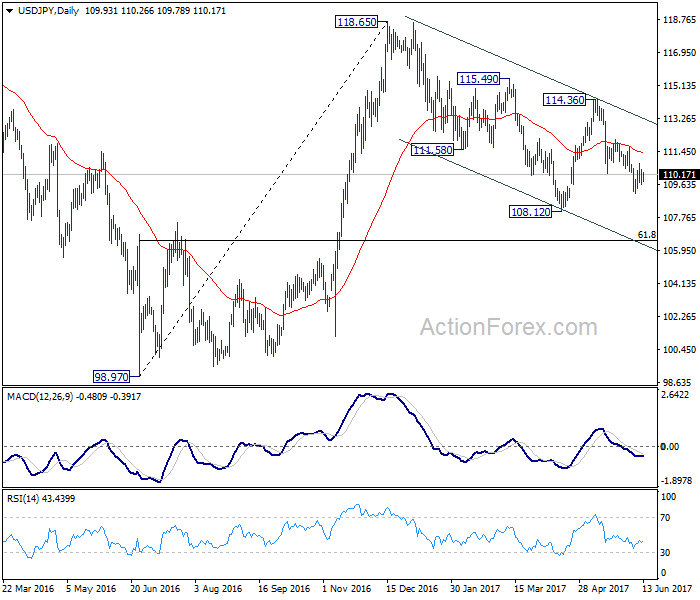
In the bigger picture, price actions from 125.85 high are seen as a corrective pattern. It's uncertain whether it's completed yet. But in case of another fall, downside should be contained by 61.8% retracement of 75.56 to 125.85 at 94.77 to bring rebound. Overall, rise from 75.56 is still expected to resume later after the correction from 125.85 completes.
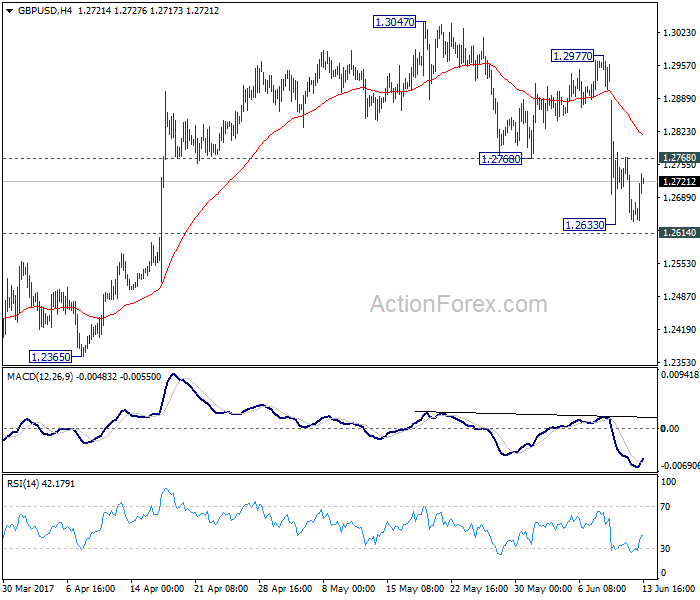
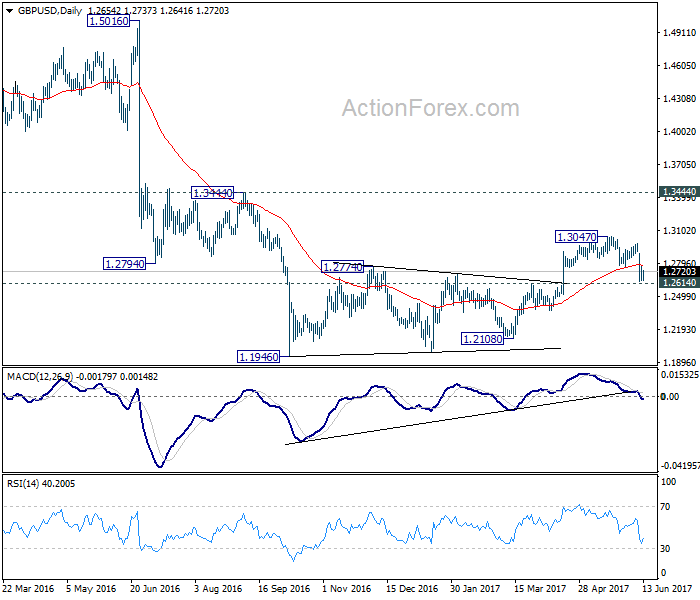
GBP/USD Mid-Day Outlook
Daily Pivots: (S1) 1.2608; (P) 1.2689; (R1) 1.2739; More...
A temporary low is in place at 1.2633 and intraday bias in GBP/USD is turned neutral for consolidation. While stronger recovery might be seen, upside should be limited below 1.2977 resistance to bring fall resumption. At this point, we're favoring the case that consolidation pattern from 1.1946 has completed at 1.3047 already. Decisive break of 1.2614 resistance turned support would confirm our bearish view and target a test on 1.1946 low next. However, break of 1.2977 will dampen our view and turn bias back to the upside for 1.3047 and above.
In the bigger picture, fall from 1.7190 is seen as part of the down trend from 2.1161. Price actions from 1.1946 medium term low are seen as a consolidation pattern, which could have completed after hitting 55 week EMA. Break of 1.1946 low will target 61.8% projection of 1.5016 to 1.1946 from 1.3047 at 1.1150 next. In case the consolidation from 1.1946 extends, outlook will stay remain bearish as long as 1.3444 resistance holds.