Sample Category Title
Loonie BoC Comments Favors CAD
Overnight, equities have advanced as the global selloff in technology shares showed signs of easing, while sterling has found some support as PM May tries to secure the votes needed to prop up her minority government and on stronger than expected U.K CPI data this morning.
Despite the tech selloff and political uncertainties, on either side of the Atlantic, stocks are still trading atop of their respected all-time highs.
Later today, U.S AG Jeffrey Sessions will testify publicly before the Senate Intelligence Committee to explain his role in the firing of James Comey and contacts that he and associates of President Donald Trump had with Russian officials.
Also, the Fed begins its two-day meeting where it's expected to raise their benchmark interest rate for the second time this year tomorrow (2:00 pm EDT) and provide more information on its balance sheet wind-down.
Nonetheless, with stalling U.S inflation, the market is becoming increasingly doubtful that the Fed will be able to stick to their anticipated pace of tightening of three interest rate rises this year and next.
Note: Bank of Japan (BoJ), Swiss National Bank (SNB) and Bank of England (BoE) are also scheduled to weigh in with policy decisions this week.
1. Stocks mixed results
In Japan, the Nikkei share average trimmed a bulk of this week's early losses and steadied overnight, as the impact from a slide in U.S technology stocks eased. The Nikkei inched down -0.05%, while the broader Topix rallied + 0.1%.
Down-under, Australia's benchmark S&P/ASX 200 climbed +1.7%, with energy and financial shares leading the way as investors returned from a holiday.
Elsewhere in Asia, South Korea's Kospi added +0.7%, while Hong Kong's Hang Seng increased +0.4% and the Shanghai Composite Index advanced +0.4%.
In Europe, the main indices have rebounded this morning after yesterday's selloff being led by the FTSE MIB (Italy), which is higher, by +1%. Tech names are leading the charge.
U.S stocks are expected to open in the ‘black' (+0.2%).
Indices: Stoxx50 +0.5% at 3560, FTSE +0.2% at 7528, DAX 0.5% at 12758, CAC-40 +0.5% at 5263, IBEX-35 +0.6% at 10907, FTSE MIB +0.9% at 21105, SMI +0.6% at 8863, S&P 500 Futures +0.2%.
2. Oil rises on Saudi pledge to make real supply cuts, gold steady
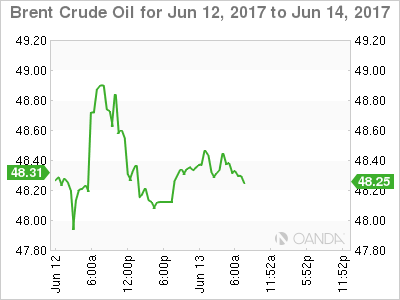
Oil prices are better bid ahead of the U.S open after Saudi Arabia said it would make significant export cuts in July, though increasing U.S output, in particular shale producers, continues to weigh on the market.
Brent crude futures is at +$48.64 per barrel, up +35c, while benchmark U.S crude (WTI) is at +$46.38 per barrel, up +30c.
Note: In H1, there were doubts over OPEC's compliance with its own pledges, however, Saudi officials now say they are making real cuts, including -300k bpd to Asia for July.
Trade data shows OPEC shipments averaged around +26m bpd in H2, 2016, while they are set to average around +25.3m bpd in H1, 2017.
The drive to find new oil has pushed up U.S output by over +10% since mid-2016, to +9.3m bpd. The EIA expects this number to push above the +10m benchmark next year.
For the oil ‘bear' U.S production undermines any effort led by OPEC to cut almost -1.8m bpd of production until the Q1, 2018 in order to prop up global prices.
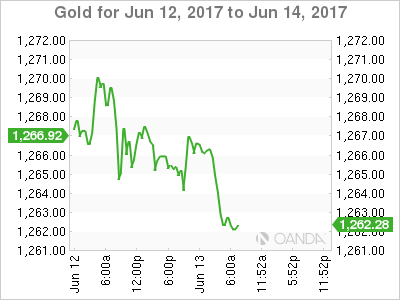
Ahead of the U.S open, Gold is holding steady (-0.1% at +$1,264.01 per ounce) as investors remained cautious ahead of the Fed meeting that is likely to provide hints on the central bank's interest rate policy for the remainder of the year.
3. Yields back up ahead of Fed announcement
Hectic new U.S debt sales had yields backing up stateside Monday – Treasury sold more than +$100B new debt via four offerings with maturities spanning from 3-months out to 10-years.
Note: A +$12B sale of 30-year bonds along with a four-week bill auction are due this morning.
The Fed is scheduled to announce its rate policy decision tomorrow afternoon, followed by Fed Chairwoman Janet Yellen's press conference.
Yesterday's three-year notes attracted the strongest overall demand since December 2015. The +65.6% indirect bidding was way above the average of +51.1% for the past six sales.
The result suggests many investors are looking beyond tomorrow's expected hike and anticipate a slow path of tightening from the Fed going forward.
The yield on U.S 10's fell less than -1 bps to +2.21%, after rising for four straight sessions.
Elsewhere, U.K, Germany and French benchmark yields all rose one basis point, while the Aussie benchmark yield is little changed at +2.40%.
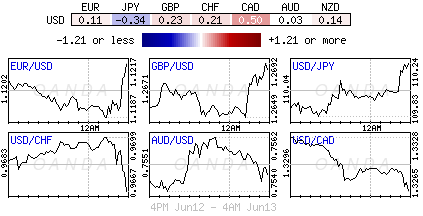
4. Dollar's mixed feelings
The ‘mighty' dollar is little changed overnight ahead of tomorrow's Fed decision.
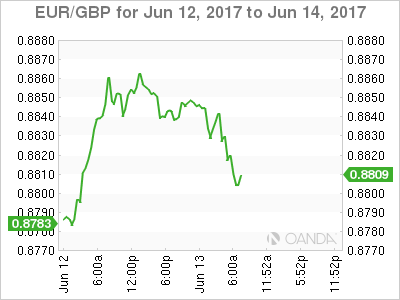
The pound (£1.2704) has found some support in early trade after U.K May CPI data was higher than expected this morning (see below). It remains above the Bank of England's (BoE) target for a fourth consecutive month to its highest level in four years. Sterling ‘bulls' believe that last week's snap election results have reduced the odds for a “hard” Brexit actually occurring is also supporting the pound.
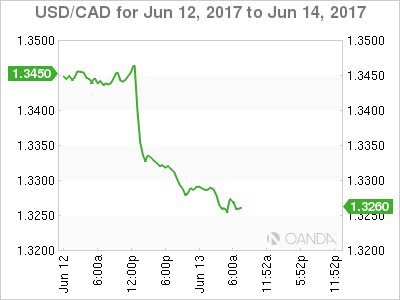
USD/CAD (C$1.3268) continues to trend lower, trading atop of its two-month lows following ‘hawkish' comments from Bank of Canada's Deputy Governor Carolyn Wilkins yesterday pointing out that the central bank may consider curtailing its accommodative monetary policy in view of the broadening economic growth.
5. U.K inflation jumps in May, German sentiment falls
Data this morning showed that consumer prices in the U.K rose last month at the fastest annual rate for almost four-years, intensifying a squeeze on households just as the country faces a prolonged spell of political uncertainty.
Annual inflation in May jumped to +2.9%, the fastest rate of price-growth since June 2013. The market consensus was expecting inflation to hold steady at April's +2.7% rate.
Note: The U.K consumer has been feeling the squeeze from rising prices since last June's Brexit vote caused a sharp fall in the pound (£1.50 to £1.2707). Making it more difficult is that U.K wage growth is not keeping pace with inflation.
Digging deeper, the pickup in inflation in May was driven by rising prices for packaged vacations, toys and games and computer equipment. Clothing, footwear and household electricity prices also rose.
Note: The BoE is expected to keep the U.K.'s benchmark interest rate steady on Thursday.
Elsewhere, according to the ZEW think tank this morning, German economic sentiment dropped in June – expectations fell to 18.6 from 20.6 in May, which is below the indicator's long-term average of 23.9. The market was expecting a slight increase in the expectations component to 21.5.
It’s All About The Sterling
The Sterling nudged higher during Tuesday's trading session as investors made an effort to accept the reality of last week's shock UK election outcome which resulted in a nightmare “hung parliament”. Regardless of the current upside gains, the British Pound remains vulnerable to heavy losses with the outlook tilted to the downside as political instability in the UK weighs heavily on the currency. This period of uncertainty is likely to leave investors on edge as questions are raised over the impact the general election results will have on Brexit negotiations.
Although a hung parliament has heavily restricted May's ability to deliver the hard Brexit that some had feared, and has even sparked optimism for a softer exit from the European Union, Sterling continues to be overshadowed by the current instability in Westminster.
Theresa May seeks DUP lifeline
With the conservatives eight seats short of forming a government, Theresa May has turned to the Democratic Unionist Party (DUP) for support in a bid to staying in power. Although Sterling could find itself buoyed in the short term if May secures a deal with the DUP on Tuesday when parliament sits for the first time since the election, I feel it may have little impact on the longer term bearish bias. Even if Conservatives are able to achieve the eight seats needed to pass laws in parliament, this is still a far cry from the strong and stable government which was promised in the election campaign.
Political instability delays Brexit talks
Recent reports of the EU's Chief Negotiator, Michel Barnier, and UK's Secretary of State for Exiting the European Union, David Davis, failing to reach an agreement on an official date for opening Brexit talks has fanned fears of complications in the early stages of the negotiations.
With political instability in Westminster potentially complicating and adding more pressure to Brexit talks, which already has a tight deadline, the UK remains in a vulnerable position. With negotiation dates now up in the air and the UK government desperately attempting to stabilize, it will be interesting to see how the European Union reacts.
UK inflation hits 4 year high
The Brexit-inspired currency depreciation has propelled inflation in the UK to uneasy levels with consumer prices hitting a four-year high at 2.9% in May. With wage growth failing to keep up with inflation, consumers are likely to feel the pinch which may fan concerns over the sustainability of the UK's consumer-driven economic growth.
Are Sterling bears back in town?
The bearish price action on Sterling since the election outcome last week suggests that those who were passionately bullish on the currency could be having second thoughts. With Theresa May's gamble to strengthen her hand ahead of the Brexit negotiations back firing and sparking chaos in Westminster, the British Pound remains vulnerable to further downside.
From a technical standpoint, the GBPUSD is heavily bearish on the daily charts. Previous support around 1.2775 could transform into a dynamic resistance that encourages a decline towards 1.2600
Dollar edges lower ahead of FOMC
The main event risk for the Greenback this week may be Wednesday's heavily anticipated Federal Open Market Committee statement. With the CME Group's FedWatch tool showing a near 100% probability that the Federal Reserve will raise US interest rates in June, most of the focus may be directed towards when the central bank will next raise US interest rates in 2017. A lack of clarity from the Fed regarding future monetary policy and interest rate hike timings may pressure the US Dollar further. From a technical standpoint, the Dollar Index remains pressured on the daily charts. A breakdown below 97.00 should encourage a further depreciation towards 96.50.
WTI Crude hovers above $46
Oil prices were slightly supported during Tuesday's trading session after Saudi Arabia stated that it would make export cuts in July in an effort to tighten oil markets. While short term bulls may benefit from the speculative boosts in prices caused by Saudi Arabia's statement, this does not change the longer term bearish dynamics. With oversupply concerns a key theme, and there still being a risk of US Shale production sabotaging OPEC's efforts to rebalance the oil markets, sentiment towards the commodity remains bearish. Technical traders may see the price fail to stabilize above $46 with repeated weakness below this level opening a path towards $45.
DAX Edges Higher On Upbeat Eurozone Economic Sentiment
The DAX index has posted gains in the Tuesday session, and is up 0.55 percent. The index is currently at 12,757.75 points. On the release front, German ZEW Economic Sentiment dipped to 18.6, missing the forecast of 21.6 points. However, Eurozone ZEW Economic Sentiment improved to 37.7, beating the estimate of 37.2 points. In the US, the Federal Reserve is expected to increase interest rates by a quarter-point.
European stock markets were slightly lower on Monday, as a result of sharp losses on the Nasdaq, which dropped 1.8% on the Friday session. Major technology stocks such as Facebook, and Google were all down by more than 3 percent, and Apple led the downturn with losses of close to 4 percent. Key German financial stocks responded with losses, notably Deutsche Bank and Commerzbank.
Unlike the stunning election in the UK, which has left the country in a political vacuum, there was little surprise following the parliamentary elections in France. The first round was held on Sunday, and the second round, slated for June 18, will determine the makeup of the 557-seat National Assembly. French President Emmanuel Macron has hit a chord with the public with his call for a united, prosperous France, and he appears headed for a massive majority in parliament. The traditional left-right divide in French politics appears to have dissolved, at least for now, as Macron's En Marche party, which is barely a year old, is poised to take over France. Macron is expected to put forward pro-business legislation, which will not sit well with the powerful labor unions. Macron wants to streamline government and overhaul labor laws, in order to kickstart the economy and create jobs. Any changes to France's generous employment benefits is bound it be contentious, but a strong majority in parliament will make Macron's job easier.
All eyes are on the Federal Reserve, which holds its monthly policy meeting later on Wednesday. The markets have priced in a quarter-point hike, which would be the second increase in 2017. The likelihood continues to hover around the 90% level, so it would be a shock if the Fed did not make a move. What's in store after that? An additional rate hike seems much less likely in the third quarter, with the CME forecasting the odds of a September move at just 26%. The markets are skeptical about another rate hike in the second half, unless the political situation in Washington shows signs of stabilizing. The Trump administration remains in damage control mode, as it's difficult to assess the damage from the dramatic evidence of ex-FBI director James Comey. The Trump administration continues to lurch from one crisis to another, and President Trump seems disconnected not just from the Democrats, but from many Republican lawmakers as well. The Fed and the markets have serious concerns with regard to Trump's ability to move forward with his economic agenda, and this sentiment could weigh on the US dollar.
USDCAD Bearish after Breaking Below 200-Day Moving Average
USDCAD has turned bearish after breaking below the 200-day moving average today, reaching a 2-month low of 1.3256. RSI is falling and suggests a further possibility of a deeper decline with scope to target the April 13 low of 1.3222.
The market was trading in a range since May 25 until this week, between 1.3400 and 1.3546. But a failure to make a sustained break above the 50-day moving average led to weakness in upside momentum, with prices eventually giving way to drop below what was key psychological support at 1.3400. Meanwhile, the 50% Fibonacci retracement level at 1.3507 of the rise from 1.3222 to 1.3792 was acting as a strong barrier to the upside.
With the market now almost having retraced all of the uptrend from April to May, the trend has shifted to a more neutral one in the medium term. What appeared to be a bullish phase in progress from the 1.3000 area (rise from February) to the peak at 1.3792 (May 5) has now been negated. The oscillator studies support the bearish bias in the market, with RSI and MACD turning down and in bearish territory.
Technical Outlook: US Oil – Break Above 10SMA Needed To Trigger Extended Recovery
Oil price ticked higher on Tuesday, attempting to stabilize above $46.00 handle, for renewed attempt towards initial barriers at $46.79/92 (Fibo 23.6% of $51.98/$45.19 descend / falling 10SMA), after rally on Monday saw strong upside rejection at $46.69.
Initial signs of recovery are building after recent bears found footstep at $45.19/25 (lows of 08/09 June) where basing attempt is seen.
Slow stochastic on daily chart reversed from oversold territory and is signaling correction, with signs from Saudi Arabia for making significant oil export cut in July, additionally supporting oil price.
Firm break above falling 10SMA is needed to signal further recovery which may extend towards barriers at $47.78 (Fibo 38.2%) and $48.48 (05/06 June lower platform).
Conversely, failure to clear 10SMA pivot would signal extended consolidation and keep the downside at increased risk.
Res: 46.79, 46.92, 47.17, 47.78
Sup: 46.00, 45.65, 45.19, 44.81
Canadian Dollar Outperforms on Rate Hike Probability; Dollar Steady ahead of Fed
The Canadian dollar was one of the top performing major currencies after gaining on hawkish comments from a Bank of Canada official. The pound remained soft while the dollar index was little changed before Wednesday's Federal Reserve policy decision.
Bank of Canada Senior Deputy Governor Carolyn Wilkins' comments yesterday raised the probability of a rate hike by year-end. Wilkins said the central bank would assess if it needs to keep interest rates at near-record lows as the Canadian economy grows. The loonie rallied sharply in reaction to her comments, with the USD/CAD pair dropping to an eight-week low of $1.3273 and resulting in a break of the 100-day and 200-day moving averages.
The pound remained below the key $1.2700 level it had fallen under on Monday, trading mostly flat around $1.2660 during the Asian session. On Friday, cable fell to $1.2634, the lowest since May 18. Focus turns to UK CPI data due later today. Meanwhile, investors will also closely watch the Bank of England meeting on Thursday, at which the benchmark rate is expected to remain at 0.25%.
The euro retreated against the dollar to trade below the key $1.1200 level. German ZEW data are due later today.
The dollar edged higher against the yen to rise above 110 yen ahead of a widely expected interest rate rise by the Fed tomorrow. The FOMC begins its two-day policy meeting today. The dollar index, which tracks the greenback against a basket of trade-weighted currencies, was little changed in Asian trading but remained above the 97 level after rising yesterday.
The Fed is expected to announce tomorrow that it will raise the Fed funds rate for the second time this year, to a target range of 1.00 to 1.25%. But investors will be mostly looking to see if the US central bank will also provide more detail on its plans to shrink its huge balance sheet. Meanwhile, US PPI data are due later today.
The aussie fell after the NAB Business survey out of Australia today, which saw a drop from April. The index fell 6 points to +7 in May, but it is still higher than the long run average and shows that the business sector is still looking upbeat. Business conditions are still high at +12 index points. The aussie slid after the data to reach a low of $0.7538 after hitting an earlier high of $0.7564.
Gold was little changed and mostly traded around $1,265.50 an ounce, after four straight days of losses. The precious metal was weighed by market expectations of a Fed rate hike this week.
Oil prices rebounded after sliding yesterday, with WTI crude edging up to a high of $46.35 a barrel. This was mainly a reaction to news that Saudi Arabia, a major oil exporter, would make significant supply cuts to customers such as the US and Asia. Meanwhile, focus will be on API data due later today that are forecast to show crude inventories declined after an unexpected rise shown in the previous report.
Market Update – European Session: UK Inflation Mear 4-Year Highs
Notes/Observations
UK May CPI data higher than expected and remained above BOE target for 4th straight month and highest level since Jun 2013
Likelihood of hard Brexit recedes after UK election
Fed begins 2-day meeting and poised to raise interest rates and provide more detail on balance sheet wind-down
Overnight
Asia:
BOJ's Amamiya: will continue necessary monetary policy steps to achieve stable prices. Amount of BOJ's JGB purchases fluctuated; recent slowdown in bond buying was a result of attempt to guide interest rates appropriately
China Banking Regulator (CBRC): Cannot avoid some institutions being wound down; do not expect banking crisis in China economy
Europe:
Lawmaker: UK PM May recognized a broader consensus needed to be built for Brexit; no dissenting voices at the meeting on Monday. PM May said she would serve as long as Tories wanted her and recognized need for broader consensus on Brexit plan. Made clear she will talk to all wings of the party regarding Brexit
Tory and Labour parties said to have held private talks on a soft Brexit. Discussions have occurred on a potential cross-party Brexit commission to agree on common ground
EU's Barnier stated that there was no more time to lose on Brexit talks. UK risked ‘crashing out of EU' in March 2019 without a deal if it wasted more of the limited time available for Brexit talks. Urged UK to start talks very quickly as subjects were extraordinarily complex. EU was ready as soon as UK was ready
EU Commission reportedly plans to present proposals on euro clearing on Tuesday, Jun 13th; to keep option to force euro-denominated clearing business to move from London to the EU bloc
ECB said to be unlikely to include Greece in its QE bond buying operation in coming months. European creditors are not prepared to offer substantially easier repayment terms on bailout loans to improve the nation's debt outlook
Americas:
US Treasury released report on principles of financial regulation, recommends ~100 changes to financial rules. Urged simpler definition of proprietary trading and covered funds rather than the Volcker repeal
BOC's Wilkins: Bank of Canada to assess whether reduced stimulus was needed
Economic Data
(DE) Germany May Wholesale Price Index M/M: -0.7% v +0.3% prior; Y/Y: 3.1% v 4.7% prior
(ES) Spain May Final CPI M/M: -0.1% v -0.1%e; Y/Y: 1.9% v 1.9%e
(ES) Spain May Final CPI EU Harmonized M/M: 0.0% v 0.0%e; Y/Y: 2.0% v 2.0%e
(ES) Spain May CPI Core M/M: No est v 1.2% prior; Y/Y: 1.1%e v 1.2% prior
(SE) Sweden May CPI M/M: +0.1% v -0.1%e; Y/Y: 1.7% v 1.6%e
(SE) Sweden May CPI CPIF M/M: +0.1% v -0.1%e; Y/Y: 1.9% v 1.7%e, CPI Level: 321.74 v 321.23e
(UK) May CPI M/M: 0.3% v 0.2%e; Y/Y: 2.9% v 2.7%e; CPI Core Y/Y: 2.6% v 2.3%e; CPIH Y/Y: 2.7% v 2.6%e
(UK) May RPI M/M: 0.4% v 0.3%e; Y/Y: 3.7% v 3.5%e; RPI Ex Mortgage Interest Payments (RPIX) Y/Y: 3.9% v 3.8%e
(UK) May PPI Input M/M: -1.3% v -0.5%e; Y/Y: 11.6% v 13.5%e
(UK) May PPI Output M/M: 0.1% v 0.1%e; Y/Y: 3.6% v 3.6%e
(UK) May PPI Output Core M/M: 0.1% v 0.2%e; Y/Y: 2.8% v 2.9%e
(DE) Germany Jun ZEW Current Situation Survey: 88.0 v 85.0e; Expectation Survey: 18.6 v 21.7e
(EU) Euro Zone Jun ZEW Expectations Survey: 37.7 v 35.1 prior
Fixed Income Issuance:
(CL) Chile opened its book to sell EUR-denominated 1.875% 2030 bond; guidance seen low 60bps area to mid-swaps
(NL) Netherlands Debt Agency (DSTA) sold €2.3B vs. €3.0B indicated in 0.75% 2027 DSL bonds; Avg yield: 0.474% v 0.570% prior
(ES) Spain Debt Agency (Tesoro) sold total €4.97B vs. €4.5-5.5B indicated range in 6-month and 12-month Bills
(IT) Italy Debt Agency (Tesoro) sold total €5.5B vs. €4.5-5.5B indicated range in 2020 and 2024 BTP Bonds
Sold €2.5B vs. €2.0-2.5B indicated range in 0.35% Jun 2020 BTP bonds; Avg Yield: 0.15% v 0.37% prior; Bid-to-cover: 1.51x v 1.51x prior
Sold €3.0B vs. €2.5-3.0B indicated range in 1.85% May 2024 BTP bonds; Avg Yield: 1.35% v 1.65% prior; Bid-to-cover: 1.37x v 1.44x prior
SPEAKERS/FIXED INCOME/FX/COMMODITIES/ERRATUM
Equities
Indices [Stoxx50 +0.5% at 3560, FTSE +0.2% at 7528, DAX 0.5% at 12758, CAC-40 +0.5% at 5263, IBEX-35 +0.6% at 10907, FTSE MIB +0.9% at 21105, SMI +0.6% at 8863, S&P 500 Futures +0.2%]
Market Focal Points/Key Themes European Indices rebound this morning after yesterday's selloff being led by the FTSE MIB which is higher by ~1%. Tech names are rebounding after sharp falls yesterday, with Nasdaq futures some 80 handles off yesterday lows. Shares of Capita outperforms after a positive trading statement, whilst Merlin Entertainment trades lower after noting recent terror events in the UK have impacted business. In M&A news Monitise is sharply higher after Fiserv UK is to acquire the company, while Kennedy Wilson Europe trades higher after receiving an alternative proposal.
Equities
Consumer discretionary [ Ashtead [AHT.UK] +1.2% (Earnings), Merlin Ent [MERL.UK] -3% (Trading update), Capita [CPI.UK] +12.5% (Trading update)]
Financials: [Vestjysk Bank [VJBA.DK) -30% (New Capital plan)
Technology: [Monitse [MONI.UK] +24% (To be acquired by Fiserv UK)]
Healthcare: [KIadis Pharma [KDS.NL] -16% (private placement)]
Utilities: [Utility Warehouse [TEP.UK] -7% (Earnings)] -Real Estate [Kennedy Wilson Europe [KWE.UK] +8% (Kennedy Wilson Holdings provides alternative offer including cash component)]
Speakers
France PM Philippe stated that it had doubts about 2017 budget deficit to GDP target
Sweden Central Bank (Riksbank) Gov Ingves reiterated view that rising household debt was a threat to domestic stability
ECB's Lautenschlaeger (Germany): message to UK banks: obtaining a license takes some time, so don't put off applying for one for too long
Bank of Spain (BOS) updated its economic growth forecasts which raised GDP forecasts for 2017 thru 2019 period. Raised 2017 GDP growth forecast from 2.8% to 3.1%. Raised 2018 GDP growth forecast from 2.3% to 2.5% and 2019 GDP growth forecast from 2.1% to 2.2%. It forecasted end-2017 unemployment rate at 16.5% and at 13.2% by end-2019
EU leaders to affirm commitment to Paris climate agreement during the Jun 22-23rd summit
ZEW Economists noted that growth over the coming six months expected to remain positive
Business industry lobby Confindustria saw Italy May industrial output +0.5% m/m
Czech Central Bank Financial Stability Report: Raised its counter-cyclical buffer to 1% due to rapid credit growth, effective from July 2018. Domestic financial sector remained stable; still highly resilient to potential adverse shocks. Saw risk of continued housing market spiral; needed to create buffers for worse times
Bank of Korea (BOK) May Minutes saw one member note that loose fiscal policy reduced need for loose monetary conditions. Member also added that Fed normalization could raise Korea's neutral rate. Economy to grow faster than April forecast
South Korea Dep Trade Min Lee-In-Ho: Holding meetings to discuss responses to US trade policy
OPEC launches Annual Statistical Bulletin noted that total exports of crude oil from OPEC Member Countries stood at 25.01M bpd in 2016, up from 23.49M bpd in 2015. This increase represents a 6.5 per cent growth rate y/y
Colombia Central Bank Gov Echavarria: 2017 inflation seen near 4% and added that GDP growth of 1.8% was not good
Currencies
USD was mixed in quiet trading on Tuesday. Fed begins 2-day meeting and poised to raise interest rates and provide more detail on balance sheet wind-down
GBP/USD was steady. Dealers saw 1.2615 as the pair's line in the sand for technically oriented investors defining a bear market from a bull market scenario. Renewed pressure on the economy from rising inflation marks another big challenge. UK May CPI data was higher than expected and remained above BOE target for 4th straight month to its highest level since Jun 2013. Dealers noted that the likelihood of hard Brexit receded after UK election. GP/USD holding above 1.27 just ahead of the NY morning.
USD/CAD continued to trend lower to 2-month lows following hawkish comments from Bank of Canda's Wilkins on Monday where she raised the prospect that an interest rate rise could come sooner than anticipated. CAD strengthened to test 1.3270 area during Asia and early EU session.
Fixed Income
Bund futures trade at 164.87 down 27 ticks, following mixed German ZEW survey data. Resistance lies near the 165.25 level followed by 165.95. A break of the 164.65 support level could see lows target 163.70 followed by 160.30.
Gilt futures trade at 129.45 lower by 35 ticks, extending declines after UK CPI came in hotter than expected across the board. Gilts are collapsing after yesterday's high of 129.80. Price still finds initial support at the 129.14 level, with key support at the 128.27 support level. An acceleration lower could test the 127.43 region. Resistance remains the 129.75 level followed by 130.28.
Tuesday's liquidity report showed Monday's deposits rose to €610.5B from €601.3B prior. Use of the marginal lending facility fell to €85M from €122M prior.
Corporate issuance saw over $8.7B come to market via 10 issues headlined by Bank of Montreal $2B in an 2-part senior unsecured note offering and Vulcan Materials $1B in a 3-part senior unsecured note offering
Looking Ahead
05:30 (UK) Weekly John Lewis LFL sales data
05:30 (EU) ECB allotment in 7-Day Main Refinancing Tender
05:30 (HU) Hungary Debt Agency (AKK) to sell 3-month Bills
05:30 (BE) Belgium Debt Agency (BDA) to sell 3-Month and 12-Month Bills
06:00 (US) May NFIB Small Business Optimism: 104.5e v 104.5 prior
06:00 (IL) Israel May Trade Balance: No est v -$1.6B prior
06:00 (TR) Turkey to sell 2019, 2024 and 2027 bonds
06:30 (IS) Iceland to sell Bills - 06:30 (EU) Estonia's Orlova Speaks on EU Presidency, Trade in Brussels
06:45 (US) Daily Libor Fixing - 07:45 (US) Weekly Goldman Economist Chain Store Sales
08:00 (PL) Poland Apr Current Account: -€0.3Be v -€0.8B prior; Trade Balance: -€0.4Be v -€0.2B prior, Exports: €15.7Be v €17.8B prior, Imports: €15.9Be v €18.0B prior
08:00 (PL) Poland May CPI Core M/M: 0.1%e v 0.6% prior; Y/Y: 1.0%e v 0.9% prior
08:00 (BR) Brazil Apr Retail Sales M/M: -0.6%e v -1.9% prior; Y/Y: -2.0%e v -4.0% prior
08:00 (BR) Brazil Apr Broad Retail Sales M/M: +0.2%e v -2.0% prior; Y/Y: -2.9%e v -2.7% prior
08:00 (PT) Portugal PM Costa
08:15 (DE) Chancellor Merkel delivers remarks at German `Digital Summit'
08:15 (UK) Baltic Dry Bulk Index
08:30 (US) May PPI Final Demand M/M: 0.0%e v 0.5% prior; Y/Y: 2.3%e v 2.5% prior
08:30 (US) May PPI Ex Food and Energy M/M: 0.2%e v 0.4% prior; Y/Y: 1.9%e v 1.9% prior
08:30 (US) May PPI Ex Food, Energy, Trade M/M: 0.2%e v 0.7% prior; Y/Y: No est v 2.1% prior
08:55 (US) Weekly Redbook Sales
09:00 (EU) Weekly ECB Forex Reserves
09:00 (RU) Russia announces weekly OFZ bond auction
10:30 (UK) BOE's Cleand (non-MPC) in London
10:30 (CA) Canada to sell 3-month and 6-month Bills
11:00 (BR) Brazil to sell 2022, 2026, 2035 and 2055 I/L Bonds
11:30 (US) Treasury to sell 4-Week Bills
13:00 (US) Treasury to sell 30-Year Bonds Reopening
16:30 (US) Weekly API Oil Inventories
Technical Outlook: Spot Gold Extends Weakness Ahead Of Fed
Spot Gold remains firmly in red and extends losses below $1264 pivot (Fibo 38.2% of $1214/$1296 rally). Strong bearish sentiment on expectations of Fed's rate hike keeps the price in steep downtrend that extends into fifth straight day. Technicals are weakening on daily chart and fresh bears looking for next supports at $1258 (55SMA) and $1255 (daily Kijun-sen), with stronger bearish acceleration expected to violate strong support zone that lies between $1245 and $1240 (provided by Fibo 61.8%/100SMA/200SMA). More hawkish tone from Fed would pressure gold price for further losses below 200SMA. Broken 20SMA now acts as initial resistance at $1266, followed by 10SMA at $1274 and daily Tenkan-sen at $1277.
Res: 1266, 1270, 1274, 1277
Sup: 1258, 1255, 1245, 1240
Euro Steady On Mixed ZEW Economic Expectation Reports
The euro is almost unchanged in the Tuesday session, as the pair trades at the 1.12 level. On the release front, German ZEW Economic Sentiment dipped to 18.6, missing the forecast of 21.6 points. However, Eurozone ZEW Economic Sentiment improved to 37.7, beating the estimate of 37.2 points. In the US, PPI, a key inflation index, is expected to drop to 0.0%. Wednesday will be busy in the US, which releases retail sales and CPI reports. As well, the Federal Reserve is expected to increase interest rates by a quarter-point.
Unlike the stunning election in the UK, which has left the country in political turmoil, there was muted reaction to the parliamentary elections in France. The first round was held on Sunday, and the second round, slated for June 18, will determine the makeup of the 557-seat National Assembly. French President Emmanuel Macron has hit a chord with the public with his call for a united, prosperous France, and he appears headed for a massive majority in parliament. The traditional left-right divide in French politics appears to have dissolved, at least for now, as Macron's En Marche party, which is barely a year old, is poised to take over France. Macron is expected to put forward pro-business legislation, which will not sit well with the powerful labor unions. Macron wants to streamline government and overhaul labor laws, in order to kickstart the economy and create jobs. Any changes to France's generous employment benefits is bound it be contentious, but a strong majority in parliament will make Macron's job easier.
It's Rate Day on Wednesday, as the Federal Reserve holds its monthly policy meeting. The markets have priced in a quarter-point hike, which would be the second increase in 2017. The likelihood continues to hover around the 90% level, so it would be a shock if the Fed did not make a move. What's in store after that? An additional rate hike seems much less likely in the third quarter, with the CME forecasting the odds of a September move at just 26%. The markets are skeptical about another rate hike in the second half, unless the political situation in Washington shows signs of stabilizing. The Trump administration remains in damage control mode, as it's difficult to assess the damage from the dramatic evidence of ex-FBI director James Comey. The Trump administration continues to lurch from one crisis to another, and President Trump seems disconnected not just from the Democrats, but from many Republican lawmakers as well. The Fed and the markets have serious concerns with regard to Trump's ability to move forward with his economic agenda, and this sentiment could weigh on the US dollar.
Technical Outlook: GBPUSD Spikes Above 1.2700 On CPI Data, Overall Bears See Limited Upside
Cable extends recovery from Asian low at 1.2642 after renewed weakness on Monday approached Friday's spike low and key support at 1.2635.
Fresh acceleration higher on upbeat UK inflation data (2.9% in May vs forecast/April at 2.7%, the highest since July 2013) is for now holding below thick hourly cloud (cloud base lies at 1.2728).
Penetration into hourly cloud would signal extended recovery towards strong barriers at 1.2769 (Monday's high) and 1.2782/86 (55SMA/daily cloud top).
Overall bearish tone suggests limited recovery before fresh attempts towards targets at 1.2620 (100SMA) and 1.2569 (200SMA), with extension towards 1.2548 (daily cloud base) seen on stronger bearish acceleration. Only break above daily cloud top would signal stronger correction of last Friday's 1.2955/1.2635 post-election fall.
Res: 1.2717, 1.2728, 1.2769, 1.2786
Sup: 1.2678, 1.2642, 1.2635, 1.2620