
Sample Category Title
Technical Outlook: GBPUSD Spikes Above 1.2700 On CPI Data, Overall Bears See Limited Upside
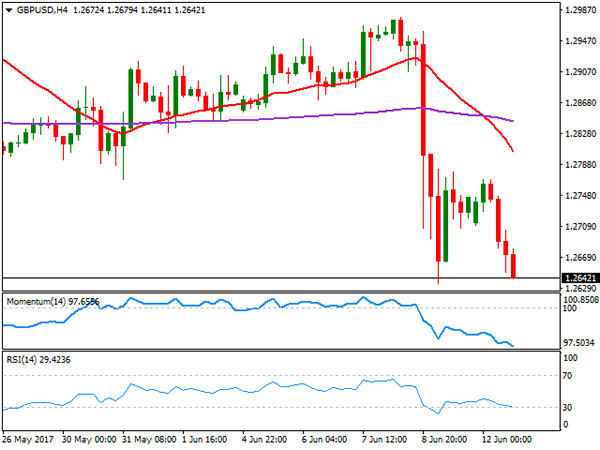
Cable extends recovery from Asian low at 1.2642 after renewed weakness on Monday approached Friday's spike low and key support at 1.2635.
Fresh acceleration higher on upbeat UK inflation data (2.9% in May vs forecast/April at 2.7%, the highest since July 2013) is for now holding below thick hourly cloud (cloud base lies at 1.2728).
Penetration into hourly cloud would signal extended recovery towards strong barriers at 1.2769 (Monday's high) and 1.2782/86 (55SMA/daily cloud top).
Overall bearish tone suggests limited recovery before fresh attempts towards targets at 1.2620 (100SMA) and 1.2569 (200SMA), with extension towards 1.2548 (daily cloud base) seen on stronger bearish acceleration. Only break above daily cloud top would signal stronger correction of last Friday's 1.2955/1.2635 post-election fall.
Res: 1.2717, 1.2728, 1.2769, 1.2786
Sup: 1.2678, 1.2642, 1.2635, 1.2620
Foreign Exchange Market Commentary: EUR/USD, USD/JPY, GBP/USD, GOLD, WTI CRUDE, DJIA, FTSE100, DAX
EUR/USD
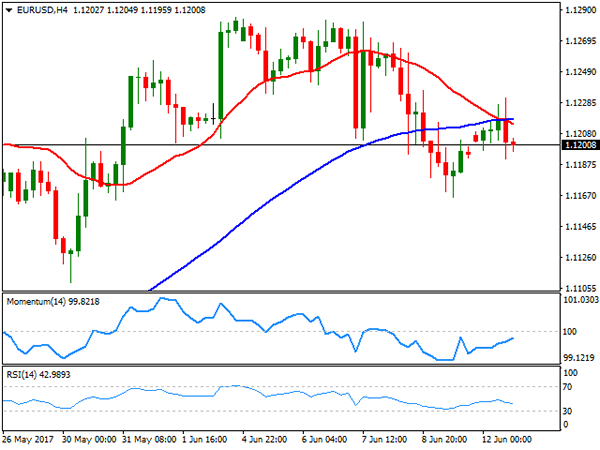
The EUR/USD pair managed to post a tepid advance this Monday, but closed the day pretty much flat around 1.1200, as investors stand cautious ahead of a busy Central Bank's week, which includes the Fed, the BOE and the BOJ. Despite persistent Pound´s weakness amid political uncertainty, the American dollar traded lower against its major counterparts, with the EUR/USD pair peaking at 1.1231, but retreating on comments from ECB's Coeure, who said that it's too early to discuss tapering.
In Europe, the only relevant news came from France, as Emmanuel Macron's centrist La Republique En Marche won a huge majority in the French Parliament´s first round of voting, expected to get between 415-455 seats out of 577. The good news, however, is not enough to affect the common currency. The macroeconomic calendar had nothing to offer this Monday, but will become more interesting this Tuesday, with multiple figures coming from Germany, including June ZEW's survey, and US PPI.
The technical picture for the pair is short term neutral-to-bearish as in the 4 hours chart, the pair was contained by selling interest around a congestion of moving averages, as the 20 and 100 SMAs converge in the 1.1220 region. In the same chart, the Momentum indicator continues heading higher, but below its 100 level, while the RSI indicator turned south, now around 42 and anticipating some additional declines ahead. Still, unless a break below 1.1080, the downward potential will remain limited.
Support levels: 1.1160 1.1120 1.1080
Resistance levels: 1.1210 1.1250 1.1300
USD/JPY
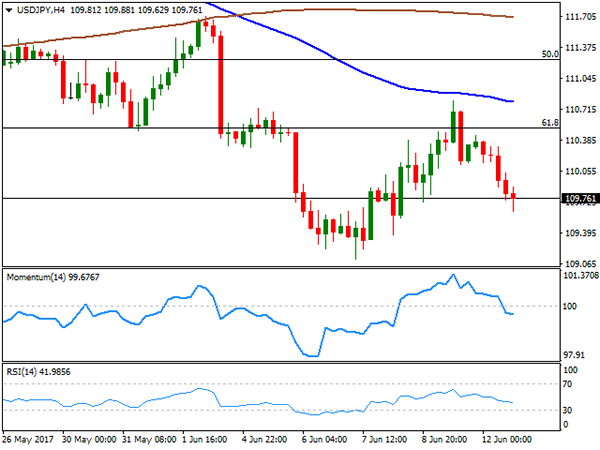
The USD/JPY pair closed the day in the red, as the negative tone of worldwide equities kept the yen on demand at the beginning of the week. With no relevant news coming from the US, the pair traded on the back of sentiment, unable to get clues this time from yields, as US Treasury's benchmarks remained stable all through the day. Both Central Banks will have monetary policy meetings this week, with the Fed scheduled for Wednesday and the BOJ a few hours later. The US Central Bank will likely determinate the fate of the pair, although given the dominant bearish trend, a hawkish surprise from the Fed will hardly be sustainable in time. Holding below 110.00, the pair traded as low as 109.62, now the immediate support, ahead of 109.11, the multi-month low set last week. Technical readings in the 4 hours chart support a downward extension, as the pair failed to recover above 110.50, the 61.8% retracement of its April/May bullish run, with technical indicators now consolidating within negative territory and the price well below its 100 and 200 SMAs.
Support levels: 109.60 109.20 108.75
Resistance levels: 110.10 110.50 111.00
GBP/USD
The GBP/USD pair fell at the beginning of the week, paring losses a few pips above the multi-month set last week at 1.2634, but with the Pound clearly undermined by political uncertainty in the UK. Domestic woes are coupling with the upcoming Brexit negotiation, set to begin next week, with PM May's still to form a government. Her defeat in the latest election has arose speculation that the UK may have to choose a softer Brexit, although PM Davis reaffirmed earlier today the current stance favoring a hard one. Fueling the ongoing uncertainty, a meeting in Brussels between EU Michel Barnier and UK Oliver Robbins ended up with the economies failing to agree on a start date for Brexit negotiations. The pair retains a strong negative momentum heading into the Asian opening, with lower lows still to be expected. Short term, the 4 hours chart shows that technical indicators continue heading lower, despite being in oversold readings, whilst the 20 SMA accelerated its decline far above the current level and now below the 200 EMA, in line with the ongoing downward move.
Support levels: 1.2630 1.2590 1.12550
Resistance levels: 1.2660 1.2707 1.2760
GOLD
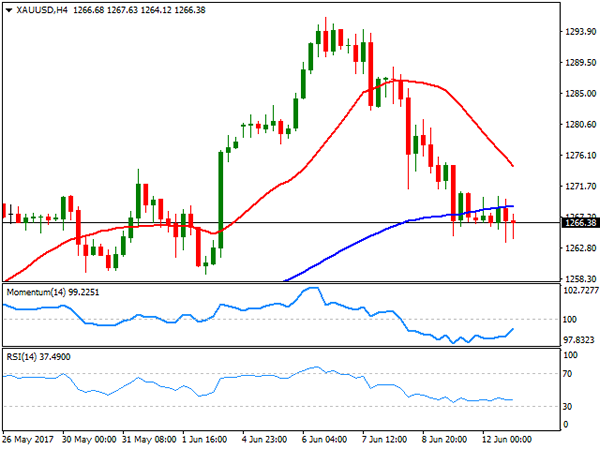
Gold prices saw little action at the beginning of the day, ending it flat despite generally stronger base metals. Spot closed at $1,266.47 a troy ounce, having posted a lower high and a lower low daily basis, this last at 1,263.53. In Asia, the commodity edged lower for a fourth consecutive day, amid low demand from local jewelers and retailers. Daily basis, the metal closed right below its 20 SMA, while technical indicators have kept retreating within positive territory, now resting around their mid-lines. In the same chart, the 100 and 200 DMAs stand flat below the current level, all of which indicates fading upward momentum, but is not enough to confirm an upcoming decline. In the 4 hours chart, the price remained stuck around its 100 SMA, while the 20 SMA maintains its bearish slope above the current level as technical indicators head nowhere within negative territory.
Support levels: 1,263.50 1,253.20 1,245.50
Resistance levels: 1,271.40 1,282.60 1,295.90
WTI CRUDE OIL
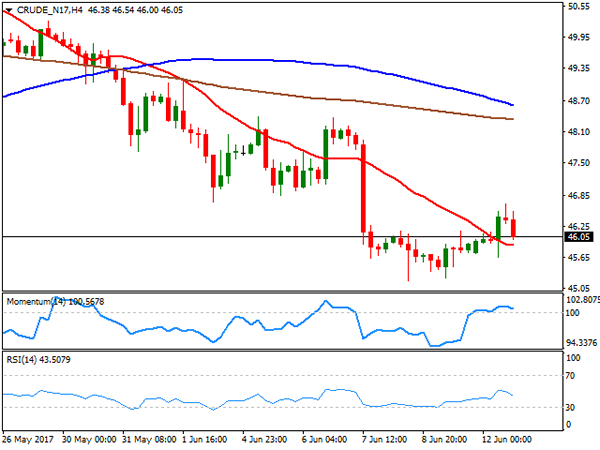
West Texas Intermediate crude oil futures closed the day a few cents lower this Monday at $46.05 a barrel. Oil prices rose intraday after Saudi Arabia announced it will limit the volumes sold to some Asian countries in July, to a total of 300,000 barrels per day, coupling with speculation that the US stockpiles have fallen for nearly 2 million barrels at the Cushing, Oklahoma delivery point last week. Prices, however, were unable to hold on to gains, and from a technical point of view, the risk remains towards the downside. The daily chart for WTI shows that the Momentum indicator has partially corrected within negative territory before resuming its decline, while the RSI indicator consolidates around 34. Moving averages in the mentioned chart, keep gaining downward strength above the current level. In the shorter term, and according to the 4 hours chart, the technical stance is neutral, as the price hovers a few cents above a horizontal 20 SMA, the Momentum indicator remains stuck around its 100 level, while the RSI also lacks directional strength around 42.
Support levels: 45.40 44.70 44.10
Resistance levels: 46.60 47.20 47.90
DJIA
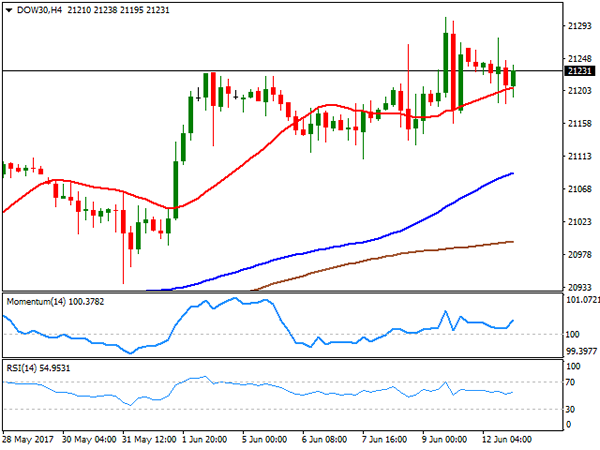
A continued decline in tech-related equities sent Wall Street lower this Monday. The fall began last Friday, following reports that Apple was using slower modems in upcoming iPhones, compared with those used by rivals. The Dow Jones Industrial Average lost 36 points, to end at 21,235.67, while the Nasdaq Composite shed 32 points, to 6,175.47. The S&P ended at 2,429.39, down by 2 points. Within the Dow, General Electric led advancers, up 3.79% after its CEO resigned, followed by Chevron that gained 1.38%, as a modest advance in oil prices at the beginning of the American session fueled demand for energy-related equities. Apple was the worst performer for a second consecutive session, down 2.71%, followed by McDonald's that shed 1.97%. The DJIA daily chart shows that the index remains in a consolidative phase above all of its moving averages, whilst technical indicators keep retreating modestly within positive territory. In the shorter term, and according to the 4 hours chart, the index holds a few points above its 20 SMA, while technical indicators turned modestly higher from their mid-lines, lacking enough upward momentum to confirm an upcoming bullish movement.
Support levels: 21,186 21,144 21,092
Resistance levels: 21,259 21,303 21,350
FTSE100
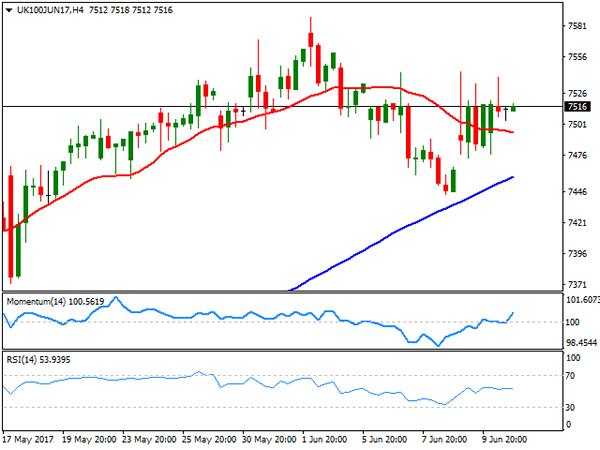
The FTSE 100 shed 15 points to end at 7,511.87, limited losses as the sour tone in some sectors was offset by a weakening Pound. UK political jitters weighed on investors' mood, and will likely weigh until the political future becomes clearer. Johnson Matthey led the way higher within the Footsie, ending 2.04% higher, followed by Royal Dutch Shell that added 1.56%. Fresnillo was the worst performer, down 4.87%, followed by Micro Focus that lost 3.80%. The index, however, held above a bullish 20 DMA in the daily chart, albeit the Momentum indicator remains flat around its 100 line whilst the RSI indicator presents a modest upward potential, currently around 61, all of which limits chances of a downward move. In the 4 hours chart, the technical outlook is neutral-to-bullish, as it holds above all of its moving averages, whilst technical indicators turned higher within positive territory, although the index will need to surpass Friday's high at 7,544, to confirm another leg higher for this Friday.
Support levels: 7,482 7,445 7,405
Resistance levels: 7,541 7,588 7,620
DAX
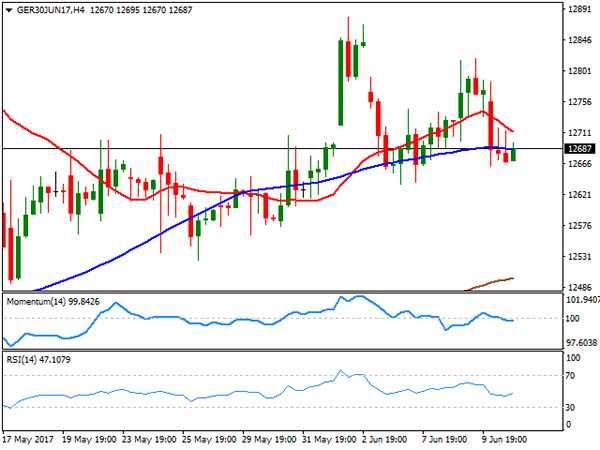
European equities followed the lead of their Asian counterparts, with the German DAX closing at 12,690.44, down 23 points or 0.18%. The tech sector led the decline, after Friday's sell-off in Wall Street, while uncertainty over UK's political leadership also weighed on investors' mood. Within the German benchmark, Infineon was the worst performer, down 3.11%, followed by SAP that shed 2.42%, and Deutsche Bank that closed 2.13% lower. Volkswagen on the other hand, was the best performer, adding 2.17%, followed by Heidelberg Cement that gained 1.90%. The technical outlook is little changed, with the index now neutral and partially losing its previous bullish stance, but still far from bearish. The benchmark is currently hovering around its 20 DMA, while technical indicators turned lower within neutral territory. In the 4 hours chart, the DAX is right below a modestly bearish 20 SMA and hovering around a horizontal 100 SMA, while technical indicators head nowhere around their mid-lines.
Support levels: 12,662 12,620 12,569
Resistance levels: 12,734 12,791 12,834
Loonie Skyrockets On ‘Hawkish’ BoC Remarks
The Canadian dollar surged on Monday, following comments from BoC Deputy Governor Carolyn Wilkins. In a hawkish twist, the policymaker indicated the Bank will be assessing whether all of the monetary stimulus currently in place is still required. Her comments on the Canadian outlook were upbeat as well, indicating that growth in Q1 was 'pretty impressive', and that the economy's adjustment to lower oil prices is largely behind us. Investors may have interpreted these comments as a first sign that the next move in interest rates will likely be higher.
Coming on top of Friday's stellar employment gains, these comments confirm our view that the Loonie could remain under buying interest in the short run. USD/CAD fell below the support (now turned into resistance) barrier of 1.3420 (R3) on Wilkins's comments, crushed two more obstacles, and stopped near the 1.3270 (S1) line. The tumble confirmed a forthcoming lower low on the 4-hour chart and thus, it turned the short-term outlook back to the downside. A dip below 1.3270 (S1) is likely to aim for our next support hurdle of 1.3220 (S2). Nevertheless, given that yesterday's tumble appears overextended, we would stay mindful that a corrective rebound may be on the cards before the next negative leg.
As for the bigger picture, although we expect the Canadian currency to strengthen in the near term, a sustained appreciation could exacerbate the softness in exports we saw in Q1 and also place downward pressure on the core CPI rate, which remains far below from the BoC's target. Therefore, we would stay cautious that when it meets next, on the 12th of July, the BoC may pour some cold water on speculation that a rate increase is drawing closer.
UK politics: Deal or no deal?
Today, sterling traders will probably leave their gaze locked on UK political developments, as the new Parliament is set to meet for the first time. Meanwhile, Theresa May will meet with the Democratic Unionist Party (DUP), in order to negotiate the terms of the DUP's backing for her government. Yesterday, May apologized to Conservative lawmakers, accepting responsibility for the party's poor performance and indicating that she will get the party out of the mess she put it in. As such, the spotlight will now be on whether she will manage to get the DUP and its 10 MPs on her side.
EUR/GBP has been trading in a short-term uptrend since the 10th of May, while the latest weakening of the pound pushed the rate up to 0.8870 (R1) confirming a forthcoming higher high. In case a Tory-DUP agreement takes flesh today or in the coming days, we could see sterling recover some of its latest losses and thus EUR/GBP may correct lower for another test near 0.8775 (S1). However, we maintain the view that as long as the UK political landscape remains so uncertain, any near-term bounces in GBP are likely to remain relatively limited. We expect EUR/GBP bulls to take the reins again soon and push for the continuation of the prevailing uptrend, targeting once again the 0.8870 (R1) hurdle. A clear break above that zone is possible to open the way for our next resistance of 0.8945 (R2).
As for the rest of today's highlights:
During the European day, the UK CPI data for May will be in the spotlight. The forecast is for both the headline and the core rates to have remained unchanged. However, we view the risks surrounding those forecasts as skewed to the downside, given that the UK services PMI for the month showed the weakest increase in prices charged since November. In case there's a downside surprise we could see the pound coming under some selling interest, but we think that market focus is likely to remain primarily on politics.
We get May's CPI data from Sweden as well. The forecast is for both the headline and the underlying rates to have declined, which could hurt the krona somewhat. However, bearing that such a retreat comes after a robust acceleration, we don't expect this piece of data to be particularly worrisome for Riksbank officials.
In Germany, the ZEW survey for June will be in focus. The consensus is for both the expectations and the current conditions indices to have risen again, which could increase the likelihood for the common currency to continue trending higher, at least in the near term.
As for the speakers, we have two on the agenda: ECB Board member Sabine Lautenschlager and Riksbank Governor Stefan Ingves.
USD/CAD
Support: 1.3270 (S1), 1.3220 (S2), 1.3160 (S3)
Resistance: 1.3335 (R1), 1.3350 (R2), 1.3420 (R3)
EUR/GBP
Support: 0.8775 (S1), 0.8700 (S2), 0.8640 (S3)
Resistance: 0.8870 (R1), 0.8945 (R2), 0.9000 (R3)
FOMC Meeting In Focus, Gold Subject To Downside Risk
Central Bank issues weigh heavy
Today is the start of the two-day FOMC meeting which will provide a decision tomorrow on rates once the CPI and retail sales data has been released. A 25bp rate hike is fully priced-in so the focus will be on the FOMC policy path moving forward. With only 18bp of hike priced-in for the rest of 2017, there is plenty of room for a hawkish Fed to trigger the outsized bearish USD position race for the door.
Wage growth and inflation weakness are behind investors' expectations for a shallow tightening cycle. However, it becomes difficult to forecast further mid-term USD weakness as the Fed quickly tightens policy through reduction of its massive balance sheet. Tomorrow's hike has been dubbed a “dovish hike” and that works well for Janet Yellen. As the market is focused on interest rates, she can quietly tighten without excessive USD strengthening. We remain constructive on USD against low yielders like JPY and CHF.
Elsewhere, BOC Senior Deputy Governor Carolyn Wilkins speech provided a hawkish turn by highlighting the country's solid economic improvement. The comment suggests the BoC has shifted marginally in monetary policy. The speech gave the underpriced CAD a strong push as short-end rate jumped, 50% probability of a 25bp hike in 2017. Other central banks are not expected to bring about many changes. The Swiss National Bank will remain cautious despite easing in political pressure from Europe. The SNB will keep their defensive CHF position through physical intervention and loose monetary policy via negative interest rates.
The Bank of Japan will possibly address mounting criticism of extreme policy strategy. The focus will be on the BoJ assessment of economic activity and the communication process for any exit strategy. However, we suspect given the weak incoming domestic data the BoJ will delay providing any real clarity. USD/JPY bearish sentiment is expected to fade on a slightly less dovish Fed and disappointing BoJ. The less hawkish Reserve Bank of India, recovering trade data and general positive sentiment around risky EM assets will keep INR supported. We remain constructive on EM as political risks fade and developed markets' central banks keep lose monetary policy, solid fundamentals and low interest rates to support EM demand (specifically TRY, INR, IDR and ZAR).
Finally, we remain bearish on RUB as the Russian central bank is likely to cut 50bp to 8.75% (consensus 25bp cut) to support sagging economic data and weakened currency.
Gold: Downside risks before the FOMC meeting
While the UK elections have not changed much around the ongoing trend of gold, labour data disappointed financial markets and gold took a hit reaching $1300 against the backdrop of weak US economic data.
While the Fed should increase the US rate tomorrow by a quarter point at the FOMC meeting, markets are also expecting some more hints regarding the Fed rate path for which Janet Yellen is going to show her optimism. Any failure to do so will send the precious metal higher but we consider that the Fed will reiterate their verbal intervention and send gold lower.
On top of that our underlying view on the yellow metal is bearish. One could argue that the US stock market is at all-time high. Monetary policy remains largely accommodative all over the world. For example, the SNB - which expands continuously its balance sheet - underpins the stock market (in particular the US stock market). As a result our target for gold is a support area between $1214 and $1230.
GOLD Trading Lower Within Uptrend Channel, SILVER Weakening, CRUDE OIL Starting To Bounce Back.
GOLD Trading lower within uptrend channel.
Gold is consolidating within uptrend channel. Hourly support is located at 1246 (18/05/2017 low). Stronger support is given at 1195 (10/03/2017 low). Expected to show renewed upside pressures.
In the long-term, the technical structure suggests that there is a growing upside momentum. A break of 1392 (17/03/2014) is necessary ton confirm it, A major support can be found at 1045 (05/02/2010 low).
SILVER Weakening.
Silver declines. Closest support is given at 16.44 (18/05/2017 low). Strong support is given at 16.06 (09/05/2017 low). Key resistance is given at a distance at 19.00 (09/11/2017 high). The road seems wide open for further decline.
In the long-term, the death cross indicates that further downsides are very likely. Resistance is located at 25.11 (28/08/2013 high). Strong support can be found at 11.75 (20/04/2009).
CRUDE OIL Starting to bounce back.
Crude oil's decline is stopping since the recent collapse from $52. Support is given at a distance 43.76 (05/05/2017 low). The technical structure suggests further strengthening.
In the long-term, crude oil has recovered after its sharp decline last year. However, we consider that further weakness are very likely. Strong support lies at 24.82 (13/11/2002) while resistance can now be found at 55.24 (03/01/2017 high).
EUR/JPY Testing Again Support At 122.56, EUR/GBP Strengthening, EUR/CHF Slightly Declining.
EUR/JPY Testing again support at 122.56.
EUR/JPY is trading lower. Hourly support is given at 122.56 (18/05/2017 low). Hourly resistance can be found at 125.82 (16/05/2017 high). Major support is given at 114.90 (18/04/2017 low).
In the longer term, the technical structure validates a medium-term succession of lower highs and lower lows. As a result, the resistance at 149.78 (08/12/2014 high) has likely marked the end of the rise that started in July 2012. Strong support at 94.12 (24/07/2012 low) looks nonetheless far away.
EUR/GBP Strengthening.
EUR/GBP has broken resistance at 0.8787 (13/03/2017 high). The pair keeps on going higher. Strong support can be found at 0.8304 (05/12/2017 low). Expected to reach 0.8900.
In the long-term, the pair has largely recovered from recent lows in 2015. The technical structure suggests a growing upside momentum. The pair is trading above from its 200 DMA. Strong resistance can be found at 0.9500 psychological level.
EUR/CHF Slightly declining.
EUR/CHF is trading lower. The pair has broken support given at 1.0866 (18/05/2017 low). We believe that the medium-term pattern suggests us to see continued bearish pressures towards hourly support that can be found at 1.0792 (03/05/2017 low).
In the longer term, the technical structure is mixed. Resistance can be found at 1.1200 (04/02/2015 high). Yet,the ECB's QE programme is likely to cause persistent selling pressures on the euro, which should weigh on EUR/CHF. Supports can be found at 1.0184 (28/01/2015 low) and 1.0082 (27/01/2015 low).
USD/CHF Bearish, USD/CAD Collapsing, AUD/USD Stalling Below 0.7600.
USD/CHF Bearish.
USD/CHF continues its decline despite some ongoing consolidation. Hourly resistance can be found at 0.9727 (09/06/2017 high). Strong resistance is given at 1.0107 (10/04/2017 high). Expected to show continued weakness towards hourly support at 0.9614 (06/06/2017 low).
In the long-term, the pair is still trading in range since 2011 despite some turmoil when the SNB unpegged the CHF. Key support can be found 0.8986 (30/01/2015 low). The technical structure favours nonetheless a long term bullish bias since the unpeg in January 2015
USD/CAD Collapsing.
USD/CAD has strongly declined. Hourly support found at 1.3388 (25/01/2017 high) has been broken. Expected to show continued weakness towards stronger support given at 1.3324 (13/04/2017 low).
In the longer term, there is now a death cross with the 50 dma crossing below the 200 dma indicating further downside pressures. Strong resistance is given at 1.4690 (22/01/2016 high). Long-term support can be found at 1.2461 (16/03/2015 low).
AUD/USD Stalling below 0.7600.
AUD/USD is pushing higher since the pair has failed to reach hourly support given at 0.7329 (09/05/2017 low). As long as prices remain below resistance at 0.7608 (17/04/2017 high), there are nonetheless strong downside risks.
In the long-term, we are waiting for further signs that the current downtrend is ending. Key supports stand at 0.6009 (31/10/2008 low) . A break of the key resistance at 0.8295 (15/01/2015 high) is needed to invalidate our long-term bearish view.
EUR/GBP Daily Outlook
Daily Pivots: (S1) 0.8795; (P) 0.8831; (R1) 0.8883; More...
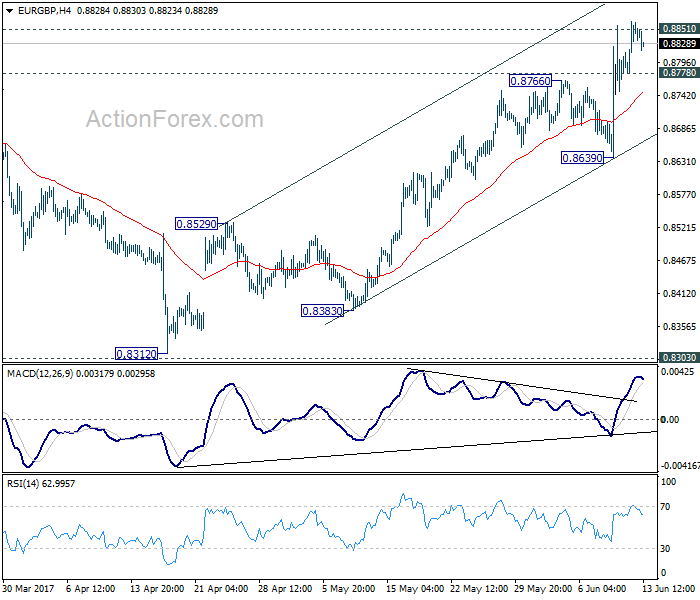
Intraday bias in EUR/GBP stays on the upside for the moment with focus on 0.8851 resistance. Decisive break there will extend the rally from 0.8312 to retest 0.9304 high. At this point, there is no clear sign of larger up trend resumption yet. Hence, we'll be cautious on topping around 0.9304. On the downside, below 0.8778 minor support will turn intraday bias neutral first. But outlook will remains bullish as long as 0.8639 support holds. But break of 0.8639 support will now indicate near term topping and bring deeper pull back to 55 day EMA (now at 0.8601) and below.
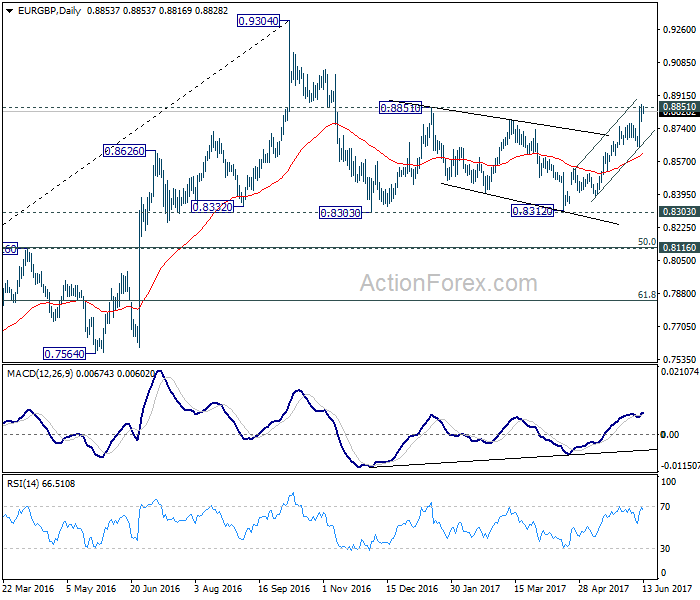
In the bigger picture, price actions from 0.9304 are viewed as a medium term corrective pattern. The leg from 0.9304 should have completed after testing 0.8332 structural support. But it's too early to say that larger rise from 0.6935 is resuming. Rejection from 0.9304 will extend the consolidation with another falling leg. Meanwhile, firm break of 0.9304 will target 0.9799 (2008 high). In case of another decline, we'd expect strong support from 0.8116 cluster support (50% retracement of 0.6935 to 0.9304 at 0.8120) to contain downside and bring rebound.
EUR/USD Renewed Bearish Pressures, GBP/USD Consolidating, USD/JPY Ready For Another Leg Lower.
EUR/USD Renewed bearish pressures.
EUR/USD is trading mixed below strong resistance given at 1.1300 (09/11/2017 high). Hourly support is given at 1.1110 (22/05/2017 low) has been broken. Stronger support lies at 1.0842 (11/05/2017 low) and key support is given at 1.0494 (22/02/2017 low). Expected to show renewed bullish pressures.
In the longer term, the death cross late October indicated a further bearish bias. The pair has broken key support given at 1.0458 (16/03/2015 low). Key resistance holds at 1.1714 (24/08/2015 high). Expected to head towards parity.
GBP/USD Consolidating.
GBP/USD is now consolidating around former hourly support given at 1.2757 (21/04/2017 low). Hourly resistance lies at 1.3046 (18/05/2017 high). Expected to show further decline.
The long-term technical pattern is even more negative since the Brexit vote has paved the way for further decline. Long-term support given at 1.0520 (01/03/85) represents a decent target. Long-term resistance is given at 1.5018 (24/06/2015) and would indicate a long-term reversal in the negative trend. Yet, it is very unlikely at the moment.
USD/JPY Ready for another leg lower.
USD/JPY's short-term bearish pressures are back. The pair is bouncing lower. Hourly support can be found at 109.12 (07/06/2017 high). Strong support is located at 108.13 (17/04/2017 low). Hourly resistance is given at 112.13 (24/05/2017 high). Other key supports lie at a distance 106.04 (11/11/2016 low). Wide-open for further decline.
We favor a long-term bearish bias. Support is now given at 96.57 (10/08/2013 low). A gradual rise towards the major resistance at 135.15 (01/02/2002 high) seems absolutely unlikely. Expected to decline further support at 93.79 (13/06/2013 low).
How Will The Tone Of The FOMC Affect USD?
The long-awaited FOMC June meeting will be held on Wednesday June 14th, at 19:00 BST. Per CME's FedWatch tool, the probability for a June rate hike has climbed to 99.6%. It indicates that markets regard a June rate hike almost certain to happen.
Originally the markets assumed the Fed would raise rates twice more by end of the year; in June and in September respectively. Currently, some traders speculate that the Fed will address a more dovish economic outlook after announcing a June rate hike decision implying a less likely September rate hike.
The tone of the Fed's statement on Wednesday will be the key to affect USD and gold strength this week. The dollar index has seen a substantial 3.78% retracement since April 10th, hitting a low of 96.44 on June 7th, last seen on November 9th. The bears are currently testing the psychological support level at 97.00.
USD prospects remain moderately bearish, if the Fed address a more hawkish outlook it will likely provide USD support. However, as the investigations on Trump's Russia leak scandal is still ongoing, USD is still under pressure due to political turmoil until more evidence is released showing Trump's innocence.
Spot gold has seen a substantial 2.2% retracement since June 7th, due to profit-taking and the release of the UK general election outcome which has eased markets' risk-off sentiment. The price has been consolidating since Friday evening, holding above the significant support line at 1260.
The UK inflation data (CPI and PPI) for May will be released at 09:30 BST today. it will likely affect GBP crosses.