Sample Category Title
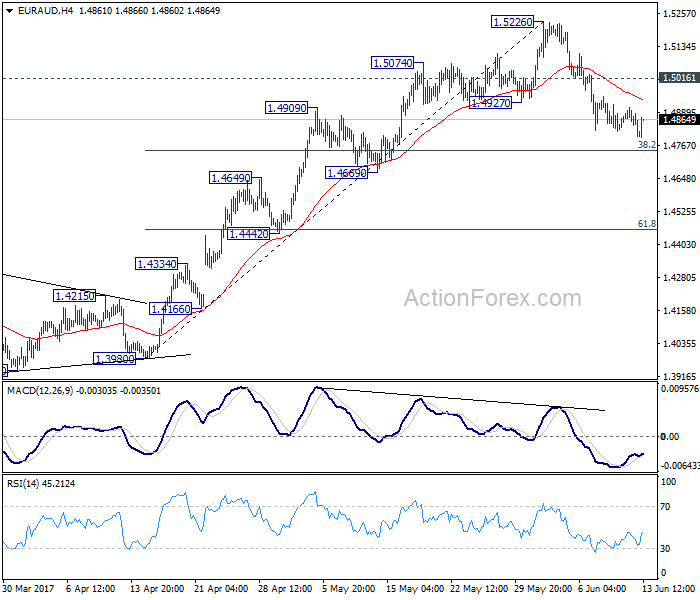
EUR/AUD Daily Outlook
Daily Pivots: (S1) 1.4829; (P) 1.4869; (R1) 1.4894; More...
No change in EUR/AUD's outlook. The correction from 1.5526 might still extend lower to 38.2% retracement of 1.3980 to 1.5226 at 1.4750. But we'd expect strong support from 1.4669 to contain downside and bring rebound. Above 1.5015 minor resistance will turn bias to the upside for 1.5226 first. Larger rise from 1.3624 is expected to resume later. Break of 1.5226 will target next medium term fibonacci level at 1.5455.
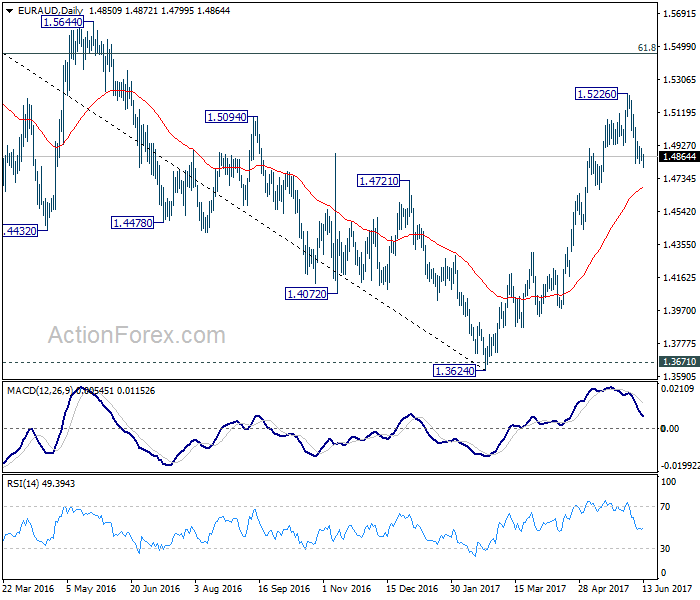
In the bigger picture, price actions from 1.6587 medium term top are viewed as a corrective pattern. Such correction should be completed at 1.3624 after defending 1.3671 key support. Rise from 1.3642 is now expected to target 61.8% retracement of 1.6587 to 1.3624 at 1.5455. Sustained break there will pave the way to retest 1.6587. In any case, outlook will now stay cautiously bullish as long as 1.4669 support holds. Break of 1.4669 will dampen the bullish view and would at least bring deeper fall back to 55 week EMA (now at 1.4539).
GBP/JPY Daily Outlook
Daily Pivots: (S1) 138.28; (P) 139.54; (R1) 140.42; More....
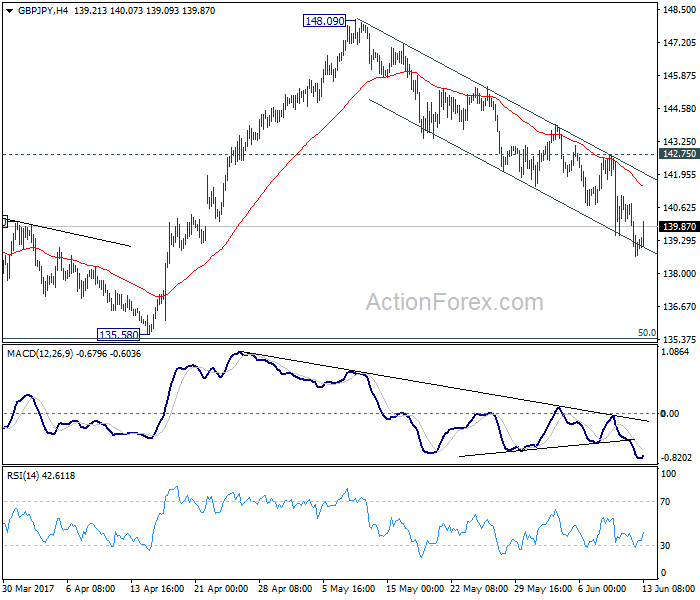
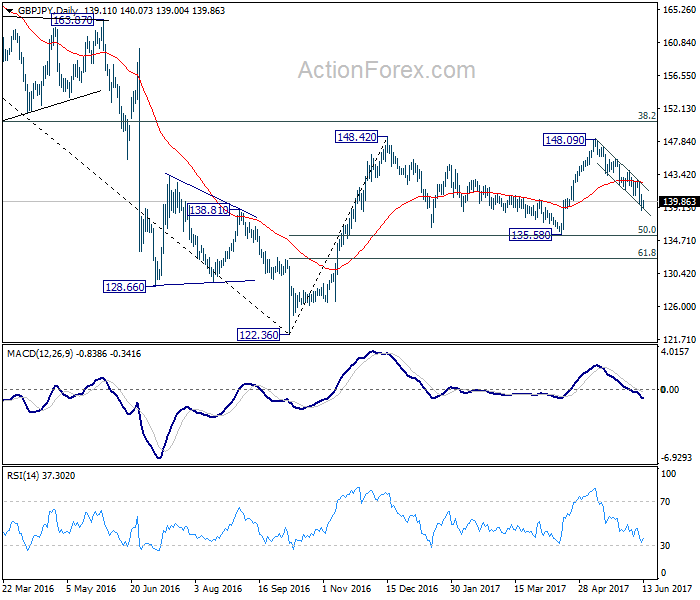
GBP/JPY recovers mildly after hitting 138.65 but stays well below 142.75 resistance. Intraday bias remains on the downside for 135.58 support. As this level is close to 135.39 fibonacci level, we'd look for bottoming signal around there to bring rebound. However, break of 142.75 resistance is needed to indicate completion of fall from 148.09. Otherwise, near term outlook will say mildly bearish in case of recovery.
In the bigger picture, while the fall from 148.09 is deeper than expected, we're not bearish in the cross yet. Price action from 148.42 is possibly developing into a sideway pattern with fall from 148.09 as the third leg. Deeper decline could be seen but we're looking for strong support from 135.58 and 50% retracement of 122.36 to 148.42 at 135.39 to contain downside. Rise from 122.36 is still mildly in favor to resume at a later stage. However, sustained break of 135.58/39 will confirm reversal and target a retest on 122.36 low.
Technical Outlook: EURUSD Is Holding Around 1.1200 Handle, Awaiting Fed
The Euro bounced after repeated probe below 1.1200 in early European hours on Tuesday, but is struggling to sustain gains above 1.1200 handle. Daily Tenkan-sen (1.1225) caps for now, with the downside expected to remain vulnerable while the price stays below 1.1225/35 pivots (Tenkan-sen/10SMA). Tight ranges could be expected ahead of Fed's policy announcement on Wednesday, with tone of Fed Chair Yellen's testimony expected to be the key driver of the markets. Dovish tone from Yellen would send dollar lower and boost Euro for renewed attempt towards key med-term barrier at 1.1300 (08 Nov high). Conversely, hawkish Fed, which includes rate hike and signal of sticking to the policy for three hikes in 2017, will be negative for the single currency and risk break below pivotal support at 1.1100 for extended weakness.
Res: 1.1225, 1.1235, 1.1285, 1.1300
Sup: 1.1209, 1.1185, 1.1166, 1.1114
Trade Idea: GBP/USD – Sell at 1.2820
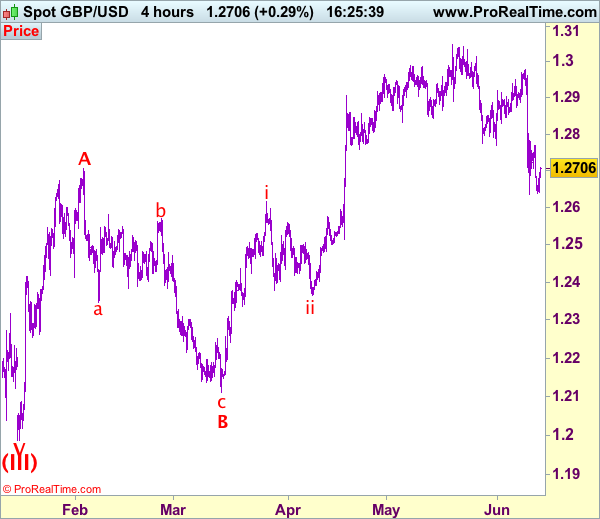
GBP/USD – 1.2700
Recent wave: Wave V of larger degree wave (III) has ended at 1.1986 and major correction has commenced from there for gain to 1.3000 and 1.3140-50
Trend: Near term up
Original strategy :
Sell at 1.2820, Target: 1.2620, Stop: 1.2880
Position: -
Target: -
Stop: -
New strategy :
Sell at 1.2820, Target: 1.2620, Stop: 1.2880
Position: -
Target: -
Stop:-
As the British pound recovered after holding above indicated support at 1.2635 (last week’s low), retain our view that further consolidation above this level would be seen and another bounce to 1.2780 cannot be ruled out, however, reckon upside would be limited to 1.2820-30 and bring another decline, below said support at 1.2635 would extend recent decline from 1.3048 for retracement of recent upmove to 1.2600 but near term oversold condition should limit downside to 1.2550 and reckon previous support at 1.2515 would hold from here.
Our preferred count on the daily chart is that cable's rebound from 1.3500 (wave (A) trough) is unfolding as a wave (B) with A ended at 1.7043, followed by triangle wave B and wave C as well as wave (B) has ended at 1.7192, the subsequent selloff is the larger degree wave (C) which is still unfolding with minor wave (III) of larger degree wave 3 ended at 1.1986, hence wave (IV) correction is in progress which could either be a triangle wave (IV) of a complex formation but upside should be limited to 1.3500 and price should falter well below 1.4000, bring another decline in wave (V) of 3 for weakness to 1.1500, then 1.1200.
On the upside, expect recovery to be limited to 1.2780-90 and 1.2830 should hold, bring another decline. Above 1.2860-70 would defer and suggest low is possibly formed instead, risk a stronger rebound towards 1.2900 but price should falter well below this week’s high at 1.2978 and bring another decline later.
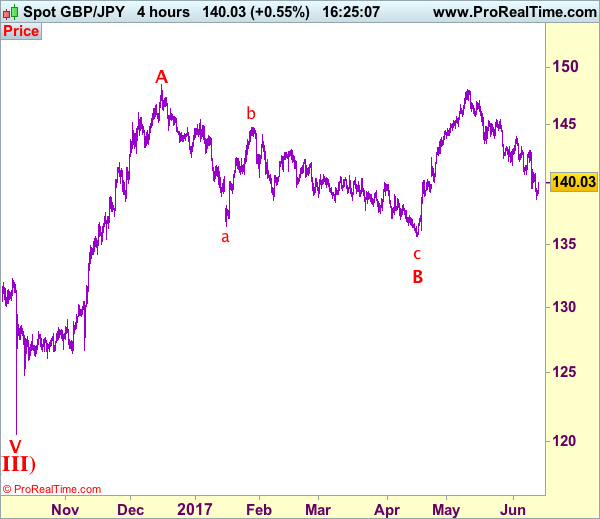
Trade Idea: GBP/JPY – Sell at 141.30
GBP/JPY - 140.00
Recent wave: Medium term low formed at 120.50 and (A)-(B)-(C) major correction has commenced with (A) leg ended at 148.45, hence wave (B) is unfolding for retreat to 131.00-10.
Trend: Near term up
Original strategy:
Sell at 141.30, Target: 139.30, Stop: 141.90
Position: -
Target: -
Stop: -
New strategy :
Sell at 141.30, Target: 139.30, Stop: 141.90
Position: -
Target: -
Stop:-
As sterling has rebounded after falling to 138.70 yesterday, suggesting consolidation above this level would be seen and corrective bounce to 140.50-60 cannot be ruled out, however, reckon upside would be limited to 141.00 and renewed selling interest should emerge around 141.30-40, bring another decline later, below said support at 138.70 would signal the decline from 148.11 top is still in progress and would extend further weakness to 138.45-50, loss of near term downward momentum should limit downside to 138.00-10.
In view of this, would not chase this fall here and we are looking to sell sterling again on subsequent recovery as upside should be limited to 141.30-40 and bring another decline. Above 141.90-00 would defer and risk rebound to 142.40-50 but said resistance at 142.75 should limit upside and bring another selloff later.
Our preferred count is that larger degree wave V with circle is unfolding from 251.12 with wave (I) 219.34, (II): 241.38 and wave (III) is subdivided into 1: 192.60, 2: 215.89 (23 Jul 2008) and wave 3 ended at 118.87 earlier in 2009. The correction from there to 162.60 is wave 4 which itself is a double three and is labeled as first a-b-c ended at 151.53, followed by wave x at 139.03, 2nd a ended at 162.60, 2nd b at 146.75 and 2nd c leg of wave 4 ended at 163.00. Therefore, the decline from 163.00 to 116.85 is now treated as wave 5 which also marked the end of larger degree wave (III), hence wave (IV) major correction has commenced for retracement of the wave (III) from 241.38 and upside target at 183.95-00 (50% Fibonacci retracement of the wave (II) from 241.38) had been met, a drop below 160.00 would suggest wave (IV) has ended at 195.85, bring decline in wave (V) for initial weakness to 130 (already met) and 120.
EUR/USD Analysis: Continues In Set Pattern
The common European currency continued to trade against the US Dollar in the descending channel pattern, which formed as a result of the pair bouncing off the resistance of the long term pattern's upper trend line at the start of May. During the middle of Monday's trading session the currency exchange rate encountered the resistance of the upper trend line of the descending channel and the 100-hour SMA. As a result a decline began, which on Tuesday morning had reached the support of the 38.20% Fibonacci retracement level at the 1.1188 level. Due to the fact that the retracement level has been already pierced twice, it can be assumed that the support of the Fibo will be passed by the end of the day.
GBP/USD Analysis: Exposed To More Weakness
The GBP/USD currency pair experienced more weakness on Monday, causing the exchange rate to drop below the 1.27 handle. As a result, the monthly S2 at 1.2624 has become the main support now, which should limit any bearish reactions today. Another leg down is the most likely outcome, as technical indicators are giving distinctly bearish signals now. A breach of the monthly S2 is to open the door for the 1.25 mark to be reached by week's end, which would be a two-month low for the Cable. Despite the recent bearish developments, the Pound is still expected to eventually reach the 1.32 zone, where the three-year down-trend is located. Once this situation occurs, that is to be the key point on the Cable's future
USD/JPY Analysis: In Tight Range Between 109.22 And 110.50
As was anticipated, the US Dollar edged lower against the Japanese Yen yesterday, but managed to remain relatively high above the key support—the monthly S1 at 109.22. Despite the USD/JPY pair showing signs of strength early today, technical studies keep giving strong bearish signals, suggesting the key support could be reached today. In case the Greenback strengthens versus the Yen too much, the six-week down-trend is likely to reverse polarity and reimburse USD-selling. Furthermore, yesterday's breach from the broadening rising wedge pattern is also likely to lead to the pair sliding down towards the pattern's origin point—the same 109.22 mark. The upcoming FOMC meeting on Wednesday still remains the key market mover this week.
Gold Analysis: Breaks Another Pattern
The yellow metal no longer trades in the borders of any short or medium term pattern, as the commodity price has broken out of the short term descending channel in the previous 24 hours. The metal's future price movements are likely to be influenced by the fundamental data release at 12:30 GMT on Tuesday, which will affect the strength of the US Dollar. However, from a technical perspective it can still be expected that the price will decline, as the 55-hour SMA was moving in on the metal's price from the upside near the 1,270 mark. Due to that factor it can be expected that the commodity price will face pressure from the upside, which might eventually force it lower.
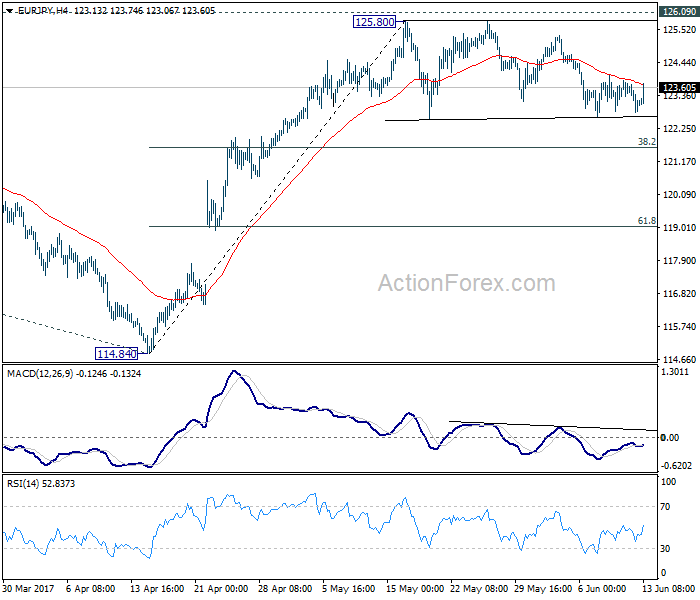
EUR/JPY Daily Outlook
Daily Pivots: (S1) 122.73; (P) 123.23; (R1) 123.67; More...
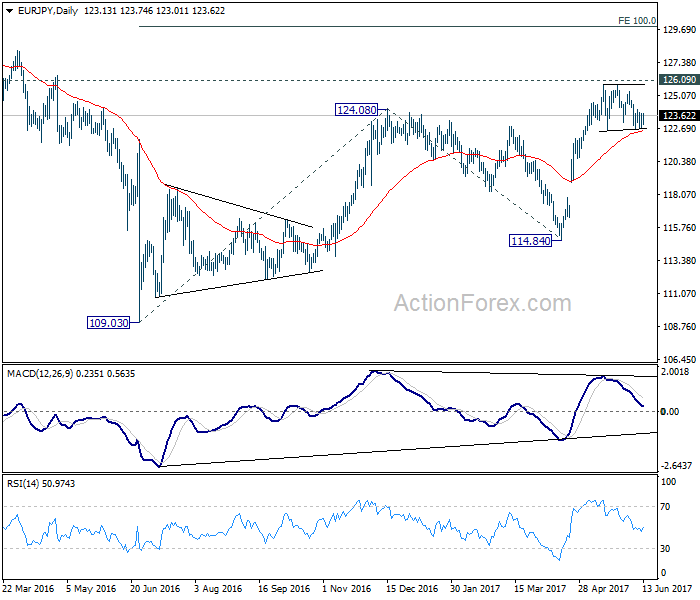
EUR/JPY is still staying in the consolidation pattern from 125.80 and intraday bias remains neutral. Deeper decline cannot be ruled out. But in that case, downside should be contained by 38.2% retracement of 114.84 to 125.80 at 121.61 to bring rise resumption. We're staying mildly bullish in the cross. And, break of 126.09 key resistance will extend the whole rebound from 109.03 to 100% projection of 109.03 to 124.08 from 114.84 at 129.89. Nonetheless, firm break of 121.61 will dampen our bullish view and bring deeper fall to 61.8% retracement at 119.02.
In the bigger picture, focus is staying on 126.09 support turned resistance. Decisive break there will confirm completion of the down trend from 149.76. And in such case, rise from 109.20 is at the same degree and should target 141.04 resistance and above. Meanwhile, rejection from 126.09 and break of 114.84 will extend the fall from 149.76 through 109.20 low.