
Sample Category Title
Market Update – Asian Session: AUD Hits 5-Week High As Australia GDP Dodges Slowdown
Asia Mid-Session Market Update: AUD hits 5-week high as Australia GDP dodges slowdown; S&P affirms US rating
US Session Highlights
(CN) China reportedly ready to acquire more US Treasuries under the right circumstances as CNY currency (Yuan) stabilizes - financial press
(US) Goldman Economist Chain Store Sales w/e Jun 3rd w/w: -4.8%; Y/Y: +1.2%
(US) APR JOLTS JOB OPENINGS: 6.044M V 5.75ME (record high, first time above 6M)
(US) S&P AFFIRMS US SOVEREIGN RATING AT AA+; OUTLOOK STABLE
Stocks drifted to the downside as the inability of the US administration to push its economic agenda continued to take its toll. While the attention of Congress is mostly on the Russia probe, news of China buying more US debt also entered the scenario, helping fuel investor risk-off bias, sending bonds higher and stocks lower. Two sectors in S&P managed to post gains: Energy rose 1.2%, while Materials was also slightly in the black, gaining 0.1%.
US markets on close: Dow -0.2%, S&P500 -0.3%, Nasdaq -0.3%
Best Sector in S&P500: Energy
Worst Sector in S&P500: Consumer Discretionary
Biggest gainers: SWN +5.6%; NEM +4.8%; FCX +3.8%
Biggest losers: M -8.2%; KSS -5.8%; FAST -5.7%
At the close: VIX 10.5 (+0.4pts); Treasuries: 2-yr 1.30% (flat), 10-yr 2.15% (-3bp), 30-yr 2.81% (-3bps)
US movers afterhours
CVNA Reports Q1 -$0.28 v -$0.28e, Rev $159.1M v $158Me; Guides Q2 R$193-203M v $188Me, EBITDA margin -18.5% to -18.0%; +10.2% afterhours
KEYS Reports Q2 $0.64 v $0.58e, Rev $758M v $748Me; Guides Q3 $0.51-0.65 v $0.58e, Rev $840-880M v $838Me ; +5.8% afterhours
UNFI Reports Q3 $0.77 v $0.76e, Rev $2.37B v $2.42Be; cuts FY17 Rev $9.29-9.34B v $9.35Be; -2.2% afterhours
SIGM Reports Q1 -$0.25 v -$0.18e, Rev $39.6M v $39.3Me- non-GAAP Gross margin 47.6% v 46.6% y/y; -4.1% afterhours
AMBA Reports Q1 $0.39 v $0.36e, Rev $64.1M v $63.4Me; authorizes $50M share buyback (2.5% of market cap); Guides Q2 Rev $69-72M v $72.3Me, gross margin 62-63.5%; -5.7% afterhours
DLTH Reports Q1 $0.01 v $0.06e, Rev $83.7M v $82.9Me; Affirms FY17 GAAP EPS $0.66-0.71 v $0.70e, net sales $455-465M v $463Me ; -10.8% afterhours
Politics
(US) House Freedom Caucus said to call for cancellation of Congressional August recess
(US) Pres Trump said to side with Treasury Sec Mnuchin on Debt Ceiling strategy - Politico
(MX) Mexico's MORENA party calls for recount of all State of Mexico precincts
Key economic data
(AU) AUSTRALIA Q1 GDP Q/Q: 0.3% V 0.3%E; Y/Y: 1.7% (weakest annual growth since 2009) V 1.6%E
(AU) AUSTRALIA MAY AIG PERFORMANCE OF CONSTRUCTION INDEX: 56.7 V 51.9 PRIOR (4th consecutive expansion; highest level since Sept 2014)
(NZ) NEW ZEALAND Q1 MANUFACTURING ACTIVITY (SA) Q/Q: 2.8 V 1.3% PRIOR; VOLUME Q/Q: -0.3% (2nd straight decline) V -2.0% PRIOR
(NZ) NEW ZEALAND MAY ANZ JOB ADVERTISEMENTS M/M: -0.6% V 0.2% PRIOR
Asia Session Notable Observations
Asian equity markets are mixed and volatility is thinner despite 2nd straight day of losses on Wall St. Investors are bracing for China FX reserves and trade data, ECB decision, UK elections, and Congressional testimony of former FBI director about Pres Trump's potential involvement in campaign investigation all within the next 48 hours. Shanghai Composite is the outperformer amid strength in China property developer names. Also of note in China, PBoC set Yuan midpoint higher for the 6th straight time, while PBoC returned to conducting open market repos with a full range of reverse repo maturities (7-, 14- and 28-day)
Trading in FX majors was also fairly quiet with exception of AUD. Aussie dollar rose over 40pips after Australia Q1 GDP dodged potential contraction in the wake of yesterday's wider than expected Current Account deficit. AUD/USD hit 5-week highs above 0.7540, and AUD/NZD cross rose above 1.05 for a 1-week high. Short term rates also rose as markets repriced the possibility of another rate cut in the next 12 months to just 15% from 22% prior. Yield on the 3-yr rose 4bps to 1.70%, though worries over the medium term still persisted, with the 10yr-3yr yield spread at narrowest level since Nov 2016.
In the corporate space, M&A speculation lifted shares of Vocus in Australia and Japan Display, with reported interest from KKR and Sharp respectively.
S&P affirmed US sovereign rating at AA+ with a Stable Outlook, thanks to "resiliency of US economy, policy flexibility, and proactive monetary policy helping keep US GDP growth stable over next several years.
Speakers and Press
China
(CN) ANZ analyst: China spending program will support economic growth; rising US rates will not be a headwind for gold
(CN) China National Institution for Finance and Development Chairman Li Yang: China must rein in rapid build-up in local government debt and should implement reforms at the local level to raise transparency and let market forces play a bigger role
(CN) Kynikos Associates' Jim Chanos: China added $5T in new credit dollars last year; Less short on China now than in the past - press
Japan
(JP) Japan Chief Cabinet Sec Suga: BOJ Gov will be the one who understands beating deflation
Australia/New Zealand
(AU) Implied probability of another RBA rate cut in the next 12 months fell to about 15% from 22% following GDP data - press
Korea
(KR) South Korea submits KRW11.2T stimulus package to Parliament - press
(KR) South Korea Fin Min Nominee Kim Dong-Yeon: South Korea faces serious external challenges - speaking in parliament
Asian Equity Indices/Futures (23:30ET)
Nikkei -0.3%, Hang Seng +0.1%, Shanghai Composite +0.9%, ASX200 -0.1%, Kospi -0.1%
Equity Futures: S&P500 +0.1%; Nasdaq +0.1%, Dax +0.1%, FTSE100 -0.1%
FX ranges/Commodities/Fixed Income (23:30ET)
EUR 1.1260-1.1280; JPY 109.30-109.60; AUD 0.7500-0.7545; NZD 0.7170-0.7190
Aug Gold -0.2% at 1,295/oz; July Crude Oil -0.1% at $48.14/brl; July Copper +0.2% at $2.55/lb
(US) Weekly API Oil Inventories: Crude: -4.6M v -8.7M prior (3rd straight draw)
SPDR Gold Trust ETF daily holdings rise 4.2 tonnes to at 855.2 tonnes; second straight increase
(CN) PBOC SETS YUAN MID POINT AT 6.7858 V 6.7934 PRIOR; 6th straight firmer Yuan fix; Strongest Yuan fix since Nov 9th
(CN) PBOC injects CNY180B in combined 7-day, 14-day and 28-day reverse repos v skipped prior
(AU) Australia Finance Ministry (AOFM) sells A$600M in 4.5% 2020 bonds; avg yield 1.6419%; bid-to-cover 4.81x
(KR) South Korea sells KRW1.47T in 30-yr Govt bonds; avg yield 2.33%
(KR) Bank of Korea (BOK) sells KRW2.84T v KRW2.8T offered in 2-yr monetary stabilization bonds; avg yield 1.58% v 1.61% prior
Asia equities notable movers
Australia
Vocus Group (VOC) +19.9%; Receives A$3.50 cash offer from KKR (~22% premium)
Newcrest (NCM) +0.9%; Gold price prices; Van Eck builds stake
IOOF Holdings (IFL) -1.1%; Cut at Citigroup
Virgin Australia (VAH) -1.7%; New board members Warwick Negus and David Baxby may be pushing for privatization; while shareholders HNA Group (19.17%) and Nanshan Group (19.98%) prefer to keep the company public - Australian
WesFarmers (WES) -3.5%; Guides FY17 CAPEX A$1.1-1.2B, Curragh metallurgical coal exports estimated at lower end of range - investor day
Japan
Japan Display (6740) +10.8%; Sharp said to have expressed interest in the company - Nikkei
McDonald's Japan (2702) +1.6%; May SSS +10%
Hong Kong
Aac Technologies Holdings (2018) +16.6%; Gotham City research to publish a new report on company
China Vanke (2202) +7.9%; Halted on speculation of takeover by Shenzhen Metro
China Overseas Grand Oceans Group (81) +6.6%; May contracted sales
Great Wall Motor (2333) -1.8%; May auto Sales
Geely Auto (175) -2.1%; May auto sales
CAR Inc (699) -2.4%; May contracted sales
Daily Technical Analysis: USD/JPY Close And Reverse Potential At 78.6% Fibonacci
Currency pair USD/JPY
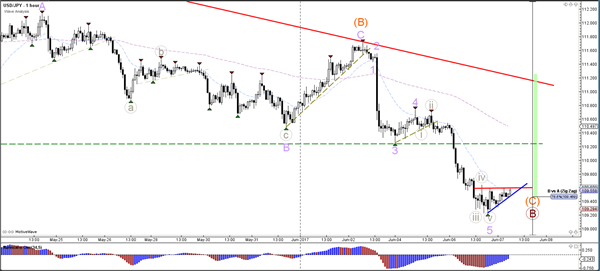
The USD/JPY has reached the 78.6% Fibonacci level of wave B (brown) after breaking below the support trend line (dotted green). The 78.6% Fibonacci could act as a potential bounce spot for completing wave B (brown).
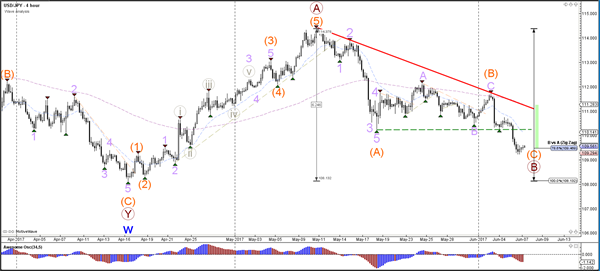
The USD/JPY could have completed 5 waves (grey/purple) within wave C (orange). This particular wave scenario and market structure would become more likely if price manages to break resistance (red) with bullish price action.
Currency pair GBP/USD
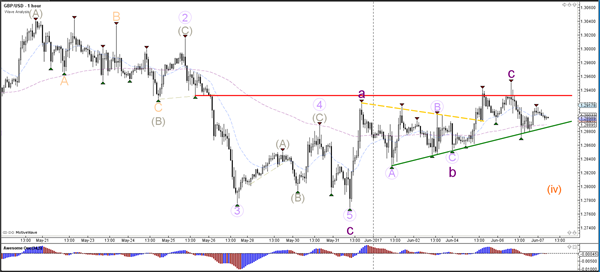
The GBP/USD remains in a large consolidation zone (purple box) one day before the UK will hold general parliamentary elections (Thursday 8 June 2017). .
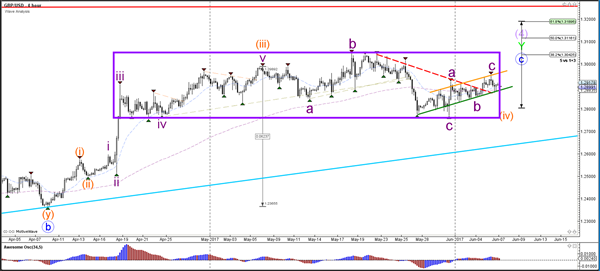
The GBP/USD did not manage to break above the resistance top (red) yesterday and is now building an ascending wedge pattern (red/green). The break of the support (green) or resistance (red) could lead to a potential breakout.
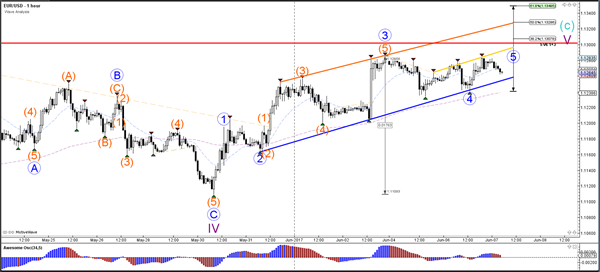
Currency pair EUR/USD
The EUR/USD is moving higher in a bullish trend channel indicated by the support (blue) and resistance (red) trend lines. The new higher high is challenging the 100% Fib level at 1.13 of wave 2 (green), which is a break or bounce zone.
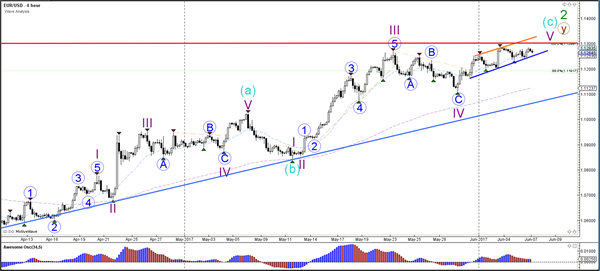
The EUR/USD is in a bullish channel (blue/orange) but price is struggling to break above the key 1.13 resistance zone.
Daily Technical Outlook And Review: EUR/USD, GBP/USD, AUD/USD, USD/JPY, USD/CAD, USD/CHF, DOW 30, GOLD
A note on lower timeframe confirming price action...
Waiting for lower timeframe confirmation is our main tool to confirm strength within higher timeframe zones, and has really been the key to our trading success. It takes a little time to understand the subtle nuances, however, as each trade is never the same, but once you master the rhythm so to speak, you will be saved from countless unnecessary losing trades. The following is a list of what we look for:
- A break/retest of supply or demand dependent on which way you're trading.
- A trendline break/retest.
- Buying/selling tails ... essentially we look for a cluster of very obvious spikes off of lower timeframe support and resistance levels within the higher timeframe zone.
- Candlestick patterns. We tend to only stick with pin bars and engulfing bars as these have proven to be the most effective.
We typically search for lower-timeframe confirmation between the M15 and H1 timeframes, since most of our higher-timeframe areas begin with the H4. Stops are usually placed 1-3 pips beyond confirming structures.
EUR/USD
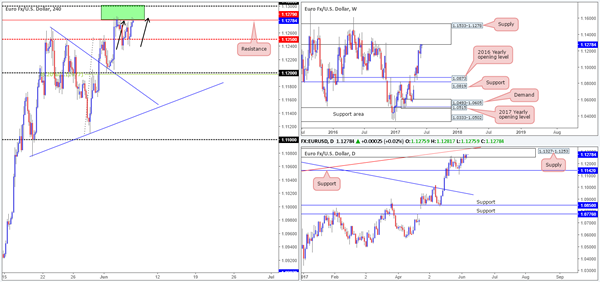
In recent trading, we have seen the EUR/USD bulls go on the offensive. This brought the H4 candles back up to the 1.13/1.1279 H4 area, which, from our perspective, has potential to bounce price again. As mentioned in previous reports, we like this zone because it has formed within both weekly and daily supplies (1.1533-1.1278/1.1327-1.1253). Also of interest is the H4 approach to this area. Notice that there's an AB=CD bearish pattern completion at 1.1283.
Our suggestions: Unfortunately our team missed the sell from 1.13/1.1279 on Monday. Nevertheless, given the H4 approach and the clear higher-timeframe supplies now in play, our team has taken a short from 1.1282, and positioned a stop-loss order a few pips above 1.13.
Our initial target is the H4 mid-level support at 1.1250, followed by the 1.12 handle, and then possibly daily support coming in at 1.1142.
Data points to consider: No high-impacting news on the docket today.
Levels to watch/live orders:
- Buys: Flat (stop loss: N/A).
- Sells: 1.1282 ([live] stop loss: 1.1302).
GBP/USD:
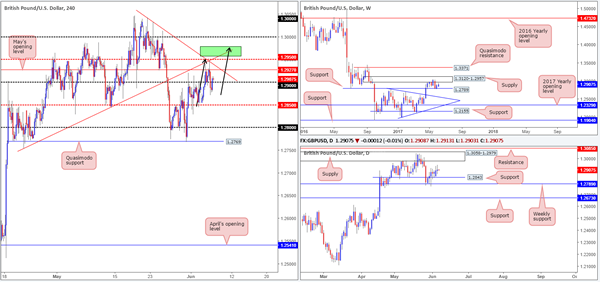
GBP/USD prices are effectively unchanged this morning. From the weekly scale the pair came within striking distance of testing the supply pegged at 1.3120-1.2957. In the event that the market moves lower from here, the next downside target in view can be seen at 1.2789 (support).
Bouncing down to the daily timeframe, yesterday's segment printed a clear-cut indecision candle between supply logged at 1.3058-1.2979 and support seen at 1.2843. Notice also that the daily supply is lodged within the walls of the said weekly supply.
Looking over to the H4 candles, we can see that price recently bounced (almost to-the-pip) from the mid-level resistance at 1.2950. This barrier, as you can see, intersected with two trendline resistances (1.3042/1.2754). With price seen trading back above 1.29 right now, there's not a lot of leg room for the bulls to dance. May's opening level is seen lurking just above at 1.2927, followed closely by the 1.2950 base we just mentioned.
Our suggestions: Right now, the only area that sparks any interest is 1.2957/1.2979 (the underside of both the weekly and daily supplies marked in green on the H4 chart). However, our desk has noted that to trade this zone, a reasonably sized H4 bearish candle would need to form from here, preferably a full-bodied candle. This is simply because there's a large psychological number 1.30 lurking just above, which has ‘trade me' written all over it.
Data points to consider: No high-impacting news on the docket today.
Levels to watch/live orders:
- Buys: Flat (stop loss: N/A).
- Sells: 1.2957/1.2979 ([waiting for a reasonably sized H4 bear candle – preferably a full-bodied candle – to form before pulling the trigger is advised] stop loss: ideally beyond the candle's wick).
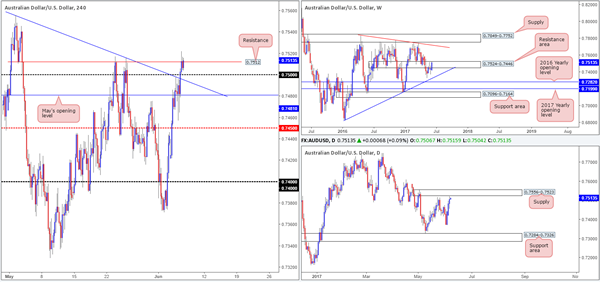
AUD/USD:
On Tuesday, the RBA decided to leave its monetary policy unchanged, which lifted the Aussie higher. After breaching both the H4 trendline resistance extended from the high 0.7556 and the psychological handle 0.75, the unit ended the day settling beneath a H4 resistance at 0.7512, which is, at the time of writing, just about holding firm.
Over on the bigger picture, the weekly candles remain within the confines of a resistance area seen at 0.7524-0.7446 (we must admit though, the strength of the bulls seen within this area is concerning). Down on the daily chart, price is currently trading just ahead of a supply zone pegged at 0.7556-0.7523.
Our suggestions: In essence, weekly bulls are showing strength even though they're positioned within a resistance area. Daily price is seen trading nearby supply, and H4 action looks poised to breach its current resistance. In view of this, we feel it may be best to hit the sidelines today and reassess structure going into Thursday's open. Hopefully price will be in a more favorable position by then.
Data points to consider: Australian GDP q/q numbers at 2.30am GMT+1.
Levels to watch/live orders:
- Buys: Flat (stop loss: N/A).
- Sells: Flat (stop loss: N/A).
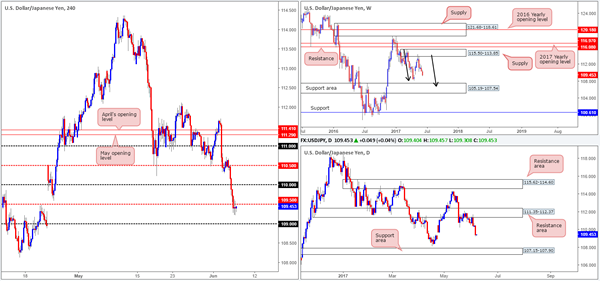
USD/JPY
The USD/JPY is trading with a reasonably strong bias to the downside at the moment, as the pair tumbled over 100 pips during yesterday's segment. H4 price, as you can see, settled below the mid-level number 109.50 and is currently holding as resistance.
Weekly bears continue to remain in a relatively strong position after pushing aggressively lower from supply registered at 115.50-113.85. We know there's a lot of ground to cover here, but this move could possibly result in further downside taking shape in the form of a weekly AB=CD correction (see black arrows) that terminates within a weekly support area marked at 105.19-107.54 (stretches all the way back to early 2014).
In conjunction with weekly flow, daily price extended the bounce seen from the resistance area penciled in at 111.35-112.37, which could see price drive lower in the coming week to 107.15-107.90: a support zone that's glued to the top edge of the said weekly support area.
Our suggestions: With the above notes in mind, our desk will be looking for (lower timeframe-confirmed – see the top of this report) shorts off 109.50 today, with an initial take-profit target set around the 109 vicinity.
Data points to consider: No high-impacting news on the docket today.
Levels to watch/live orders:
- Buys: Flat (stop loss: N/A).
- Sells: 109.50 region ([waiting for a lower-timeframe sell signal to form before pulling the trigger is advised] stop loss: dependent on where one confirms the area).
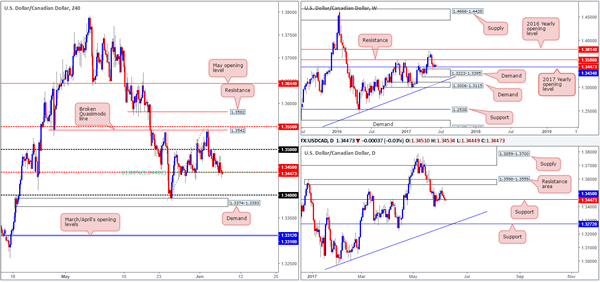
USD/CAD
The USD/CAD, as you can see, bounced nicely from the H4 mid-level hurdle 1.3450 going into yesterday's London open. This number was an area we highlighted as a possible buy zone since it also represents a daily support, unites with a 61.8% H4 Fib support line taken from the low 1.3387 and is also positioned nearby the 2017 yearly opening level at 1.3434 seen on the weekly chart. While H4 bulls are seen struggling here, this may indicate that 1.3434 may be brought into the picture sometime during today's segment.
Our suggestions: While a second bounce from 1.3434/1.3450 is high probability we believe, we'd recommend waiting for a reasonably sized H4 bullish candle to form from here, preferably a full-bodied candle. This will help avoid an unnecessary loss on a potential fake down to the 1.34 hurdle.
Data points to consider: Crude oil inventories at 3pm GMT+1.
Levels to watch/live orders:
- Buys: 1.3434/1.3450 region ([waiting for a reasonably sized H4 bull candle – preferably a full-bodied candle – to form before pulling the trigger is advised] stop loss: ideally beyond the candle's tail).
- Sells: Flat (Stop loss: N/A).
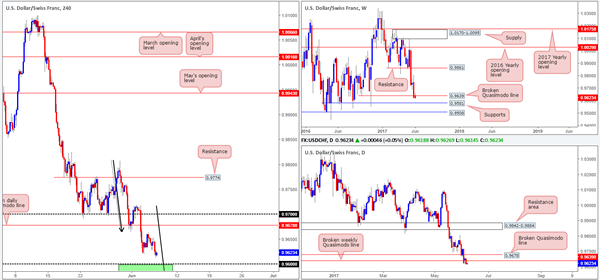
USD/CHF:
Although the USD/CHF punched lower yesterday, our outlook remains the same. On the weekly timeframe, we can see price trading beneath 0.9639: a recently broken Quasimodo line. The next downside target beyond this hurdle is seen around a support level drawn from 0.9581. Down on the daily chart, however, the unit shows the break below the above said weekly Quasimodo line could have potentially cleared the path south all the way down to 0.9546: a daily triple-bottom formation. Should price reach this line, nevertheless, we'd be wary of taking a long from here since a daily Quasimodo support level is seen lurking just below at 0.9488.
On the H4 chart, the candles are seen lurking 20 or so pips ahead of the 0.96 handle. 0.96, in our opinion, still deserves attention! Not only is it positioned nearby the weekly support mentioned above at 0.9581, it also sits close to a H4 AB=CD (see black arrows) 161.8% bullish completion point at 0.9572.
Our suggestions: Wait for H4 price to attack 0.9572/0.96 and watch to see if the H4 candles can print a reasonably sized H4 bull candle, preferably a full-bodied candle, before pushing the buy button. This, of course, will by no means guarantee a winning trade, but it will help determine buyer interest and help avoid an unnecessary loss! The first take-profit target from this base will be set around the 0.9650 area.
Data points to consider: No high-impacting news on the docket today.
Levels to watch/live orders:
- Buys: 0.9572/0.96 ([waiting for a reasonably sized H4 bull candle – preferably a full-bodied candle – to form before pulling the trigger is advised] stop loss: ideally beyond the candle's tail).
- Sells: Flat (stop loss: N/A).
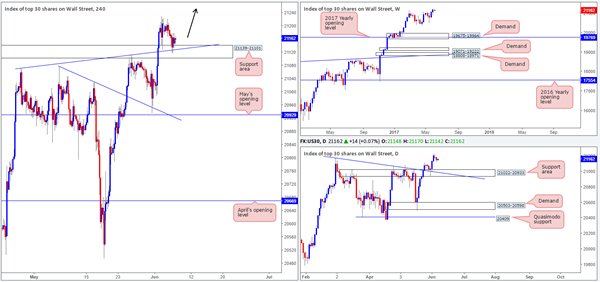
DOW 30:
During the course of yesterday's sessions, the DOW retested the H4 support area at 21139-21101 (converges with a H4 trendline support etched from the high 21072) for a second time. For those who read Tuesday's report you may recall our team saying that if this should occur, and we happen to see a bullish H4 candle present itself from here, we'd have little hesitation in jumping in long from this base.
In light of the recent action, we have taken a small long position at 21164 and placed stops below the H4 support area at 21097.
Our suggestions: Essentially, what we're looking for here is trend continuation.
Data points to consider: No high-impacting news on the docket today.
Levels to watch/live orders:
- Buys: 21164 ([live] stop loss: 21097).
- Sells: Flat (stop loss: N/A).
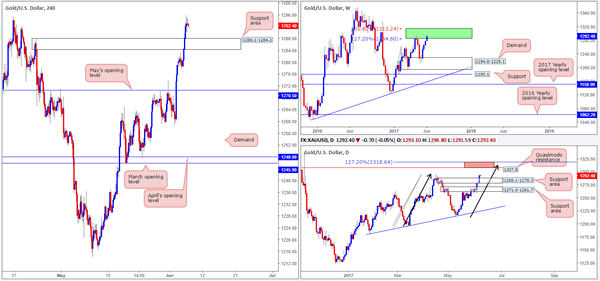
GOLD
(Trade update: took a loss at 1288.9).
As can be seen from the weekly chart, price recently entered an area comprised of two weekly Fibonacci extensions 161.8/127.2% at 1313.7/1285.2 taken from the low 1188.1 (green zone). Similar to when price struck this zone back in mid-April, we expect the bears to make an appearance here sometime soon.
Down on the daily chart, however, the supply at 1288.1-1278.3 was taken out during yesterday's trading. The removal of this zone has potentially cleared the pathway north up to the Quasimodo resistance at 1307.8. Also noteworthy is the possible AB=CD daily bearish pattern (see black arrows) that terminates a tad beyond the said Quasimodo resistance (positioned within the upper limits of the weekly green zone) at 1318.6 (127.2% ext.).
Looking over to the H4 chart, we can see that the supply zone at 1288.1-1284.2 was taken out, and has now become a potential support zone.
Our suggestions: Neither a long nor short seems attractive at this time. Buying from the current H4 support area would be risky due to where price is positioned on the weekly chart right now. And, of course, selling into a H4 support area is also not something we'd be comfortable with.
Ultimately we're watching for the daily candles to test the aforementioned Quasimodo resistance/127.2% AB=CD completion point as this is, given its location on the weekly chart (see above), an ideal sell zone (see red area), in our opinion.
Levels to watch/live orders:
- Buys: Flat (stop loss: N/A).
- Sells: 1318.6/1307.8 is a potential sell zone to keep an eye on.
European Open Briefing: Gold Is Benefiting From The Uncertainty
Global Markets:
- Asian stock markets: Nikkei down 0.15 %, Shanghai Composite gained 0.75 %, Hang Seng lost 0.05 %, ASX 200 up 0.05 %
- Commodities: Gold at $1294 (-0.25 %), Silver at $17.64 (-0.40 %), WTI Oil at $48.15 (-0.10 %), Brent Oil at $50.10 (-0.10 %)
- Rates: US 10-year yield at 2.16, UK 10-year yield at 0.99, German 10-year yield at 0.26
News & Data
- Australia GDP q/q 0.3 % vs 0.2 % expected
- Australia GDP y/y 1.7 % vs 1.5 % expected
- Australia GDP Capital Expenditure -0.6 % vs 2.5 % previous
- Australia GDP Final Consumption 0.6 % vs 0.7 % previous
- Australia AIG Construction Index 56.7 vs 51.9 previous
- Asian stocks wary ahead of risk events this week, dollar struggles – RTRS
- Oil eases on oversupply, but Mideast tension and falling U.S. stocks support – RTRS
Markets Update:
Risk appetite remains low ahead of tomorrow's events which could rattle the markets. Former FBI chief Comey will testify about his conversations with US President Trump, the ECB will decide on interest rates and UK voters are heading to the polls.
Gold is benefiting from the uncertainty. It reached a high of $1294 overnight, and it is likely that resistance at $1300 will be tested soon. A break above that level would signal a rally towards $1350.
EUR/USD consolidated in a 1.1260-80 range in Asia. It is unlikely that the pair will break above 1.13 resistance ahead of the ECB meeting tomorrow. Until then, further consolidation seems likely. No changes in rates or QE are expected from the central bank, but EUR longs are hoping that the ECB will have a slightly hawkish tone following solid economic data in the recent months.
Volatility in the GBP pairs will increase as the election day approaches. The key levels to watch are 1.2840 and 1.2780, as well as 1.2940 and 1.30 to the topside. Meanwhile, USD/JPY remains weak. The risk-off sentiment has pushed the pair to a low of almost 109. The charts are suggesting further losses are ahead, but much will depend on the outcome of tomorrow's events.
Upcoming Events:
- 07:00 BST – German Factory Orders
- 08:30 BST – UK Halifax House Price Index
- 09:00 BST – Italian Retail Sales
- 10:00 BST – Euro Zone GDP
- 15:30 BTS – US Crude Oil Inventories
Elliott Wave View: AUDUSD More Upside
Short Term Elliott Wave view in AUDUSD suggests the rally from 5/9 low is unfolding as a double three Elliott Wave structure. Up from 5/9 (0.7325) low, Minute wave ((w)) ended at 0.7517 and Minute wave ((x)) ended at 0.7368. Pair has since broken above 0.7517, adding validity that the next leg higher has started.
From 0.7368 low, the rally is also unfolding as a double three Elliott Wave structure. Minutte wave (w) ended at 0.7498 and Minutte wave (x) ended at 0.7453. Near term, while pullbacks stay above 0.7452, but more importantly as far as pivot at 0.7368 stays intact, expect pair to extend higher towards 0.756 – 0.7607 area to end cycle from 5/9 low. We don’t like selling the pair and expect buyers to appear in any dips in 3, 7, or 11 swing provided that pivot at 0.7368 remains intact.
AUDUSD 1 Hour Elliott Wave View
Risk Sentiment Has Remained Sour Ahead Of ‘Super Thursday’
Market movers today
Final euro area GDP figures are due today, providing insights into the composition of Q1 growth, which accelerated to 0.5% q/q. It will be particularly interesting to see whether the expected pickup in investments and slowing of private consumption growth is confirmed by the data. In 2017, we still expect solid GDP growth of 1.7% in the euro area. Today also brings German factory orders for April. Following two months of increases, we expect a decline in factory orders of about 0.7% for April.
In China, FX reserve data is released. We expect FX reserves in May to increase due to valuation as the USD weakened significantly and thus increased the USD value of euro reserves for example and as out flows have stopped following the tightening measures of the government . The Polish central bank holds its monetary policy meeting today, but we expect the bank to keep its policy rate unchanged at 1.5%.
In the Scandi countries, the focus today is one the industrial production data in Denmark and not least Sweden. Given the weaker-than-expected exports and production numbers in the latest Swedish Q1 GDP data, it will be interesting to see how Q2 starts out . In Denmark, bankruptcies and repossessions for May are also released, see next page.
Selected market news
Risk sentiment has remained sour ahead of 'Super Thursday' with most major equity indices in the 'red' this morning while the traditional safe havens have rallied. 10Y US treasuries have benefited from the global environment , which alongside stories of increased future Chinese demand have pushed the 10Y US yield to the lowest level since the US presidential election. Apart from the ECB meeting and the UK parliamentary election, Thursday will also bring former FBI Director James Comey testifying to Congress. The testimony will be followed closely by markets as new information could affect the policy agenda of the Trump administ ration. Yesterday, equities temporary halted losses on the story that Comey will presumably stop short of giving his own view on whether Trump obst ructed a federal probe.
Over the past few days, Trump's personal twitter account has been subject to several controversial tweets on the travel ban, a confrontation with the London Mayor and the Qatar diplomatic crisis in the Middle East . In relation to Comey's testimony, according to White House sources Trump will stand ready to live-comment 'if he feels the need to respond'.
In Norway, the monthly house price statistics from Real Estate Norway revealed the lowest May house price growth in 14 years (-0.7% m/m). The cooling housing market reflects not least a more balanced demand-supply side and tighter regulatory measures introduced at New Year. The release brought the yearly national growth rate to 8.3%, which is almost 2.5pp below Norges Bank's own forecast from t he last monet ary policy report. Meanwhile, we do not see this as an argument for an out right lower rate path at the forthcoming monetary policy meeting; rather it reduces the upside pressure on rates. However, it does remove an 'obstacle' for turning more dovish at a later stage if inflation were to disappoint strongly (not our base case).
Australia’s Economy Expanded Faster-Than-Expected In The First Quarter Of 2017
For the 24 hours to 23:00 GMT, the AUD rose 0.36% against the USD and closed at 0.7514.
LME Copper prices declined 0.8% or $46.0/MT to $5540.5/MT. Aluminium prices declined 1.3% or $24.5/MT to $1893.0/MT.
In the Asian session, at GMT0300, the pair is trading at 0.7536, with the AUD trading 0.29% higher from yesterday's close, following robust Australian gross domestic product (GDP) numbers.
Early morning data revealed that Australia's seasonally adjusted GDP expanded more-than-expected by 1.7% on an annual basis in 1Q 2017, thus painting a healthy picture of the nation's economy. Markets expected the nation's GDP to grow by 1.6%, following an advance of 2.4% in the prior quarter. Also, on a quarterly basis, the nation's economy climbed 0.3% in the first three months of 2017, at par with market expectations. GDP had recorded a rise of 1.1% in the prior quarter.
Other economic data indicated that the nation's AIG performance of construction index increased to a level of 56.7 in May, expanding at its fastest pace in more than two years. The index had registered a level of 51.9 in the previous month.
The pair is expected to find support at 0.7485, and a fall through could take it to the next support level of 0.7433. The pair is expected to find its first resistance at 0.7566, and a rise through could take it to the next resistance level of 0.7595.
Looking ahead, traders will closely monitor Australia's trade balance data for April, scheduled to release tomorrow.
The currency pair is trading above its 20 Hr and 50 Hr moving averages.

Euro-Zone’s Sentix Investor Confidence Index Surged To A Nearly Decade High Level In June
For the 24 hours to 23:00 GMT, the EUR rose 0.16% against the USD and closed at 1.1277, after the Euro-zone's Sentix investor confidence index unexpectedly rose to a nearly 10-year high level of 28.4 in June, as the upturn in investor sentiment was boosted by stronger growth and falling unemployment across the common currency region, while markets expected the index to remain steady at a level of 27.4.
Meanwhile, the region's seasonally adjusted retail sales rose less-than-expected by 0.1% on a monthly basis in April, rising for the fourth consecutive month and compared to market consensus for an advance of 0.2%. In the previous month, retail sales had registered a revised rise of 0.2%.
In the US, data revealed that JOLTs job openings surprisingly advanced to a record-high level of 6044.0K in April, compared to investor consensus for a drop to a level of 5750.0K. In the previous month, JOLTs job openings had registered a revised reading of 5785.0K.
In the Asian session, at GMT0300, the pair is trading at 1.1266, with the EUR trading 0.1% lower against the USD from yesterday's close.
The pair is expected to find support at 1.1243, and a fall through could take it to the next support level of 1.1219. The pair is expected to find its first resistance at 1.1287, and a rise through could take it to the next resistance level of 1.1307.
Going ahead, investors will look forward to Germany's factory orders for April and construction PMI for May, along with the OECD's economic outlook report for the Euro-zone, slated to release in a few hours.
The currency pair is showing convergence with its 20 Hr and 50 Hr moving averages.

Pound Trading A Tad Lower In The Asian Session
For the 24 hours to 23:00 GMT, the GBP rose slightly against the USD and closed at 1.2908.
In the Asian session, at GMT0300, the pair is trading at 1.2901, with the GBP trading marginally lower against the USD from yesterday’s close.
The pair is expected to find support at 1.2865, and a fall through could take it to the next support level of 1.283. The pair is expected to find its first resistance at 1.2943, and a rise through could take it to the next resistance level of 1.2986.
Moving ahead, market participants would eye the release of UK’s Halifax house prices data for May, scheduled to release in a few hours.
The currency pair is showing convergence with its 20 Hr and 50 Hr moving averages.

Japanese Yen Trading Marginally Lower This Morning
For the 24 hours to 23:00 GMT, the USD declined 0.93% against the JPY and closed at 109.42.
The Japanese Yen gained ground, as demand for safe-haven currency increased after a fresh wave of uncertainty washed across markets ahead of major events ahead this week.
In the Asian session, at GMT0300, the pair is trading at 109.48, with the USD trading a tad higher against the JPY from yesterday’s close.
The pair is expected to find support at 109.17, and a fall through could take it to the next support level of 108.85. The pair is expected to find its first resistance at 109.86, and a rise through could take it to the next resistance level of 110.23.
Going ahead, market participants will keep a close watch on Japan’s final 1Q GDP data, slated to release overnight.
The currency pair is showing convergence with its 20 Hr moving average and trading below its 50 Hr moving average.
