
Sample Category Title
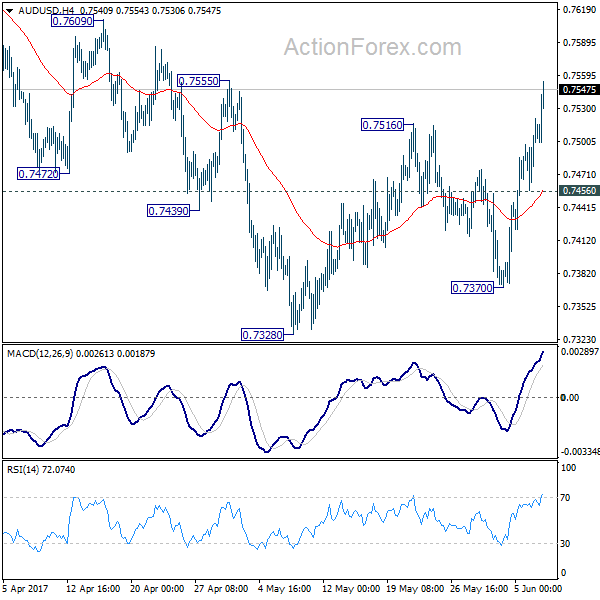
AUD/USD Daily Outlook
Daily Pivots: (S1) 0.7468; (P) 0.7495; (R1) 0.7533; More...
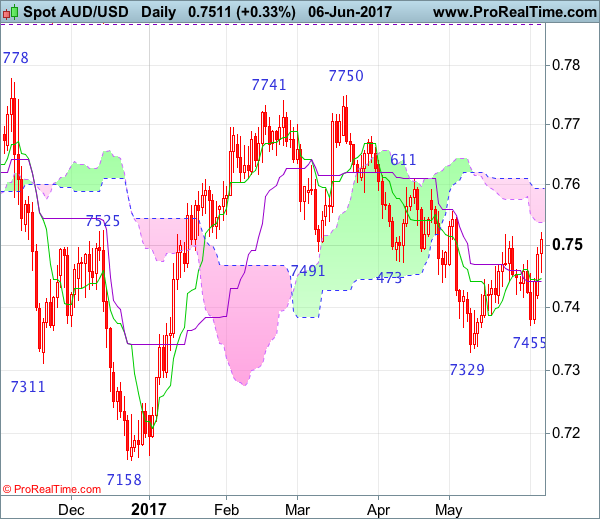
AUD/USD's strong rally and break of 0.7516 resistance indicates that the decline from 0.7748 is already completed at 0.7328. Intraday bias is back on the upside for 0.7748 and possibly above. But then, we'll be cautious on topping again as it approaches medium term fibonacci level at 0.7849. On the downside, below 0.7456 minor support will turn bias back to the downside for 0.7328 short term bottom.
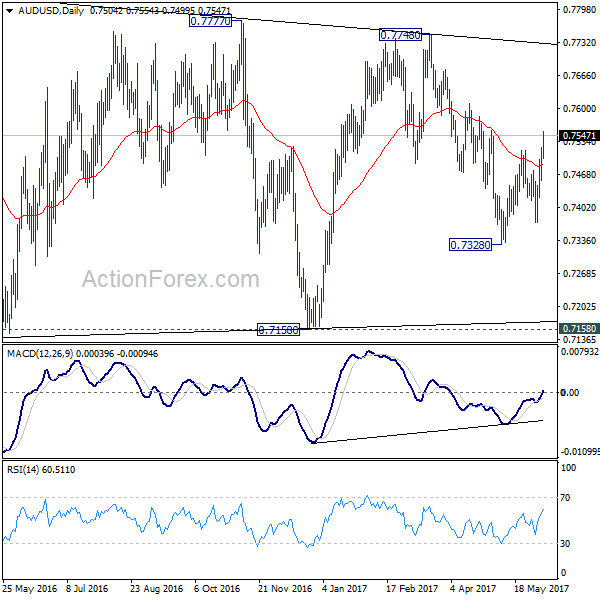
In the bigger picture, we're still treating price actions from 0.6826 low as a corrective pattern. And, as long as 38.2% retracement of 0.9504 to 0.6826 at 0.7849 holds, long term down trend from 1.1079 is expected to resume sooner or later. Break of 0.6826 low will target 0.6008 key support level. However, firm break of 0.7849 will indicate that rise from 0.6826 is developing into a medium term rebound, rather than a sideway pattern. In such case, stronger rise should be seen to 55 month EMA (now at 0.8091) and above.
Australian Dollar Surges on Record for Longest Time Without a Recession
Australian dollar surges broadly today as GDP grew 0.3% qoq in Q1, meeting market expectations, even though it's sharply slower than prior quarter's 1.1% qoq. But after all, it's the 103rd successive quarter, or 26 years, without recession. And it's now a new world record of a country without a recession. Treasurer Scott Morrison said that "the results demonstrate the continued resilience of the Australian economy:" Some analysts noted that the slowdown in Q1 showed that the economy is "tired". But Morrison blamed the weather for the slowdown in Q1 and argued that improvements would be seen ahead. He noted that RBA Governor Philip Lowe reiterated yesterday that he expects the economy to grow above 3% in the next couple of years.
Technically, AUD/USD took out 0.7516 resistance rather decisively today. The development suggests that recent decline from 0.7748 has reversed and more upside is expected in near term. EUR/AUD's break of 1.4927 support also indicates near term topping at 1.5226. Deeper fall is now in favor for the cross to head back to 55 day EMA at 1.4654.
Sterling mixed as election awaited
Sterling continues to trade mixed as markets await the highly uncertain election tomorrow. The latest Survation poll found that Prime Minister Theresa May's Conservatives at 41.5% and Labour at 40.4%, just 1.1% apart. According to YouGov's model, Conservatives could get just 304 seats in the Commons, down 26 from prior parliament. On the other hand, Labour could get 266 seats, up 37. That is, neither one will get the 323 seats required for absolute majority.
We'll try not to predict the outcome of the election, which now becomes too hard to predict. But we do have anticipation on market reactions depending on the outcome. It should be noted again that Sterling surged sharply when May announced the snap election. Conservatives had over 20 pts lead over Labour back then. And the Pound started to struggle when Labour gained momentum recently. We'd expect to see such pattern continue as the vote counts are being released.
Dollar mixed with eyes on Comey
Dollar is trading mixed ahead of former FBI Director James Comey's hearing with Senate intelligence committee tomorrow. It's reported that Director of National Intelligence Daniel Coats and CIA Chief Mike Pompeo received closed-door complaint by US President Donald Trump regarding Comey's handling of the investigation of Russia's intervention in the 2016 election. But the Office of the Director of National Intelligence declined to comment. Meanwhile, it's reported that Comey has asked Attorney General Jeff Sessions not to leave him alone with Trump.
On the data front
New Zealand manufacturing activity rose 2.8% in Q1. Australia GDP rose 0.3% qoq in Q1. Japan leading index dropped to 104.5 in April. German factory orders dropped -2.% mom in April. Swiss foreign currency reserves dropped slightly to CHF 694b in May. Canada building permits will be released later in the day.
AUD/USD Daily Outlook
Daily Pivots: (S1) 0.7468; (P) 0.7495; (R1) 0.7533; More...
AUD/USD's strong rally and break of 0.7516 resistance indicates that the decline from 0.7748 is already completed at 0.7328. Intraday bias is back on the upside for 0.7748 and possibly above. But then, we'll be cautious on topping again as it approaches medium term fibonacci level at 0.7849. On the downside, below 0.7456 minor support will turn bias back to the downside for 0.7328 short term bottom.
In the bigger picture, we're still treating price actions from 0.6826 low as a corrective pattern. And, as long as 38.2% retracement of 0.9504 to 0.6826 at 0.7849 holds, long term down trend from 1.1079 is expected to resume sooner or later. Break of 0.6826 low will target 0.6008 key support level. However, firm break of 0.7849 will indicate that rise from 0.6826 is developing into a medium term rebound, rather than a sideway pattern. In such case, stronger rise should be seen to 55 month EMA (now at 0.8091) and above.
Economic Indicators Update
| GMT | Ccy | Events | Actual | Forecast | Previous | Revised |
|---|---|---|---|---|---|---|
| 22:45 | NZD | Manufacturing Activity Q1 | 2.80% | 0.30% | 0.80% | 1.30% |
| 1:30 | AUD | GDP Q/Q Q1 | 0.30% | 0.30% | 1.10% | |
| 5:00 | JPY | Leading Index Apr P | 104.5 | 104.3 | 105.5 | |
| 6:00 | EUR | German Factory Orders M/M Apr | -2.10% | -0.30% | 1.00% | 1.10% |
| 7:00 | CHF | Foreign Currency Reserves May | 694B | 696B | 697B | |
| 7:30 | GBP | Halifax House Prices M/M May | -0.20% | -0.10% | ||
| 12:30 | CAD | Building Permits M/M Apr | -5.80% | |||
| 14:30 | USD | Crude Oil Inventories | -6.4M |
Markets In Cautious Mode Ahead Of ‘Super Thursday’
Investors remain cautious for a third day in a row ahead of several key events that may spark volatility including former FBI Director James Comey's testimony, the UK general election and the ECB meeting, which are all taking place on Thursday.
Risk assets are obviously not ideal at this stage as any of the three major events may trigger a selloff in equity markets, which explains some investors' behavior who have moved into the defensive. While safe havens such as treasuries, gold, and the Japanese Yen rallied, some traders might be questioning the status of the U.S. dollar which fell to a seven-month low.
Economic data alone is not enough to justify the new post-Presidential election low in the Greenback especially when the Fed remains the only major central bank tightening monetary policy. So, what's going wrong here?
I think the explanation may be found in U.S. treasury yields. The short end of the yield curve is mainly determined by monetary policy actions, and given that the Fed is still expected to raise interest rates in June, and probably another hike by year end, yields on the two-year treasury notes may remain well supported. However, the falling end of the treasury yield curve which reflects investors' future growth and inflation expectations has more to say, and I can see clear signals that investors are growing more skeptical towards the reflation trade which drove equities to record highs in 2017.
The ten-year treasury yields fell to 2.13% yesterday, the lowest level since November 10th, and the differential between the two-year and ten-year yields are back to levels prior to Trump's election. This should be a warning signal, not just for the U.S. dollar but also for equity markets trading at high multiples. The justification for overstretched valuations might not be supported much longer as a failure to pursue the promised tax reforms and stimulus plans will eventually trigger a selloff. At this stage, I still recommend remaining well diversified with a blend of growth and value stocks, but should pessimism grow towards Trump's administration, then moving into the defensive sector will be a better play.
Comey's testimony is crucial tomorrow. While it's known that many questions will remain unanswered, the biggest question remains to be whether the former FBI director will accuse the President of abusing his power to derail the FBI's investigation and whether there's any indication of potential links between Russia and the Trump election campaign. Should the testimony reveal any unexpected surprises, the same will be reflected in the financial markets.
EUR/GBP: Most Of The Bad News For Sterling Discounted?
The US dollar continued to remain weak with price action yesterday showing the greenback extending the declines. This kept the EUR/USD biased to the upside, although price action was largely muted. Investors will be looking to the "Super Thursday" tomorrow where the ECB meeting alongside the UK elections will impact the markets.
The uncertainty is evident by the fact that the euro and the British pound remains subdued. On the economic front, the economic calendar today is light with the early Asian session seeing the release of the quarterly GDP report from Australia.
Official data showed that the Australian GDP expanded 0.3% on a quarterly basis, slightly better than expected, but weakened, following the 1.1% Q4 2016 economic expansion
EURUSD intraday analysis
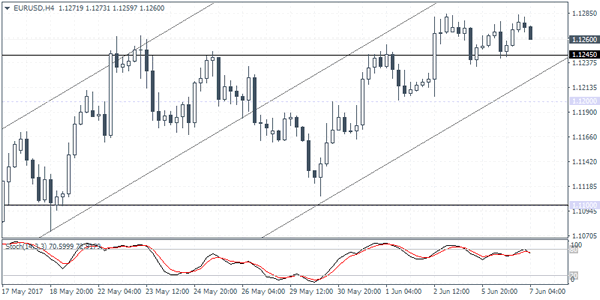
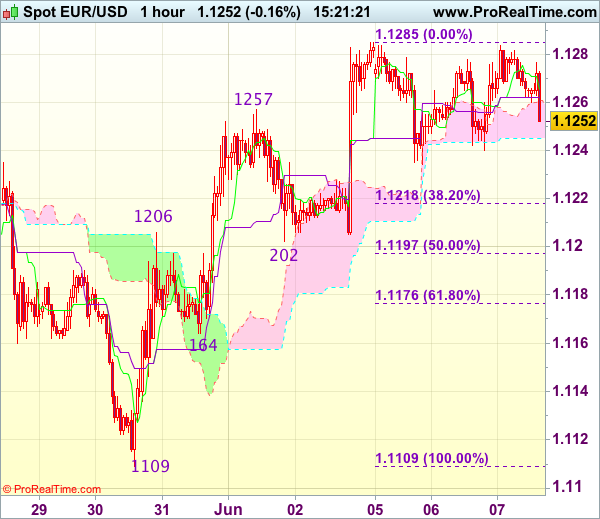
EURUSD (1.1260): EURUSD was bullish yesterday, but price action continues to be maintained within Friday's range. With price action supported above 1.1245, the bias remains to the upside. The current decline could see EURUSD slipping back to test this support as investors are likely to book profits ahead of the ECB meeting tomorrow. On the 4-hour chart, the bearish divergence is building up, and this warrants caution as price action could risk invalidating the bullish flag pattern on the daily chart. A decline below 1.1245 could signal a test towards 1.1200 support level.
GBPUSD intraday analysis
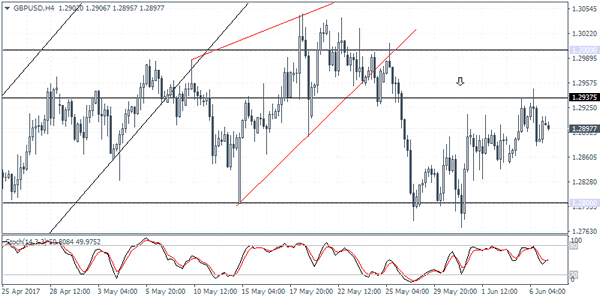
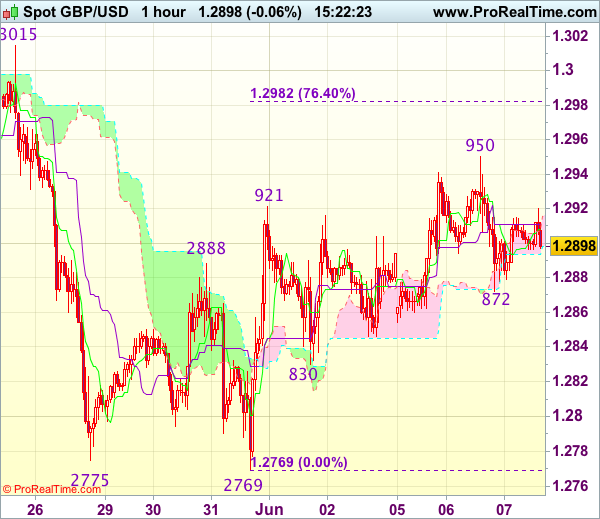
GBPUSD (1.2897): The British pound closed with a doji yesterday, but price action remained broadly flat with the bullish momentum being maintained above 1.2800 support level. A decline to the downside could signal a continuation on a break down below this support. On the 4-hour chart, we can see price testing the minor resistance level at 1.2937 with a doji close. This potentially suggests that GBPUSD could test 1.2800 in the event of a downside move. Therefore, the possible decline to 1.2600 which marks the downside target in the head and shoulders pattern remains.
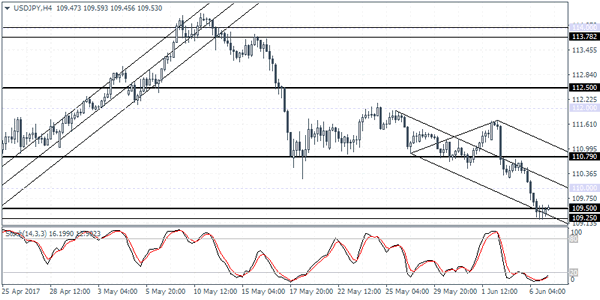
USDJPY intraday analysis
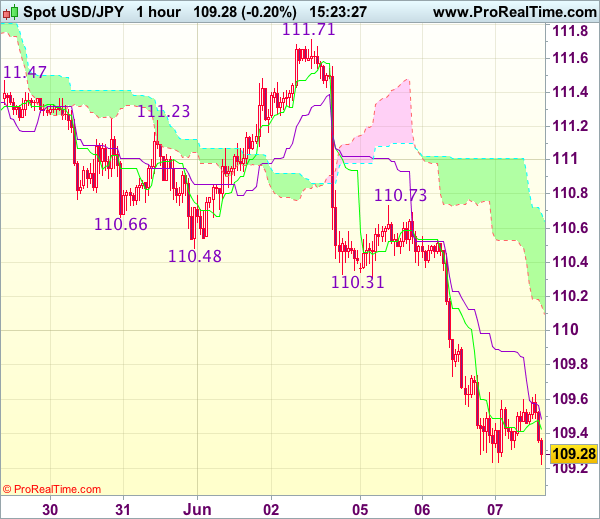
USDJPY (109.53):The USDJPY extended the declines, falling to a fresh two-month low. However, price action is likely to remain subdued with the longer-term support zone seen at 109.50 - 109.25. Currently, we notice price action consolidating at this level. However, unless a higher low is formed to the upside, USDJPY remains biased lower with the potential to test 108.30 support level. To the upside, a retracement could, however, keep USDJPY recover to retest 110.79 where resistance level is likely to be developed.
AUD/USD Candlesticks and Ichimoku Analysis
Weekly
• Last Candlesticks pattern: Shooting doji
• Time of formation: 20 Feb 2017
• Trend bias: Sideways
Daily
• Last Candlesticks pattern: Bearish engulfing pattern
• Time of formation: 21 Mar 2017
• Trend bias: Near term down
Aussie has rallied after finding renewed buying interest at 0.7372 last week on broad-based weakness in the greenback, the subsequent break of resistance at 0.7518 signals a temporary low has been formed at 0.7329, hence consolidation with upside bias is seen for the rebound from there to extend gain to another previous resistance at 0.7611, having said that, aussie needs to break this level to signal the fall from 0.7750 top has ended and bring subsequent rise towards resistance at 0.7680 but price should falter below chart resistance at 0.7750.
On the downside, whilst initial pullback to 0.7500 and possibly towards the Tenkan-Sen (now at 0.7464) cannot be ruled out, reckon downside would be limited to 0.7415-20 and bring another rebound later. Only below said support at 0.7372 would revive bearishness and suggest the rebound from 0.7329 has ended, bring retest of this level, break there would extend recent fall from 0.7750 top to 0.7300 and possibly 0.7250-60 but reckon downside would be limited to 0.7200-10 and price should stay well above indicated previous chart support at 0.7158.
Recommendation: Stand aside for this week.
On the weekly chart, aussie found good support at 0.7372 and has staged a strong rebound (a long white candlestick looks set to be formed this week), adding credence to our view that low has been formed at 0.7329, hence consolidation with upside bias is seen for further gain towards previous resistance at 0.7611, however, break there is needed to signal the fall from 0.7750 has ended at 0.7329, bring further gain towards resistance at 0.7680, having said that, price should falter below said resistance at 0.7750.
On the downside, although pullback to 0.7500 cannot be ruled out, reckon the Tenkan-Sen (now at 0.7470) would limit downside and bring another rebound. A weekly close below the Kijun-Sen (now at 0.7454) would risk weakness to 0.7400 but only break of said support at 0.7372 would suggest the rebound from 0.7329 has ended and revive bearishness for reset of tis level. A break there would extend recent decline from 0.7750 to 0.7290-00 and possibly towards 0.7230, however, downside should be limited to 0.7200 and price should stay well above previous support at 0.7158, risk from there is seen for a rebound to take place later.
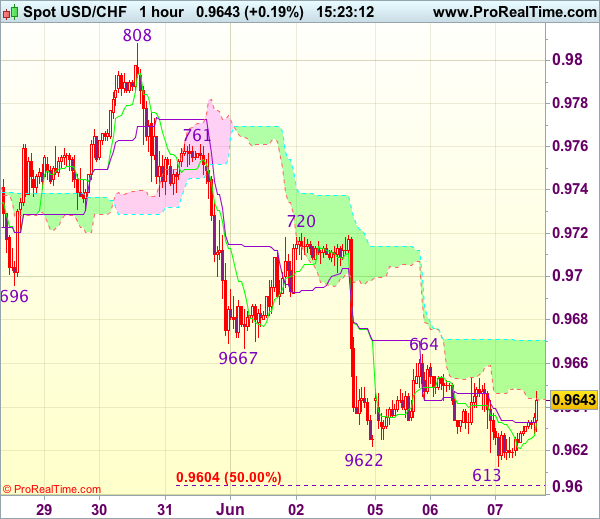
Trade Idea : USD/CHF – Sell at 0.9700
USD/CHF - 0.9638
Most recent candlesticks pattern : N/A
Trend : Near term down
Tenkan-Sen level : 0.9633
Kijun-Sen level : 0.9633
Ichimoku cloud top : 0.9671
Ichimoku cloud bottom : 0.9644
Original strategy :
Sell at 0.9685, Target: 0.9585, Stop: 0.9720
Position : -
Target : -
Stop : -
New strategy :
Sell at 0.9700, Target: 0.9600, Stop: 0.9735
Position : -
Target : -
Stop : -
As the greenback has recovered after marginal fall to 0.9613, suggesting consolidation above this level would be seen and corrective bounce to the upper Kumo (now at 0.9671) is likely, however, reckon upside would be limited to 0.9700-05 and bring another decline later to 0.9600-05 (50% projection of 1.0100-0.9692 measuring from 0.9808) but oversold condition should limit downside to 0.9570 and price should stay above support at 0.9550, risk from there has increased for a rebound to take place later.
In view of this, we are looking to sell dollar on recovery as 0.9700 should limit upside. Only break of resistance at 0.9720 would abort and signal a temporary low is formed instead, bring a stronger rebound to 0.9750 and then 0.9761 resistance but price should falter below resistance at 0.9808.
Trade Idea : GBP/USD – Stand aside
GBP/USD - 1.2892
Most recent candlesticks pattern : N/A
Trend : Near term down
Tenkan-Sen level : 1.2906
Kijun-Sen level : 1.2911
Ichimoku cloud top : 1.2907
Ichimoku cloud bottom : 1.2894
New strategy :
Stand aside
Position : -
Target : -
Stop : -
Sterling’s retreat after yesterday’s brief rise to 1.2950 has retained our view that further consolidation below this level would be seen and pullback to 1.2865-70 cannot be ruled out, however, break of indicated support at 1.2830 is needed to confirm top has been formed and suggest the rebound from 1.2769 has ended, bring further fall to 1.2800.
On the upside, expect recovery to be limited to 1.2925-30 and said resistance at 1.2950 should remain intact, bring another retreat later. Only break there would extend the erratic rise from 1.2769 to 1.2970, however, as broad outlook remains consolidative, reckon upside would be limited to 1.3000 and indicated previous resistance at 1.3015 should remain intact. As near term outlook is still mixed, would be prudent to stand aside for now.
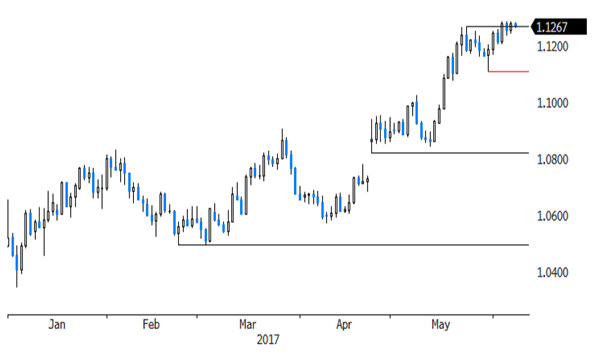
Trade Idea : EUR/USD – Hold long entered at 1.1205
EUR/USD - 1.1254
Most recent candlesticks pattern : N/A
Trend : Up
Tenkan-Sen level : 1.1263
Kijun-Sen level : 1.1262
Ichimoku cloud top : 1.1261
Ichimoku cloud bottom : 1.1245
Original strategy :
Bought at 1.1205, Target: 1.1305, Stop: 1.1235
Position : - Long at 1.1205
Target : - 1.1305
Stop : - 1.1235
New strategy :
Hold long entered at 1.1205, Target: 1.1305, Stop: 1.1235
Position : - Long at 1.1205
Target : - 1.1305
Stop : - 1.1235
As the single currency has retreated again after faltering just below indicated resistance at 1.1285, retaining our view that further consolidation below this level would be seen, however, as long as 1.1235-40 holds, mild upside bias remains for recent upmove to resume after consolidation, above said resistance at 1.1285 would extend rise to another previous chart resistance at 1.1300, break there would encourage for headway to 1.1340-45 but overbought condition should limit upside to chart point at 1.1366.
In view of this, we are holding on to our long position entered at 1.1205. Only below support at 1.1202 would abort and signal top is formed instead, risk weakness towards indicated support at 1.1164, once this level is penetrated, this would signal recent upmove has ended, bring further fall to 1.1130-40 first.
Trade Idea : USD/JPY – Sell at 109.90
USD/JPY - 109.26
Most recent candlesticks pattern : N/A
Trend : Down
Tenkan-Sen level : 109.43
Kijun-Sen level : 109.48
Ichimoku cloud top : 110.69
Ichimoku cloud bottom : 110.15
Original strategy :
Sell at 110.20, Target: 109.20, Stop: 110.55
Position : -
Target : -
Stop : -
New strategy :
Sell at 109.90, Target: 108.90, Stop: 110.25
Position : -
Target : -
Stop : -
As the greenback has fallen again after brief recovery, suggesting recent decline from 114.37 is still in progress and bearishness remains for further weakness to 109.00-05 (1.236 times projection of 111.71-110.31 measuring from 110.73), then towards 108.70-75 but near term oversold condition should limit downside to 108.45-50 (1.618 times projection), bring rebound later.
In view of this, would not chase this fall here and would be prudent to sell dollar on recovery as 109.90-00 should limit upside and bring another decline. Above previous support at 110.24 (now resistance) would defer and suggest low is formed instead, bring a stronger rebound to 110.60 but resistance at 110.73 should remain intact.
Currencies: Dollar Holds Near Recent Lows Against Euro And Yen
Sunrise Market Commentary
- Rates: US yields test 2017 lows
Risk sentiment on equity markets will probably be the main driver ahead of tomorrow's key events. The US 5-yr (1.69%), 10-yr (2.17%) and 30-yr (2.82%) yield are testing key support levels. The boost in US inflation expectations after Trump's election victory is completely erased as markets question his ability to implement his promised fiscal stimulus. - Currencies: Dollar holds near recent lows against euro and yen
A modest risk-off session pressured core bond yields and weighed on the dollar yesterday. Markets will continue to count down to tomorrow's multiple event risk. After the recent euro rebound, a modestly positive change in the ECB's assessment should be discounted in the euro. Is this enough to prevent a break beyond the 1.1300/66 resistance?
The Sunrise Headlines
- Caution is still the key word on the markets this morning. Yen is stabilizing near highest level in a month and gold is holding its gains. Reluctance to add to risk positions is high.
- Australian GDP growth is largely in line with expectations. GDP grew by 0.3% Q/Q % in Q1, down from a 1.1% Q/Q in Q4 2016. The Aussie dollar climbed to 1.326 USD, continuing its recent up-move and putting bullish double bottom on the charts.
- The American JOLTS-figure reached record high in April. The data suggest that the recent slowdown in the pace of nonfarm payrolls hiring stems from skills gaps rather than increased layoffs.
- Trump yesterday uttered support for the Saudi-led diplomatic isolation of Qatar. He called it punishment for the country's financial support for Islamic extremists. Trump's staff members were however quick to soften the stance.
- Brent oil gained about 1 USD per barrel yesterday evening but halted gains around 50 USD/barrel as US industry data showed gasoline stockpiles expanded.
- IMF proposal offering a way out of Greece's debt impasse was shot down by the Greek government yesterday because it pushes back debt decisions again as the IMF would only pay out aid after debt relief measure are clarified.
- Today calendar is light but Super Thursday with FBI chief Comey testimony, ECB policy gathering and UK elections just around the corner
Currencies: Dollar Holds Near Recent Lows Against Euro And Yen
Dollar near recent lows against euro and yen
There were no important data or events to guide FX trading. The yen outperformed on investor caution ahead of the key event risks later this week. USD/JPY dropped below the 110 barrier and closed the session at 109.41. EUR/USD dropped to the mid 1.1250 area in Europe, but USD weakness again dominated later in US dealings. EUR/USD revisited the recent top and closed the session at 1.1277.
Overnight, regional Asian indices trade slightly positive with China outperforming as the recent CNY rally slows. Investors continue looking forward to tomorrow's events with market moving potential, including the testimony of former FBI director Comey. USD/JPY is trading in the 110.50/60 area, slightly off yesterday's correction low (109.23). The dollar also remains in the defensive against the single currency (EUR/USD 1.1265). The Australian Q1 GDP was close to expectations at 0.3% Q/Q and 1.7% Y/Y. Still, the report was strong enough to extend the recent rebound of the Aussie dollar. AUD/USD trades in 0.7540 area (compared to sub- 0.74 levels at the end of last week).
The eco calendar is again extremely thin today. The OECD economic outlook will inspire some headlines, but it won't be a game-changer for trading. In the run-up to tomorrow's ECB meeting/staff projections, investors might keep an eye at the EMU inflation projection. A soft forecast might be slightly negative for the euro. Global factors and upcoming event risk will (Comey testimony, ECB and UK election) will again dominate FX trading. Investor caution weighed on core bond yields and on the dollar yesterday. We expect more wait-and-see trading today, maybe with a slight risk-off bias. In this context, a meaningful USD/JPY rebound is unlikely, even as quite some caution is probably discounted after the recent decline. Regarding EUR/USD, we advocated yesterday that a modestly positive change in tomorrow's ECB's assessment is probably already discounted. Even so, the euro remains well bid going into tomorrow's ECB meeting. USD weakness dominates. We maintain the working hypothesis that there is no real big case for EUR/USD to trade sustainably above 1.13/1.1366 unless there comes high profile negative news from the US or unless the ECB makes a really hawkish U-turn. We don't preposition for either of these scenario's
Technical picture
The USD/JPY rally ran into resistance in early May. A mini sell-off pushed the pair below the previous top (112.20), making the short-term picture negative. At the end of last week, there were tentative signs that the decline could slow. However, the post-payrolls decline and yesterday's break below 110 made the picture again outright negative. Return action lower in the 108.13/114.37 range remains possible.
Earlier in May, EUR/USD failed to break below the 1.0821/1.0778 support (gap). Poor US data and political upheaval propelled EUR/USD north of the 1.1023 range top. The pair initially reached a short-term correction top at 1.1268. There was a minor break after Friday's disappointing US payrolls, but for now there are no sustained follow-through gains. The Trump top/correction top at 1.1300/1.1366 is next resistance. USD sentiment will have to be quite negative to clear this hurdle short-term. A return below 1.1023 would indicate that the upside momentum has eased.
EUR/USD continues to challenge the post-payrolls top
EUR/GBP
Sterling in wait-and-see modus ahead of UK election
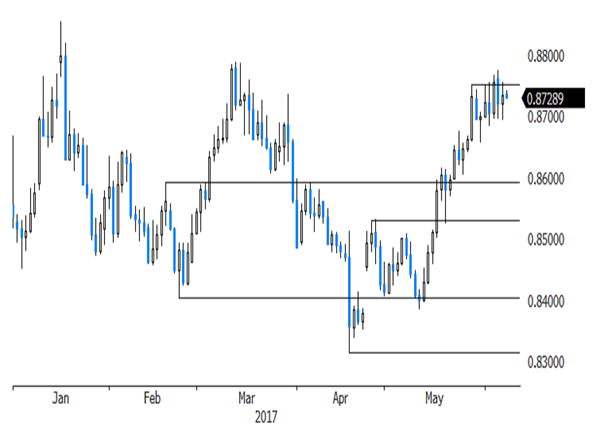
Yesterday, there was no clear story to guide sterling trading. The UK currency slightly regained ground against the euro, but that move also mirrored a temporary euro setback. EUR/GBP dropped to the 0.87 area but soon found a bottom. There was no change in the election story. The Conservative Party maintained a (reduced) lead. Later in the session, some modest sterling pressure resurfaced. However, this was technically insignificant. EUR/GBP closed the session at 0.8734. Cable closed the session just north of 1.29.
Today, the UK eco calendar only contains the Halifax house prices, but we don't expect this to be a market mover. The focus will remain on tomorrow's election. The lead of the conservative party is declining, but they are still in pole position. We don't expect a sustained rebound of sterling, but some profit taking of sterling shorts going into the final stage of the election remains possible. So, a break of EUR/GBP beyond the recent top might become more difficult. First resistance comes in the 0.8774/88 area. EUR/GBP 0.8655 is a first minor support. A sustained return below the EUR/GBP 0.86 alert would suggest that the worst is over for sterling.
EUR/GBP: most of the bad news for sterling discounted?