Sample Category Title
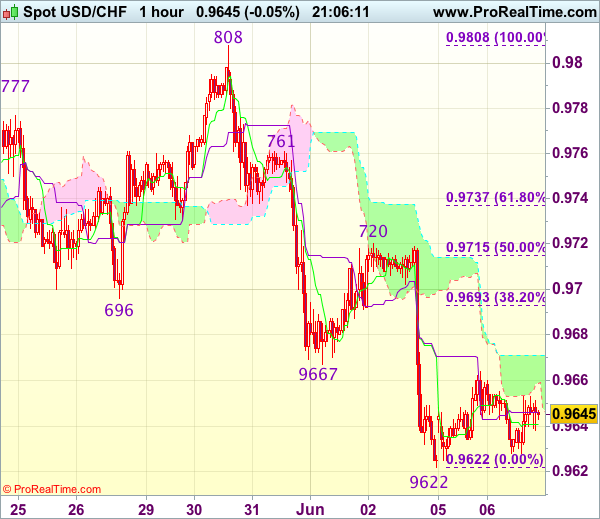
Trade Idea Wrap-up: USD/CHF – Sell at 0.9685
USD/CHF - 0.9630
Most recent candlesticks pattern : N/A
Trend : Near term down
Tenkan-Sen level : 0.9641
Kijun-Sen level : 0.9646
Ichimoku cloud top : 0.9671
Ichimoku cloud bottom : 0.9654
Original strategy :
Sell at 0.9685, Target: 0.9585, Stop: 0.9720
Position : -
Target : -
Stop : -
New strategy :
Sell at 0.9685, Target: 0.9585, Stop: 0.9720
Position : -
Target : -
Stop : -
As the greenback has remained under pressure after Friday’s selloff, bearishness remains for recent decline to resume after consolidation, below support at 0.9622 would extend weakness to 0.9600-05 (50% projection of 1.0100-0.9692 measuring from 0.9808) but oversold condition should limit downside to 0.9570 and price should stay above support at 0.9550, risk from there has increased for a rebound to take place later.
In view of this, we are looking to sell dollar on recovery as 0.9685-90 should limit upside. Only break of resistance at 0.9720 would abort and signal a temporary low is formed instead, bring a stronger rebound to 0.9750 and then 0.9770 but price should falter below resistance at 0.9808.
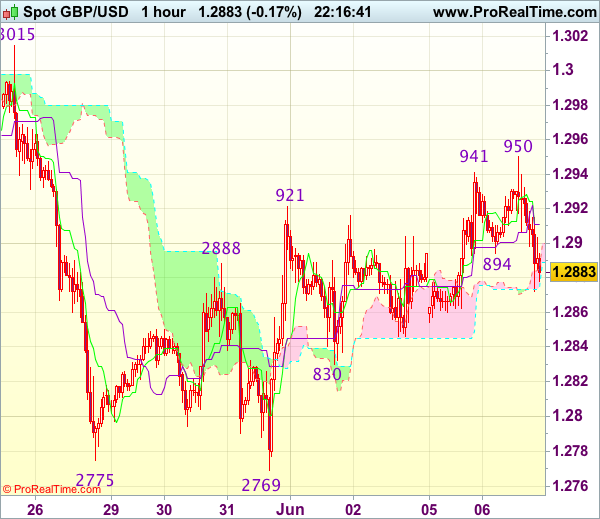
Trade Idea Wrap-up: GBP/USD – Stand aside
GBP/USD - 1.2890
Most recent candlesticks pattern : N/A
Trend : Near term down
Tenkan-Sen level : 1.2927
Kijun-Sen level : 1.2906
Ichimoku cloud top : 1.2873
Ichimoku cloud bottom : 1.2872
New strategy :
Stand aside
Position : -
Target : -
Stop : -
As sterling has retreated after intra-day brief rise to 1.2950, suggesting consolidation below this level would be seen and pullback to 1.2865-70 cannot be ruled out, however, break of indicated support at 1.2830 is needed to confirm top has been formed and suggest the rebound from 1.2769 has ended, bring further fall to 1.2800.
On the upside, expect recovery to be limited to 1.2925-30 and said resistance at 1.2950 should remain intact, bring another retreat later. Only break there would extend the erratic rise from 1.2769 to 1.2970, however, as broad outlook remains consolidative, reckon upside would be limited to 1.3000 and indicated previous resistance at 1.3015 should remain intact. As near term outlook is still mixed, would be prudent to stand aside for now.
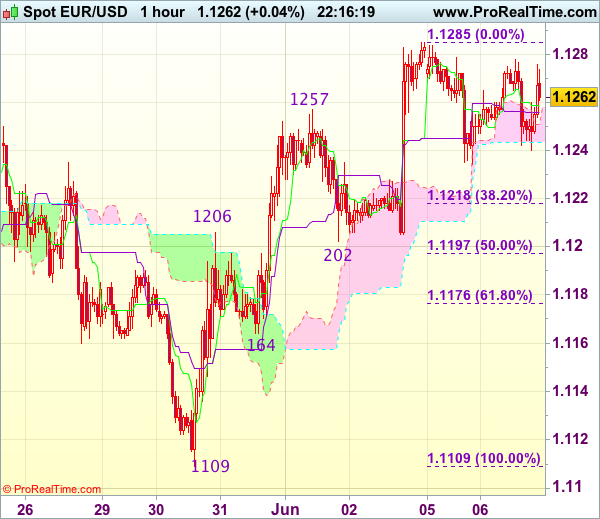
Trade Idea Wrap-up: EUR/USD – Hold long entered at 1.1205
EUR/USD - 1.1270
Most recent candlesticks pattern : N/A
Trend : Up
Tenkan-Sen level : 1.1259
Kijun-Sen level : 1.1256
Ichimoku cloud top : 1.1251
Ichimoku cloud bottom : 1.1244
Original strategy :
Bought at 1.1205, Target: 1.1305, Stop: 1.1235
Position : - Long at 1.1205
Target : - 1.1305
Stop : - 1.1235
New strategy :
Hold long entered at 1.1205, Target: 1.1305, Stop: 1.1235
Position : - Long at 1.1205
Target : - 1.1305
Stop : - 1.1235
As the single currency retreated after faltering below resistance at 1.1285 in part due to cross-selling against yen, suggesting further consolidation below this level would be seen, however, as long as 1.1235-40 holds, mild upside bias remains for recent upmove to resume after consolidation, above said resistance at 1.1285 would extend rise to another previous chart resistance at 1.1300, break there would encourage for headway to 1.1340-45 but overbought condition should limit upside to chart point at 1.1366.
In view of this, we are holding on to our long position entered at 1.1205. Only below support at 1.1202 would abort and signal top is formed instead, risk weakness towards indicated support at 1.1164, once this level is penetrated, this would signal recent upmove has ended, bring further fall to 1.1130-40 first.
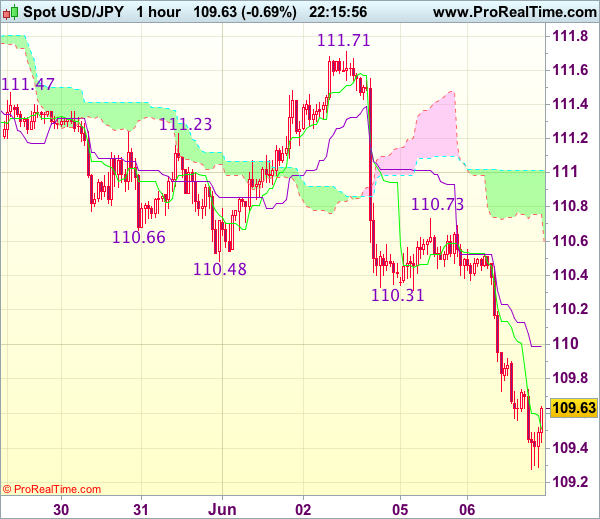
Trade Idea Wrap-up: USD/JPY – Sell at 110.20
USD/JPY - 109.60
Most recent candlesticks pattern : N/A
Trend : Down
Tenkan-Sen level : 109.51
Kijun-Sen level : 109.99
Ichimoku cloud top : 111.01
Ichimoku cloud bottom : 110.76
Original strategy :
Sell at 110.00, Target: 109.00, Stop: 110.35
Position : -
Target : -
Stop : -
New strategy :
Sell at 110.20, Target: 109.20, Stop: 110.55
Position : -
Target : -
Stop : -
As the greenback met renewed selling interest at 110.73 yesterday and decline has accelerated after breaking below indicated support at 110.24, confirming our bearish view that recent decline from 114.37 top is still in progress and bearishness remains for further weakness to 109.00-05 (1.236 times projection of 111.71-110.31 measuring from 110.73), then towards 108.70-75 but near term oversold condition should limit downside to 108.45-50 (1.618 times projection), bring rebound later.
In view of this, would not chase this fall here and would be prudent to sell dollar on recovery as previous support at 110.24 should turn into resistance and cap dollar’s upside, bring another decline. Above 110.31 (another previous support) would defer but only break of said resistance at 110.73 would signal low is formed instead.
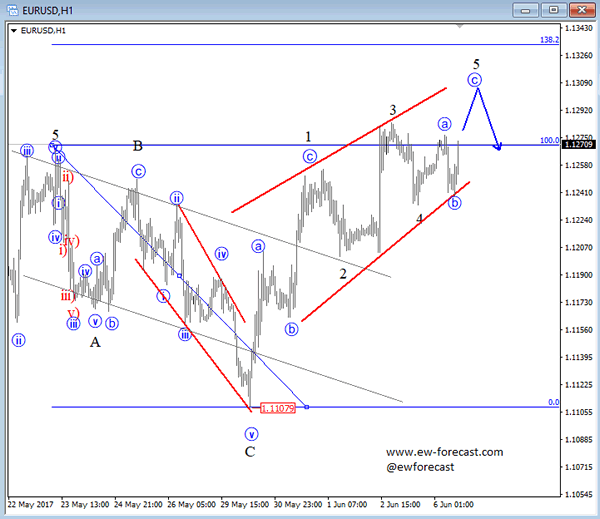
Elliott Wave Analysis: EURUSD Looking For A Reversal
EURUSD is ticking higher at the start of the US session, now ideally into wave five, which is final leg of a potential ending diagonal within uptrend. Ending diagonal can indicate a very powerful reversal, but only when completed, so looking for a EURUSD top now can be too soon. We do not want to call something untill this is confirmed by a market price and reaction. In other words, we need a strong reversal down from around 1.3000-1.3100 area before we may start looking for evidences of lower euro.
‘By Default’ Yen-Buying Dominates in Uneventful Session
- Caution reigns across markets ahead of risk events ranging from the FBI chief Comey's congressional testimony to the ECB's policy meeting and Britain's election fever. The rally to safe havens including gold, the yen and Treasuries continues while stocks lost ground. Main European indices drop up to 1% and the US opens up to 0.3% weaker.
- April Eurozone retail sales came in at 0.1% M/M, below 0.2% M/M consensus while the April reading was downwardly revised from 0.3% M/M to 0.2% M/M. On a yearly basis, retail sales stabilized at 2.5% Y/Y.
- French President Emmanuel Macron's party will have an absolute majority in the lower house of parliament, an Ipsos poll for France Televisions shows. If correct, this would defy widespread concerns that the political newcomer's plans for economic reform would be blocked by a hostile legislature.
- South Africa's growth contracted unexpectedly by 0.7% Q/Q in Q1 while the consensus had counted on a 1% expansion. All industries except agriculture and mining contracted in the first quarter, the statistics office said. On this news, the rand lost almost two points and tested the 12.9 USD/ZAR level.
- The debate in the Italian Lower House on the electoral law draft bill has started today. The draft bill could be passed by the Lower House assembly as early as the end of this week. The acceleration of the electoral law approval makes the scenario of early elections in autumn 2017 increasingly likely.
Rates
US yield support levels under severe test
Global core bonds gained ground today with US Treasuries outperforming German Bunds. Investors found their way to safe haven assets amid an extremely thin eco calendar (EMU retail sales 0.1% M/M in April vs 0.2% M/M consensus) and ahead of Thursday's big events (UK elections, ECB meeting, Comey hearing). The developing tensions in the Gulf region prompted more cautiousness. European stocks lost up to 1%, while the Japanese yen gained on FX markets. US yields extensively test key support levels (2017 lows). Investors started doubting US president Trump's pro-growth agenda since he tumbled from one political scandal into the other. US 5y5y forward inflation swap dropped from 2.4% at the end of April to 2.2% currently, matching levels from ahead of Trump's presidential elections. US yields crumbled in lockstep despite the prospect of more near-term Fed tightening (June rate hike) and the probable start of the central bank's balance sheet run-off in H2 2017. The US 5-yr yield tests 1.69% support, the US 10-yr yield dipped below 2.16% and the US 30-yr yield below 2.82%. The technical breaks aren't confirmed yet, but merit attention.
At the time of writing, the US yield curve shifts 2 bps (2-yr) to 4.4 bps (10-yr) lower, with the belly of the curve outperforming the wings. The German yield curve bull flattens with yields 1.4 bps (2-yr) to 3.5 bps (30-yr) lower. On intra-EMU bond markets, 10-yr yield spreads versus Germany narrow up to 3 bps with Greece & Portugal underperforming (+4 bps).
The Austrian Treasury tapped the on the run 7-yr RAGB (€0.575B 0% Jul2023) and 10-yr RAGB (€0.625B 0.5% Apr2027) for a combined €1.2B, the maximum amount on offer. The auction bid cover was strong (2.2). The Treasury set aside an additional €0.18B of both bonds for secondary market operations. The Italian debt agency announced the launch of a new 30-yr benchmark (Mar2048) in the near future via syndication. The bond will likely be priced tomorrow.
Currencies
'By default' yen-buying dominates in uneventful session
There were no important data or other high profile news to guide FX trading today. The yen outperformed on investors caution ahead of the key event risks later this week. USD/JPY dropped below the 110 barrier and hovers in the mid 109 area. EUR/USD shows no clear trend. EUR/USD dropped to the 1.1250 area as investors are cautious to add euro longs going into Thursday's ECB meeting.
Overnight, Asian equities traded cautiously negative with Japan underperforming. USD/JPY dropped below the post-payrolls lows, triggering additional yen buying. The pair fell below the psychological barrier of 110 and traded in the 109.70 area at the start of European dealings. USD/JPY's decline also weighed slightly on the dollar against the euro. EUR/USD returned to the 1.1275 area, but the recent top stayed out of reach. The decline of EUR/JPY prevented further EUR/USD gains.
There were hardly any data or other news to guide FX trading in Europa. Investors caution prevailed ahead of the multiple event risks that might disturb trading later this week. European equities fell prey to modest profit taking. Core bond yields lost a few basis points, but interest rate differentials between the US and Germany/Europe were little changed. USD/JPY remained under pressure as investors preferred safe havens. The pair filled bids around 109.28 at the start of US dealings. Dollar weakness initially pushed EUR/USD within reach of the recent top, but no break occurred. On the contrary, EUR/JPY selling and investors adapting euro long positions ahead of the ECB meeting, finally pushed EUR/USD back south to the 1.1250 area.
Trading dynamics didn't change during the US trading session. USD/JPY (109.35) remains in the defensive. EUR/USD hovers in the mid 1.1260 area. Waiting for Thursday remains the name of the game. Or will Trump surprise markets with a high profile policy initiative?
EUR/GBP holds within reach of recent top
There was also no clear story to guide sterling trading. The UK currency regained slightly further ground against the euro, but this move also mirrored a temporary setback in EUR/USD at that time. EUR/GBP dropped to the 0.87 area but soon found a bottom. There was no change in the election story. The Conservative Party maintains a (reduced) lead. Later in the session, some modest sterling pressure resurfaced. However, the moves were limited and technically insignificant. EUR/GBP is changing hands in the 0.8735 area. Cable hovers just sought of 1.29, awaiting the things to come in the UK, but also in the US.
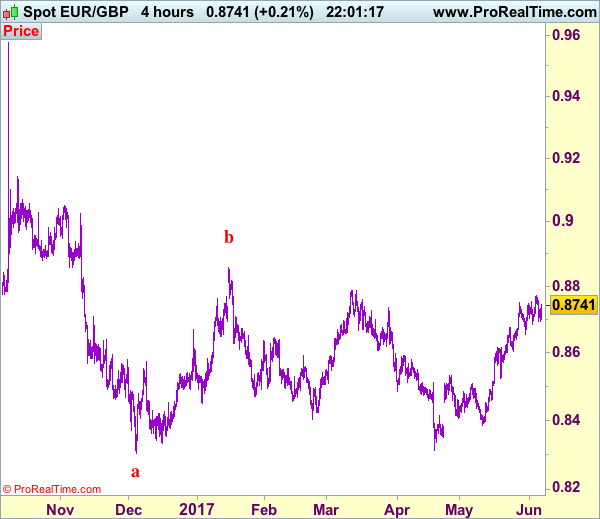
Trade Idea: EUR/GBP – Hold short entered at 0.8735
EUR/GBP - 0.8742
Recent wave: Major double three (A)-(B)-(C)-(X)-(A)-(B)-(C) is unfolding and 2nd (A) has possibly ended at 0.6936.
Trend: Near term up
Original strategy :
Sold at 0.8735, Target: 0.8610, Stop: 0.8775
Position : - Short at 0.8735
Target : - 0.8610
Stop : - 0.8775
New strategy :
Hold short entered at 0.8735, Target: 0.8610, Stop: 0.8775
Position : - Short at 0.8735
Target : - 0.8610
Stop : - 0.8775
Although euro has rebounded after finding support at 0.8692, as long as resistance at 0.8771 holds, consolidation with mild downside bias remains for another retreat, below 0.8680-85 would suggest top is possibly formed there, then test of indicated support at 0.8655 would follow, however, break of latter level is needed to add credence to this view, bring retracement of recent rise to 0.8600-10 later.
In view of this, we are holding on to our short position entered at 0.8735. Above 0.8771 would extend recent rise from 0.8312 low to previous resistance at 0.8788, however, reckon upside would be limited to 0.8800-10 due to weakening of upward momentum.
Our preferred count is that, after forming a major top at 0.9805 (wave V), (A)-(B)-(C) correction is unfolding with (A) leg ended at 0.8400 (A: 0.8637, B: 0.9491 and 5-waver C ended at 0.8400. Wave (B) has ended at 0.9413 and impulsive wave (C) has either ended at 0.8067 or may extend one more fall to 0.8000 before prospect of another rally. Current breach of indicated resistance at 0.9043 confirms our view that the (C) leg has ended and bring stronger rebound towards 0.9150/54, then towards 0.9240/50.
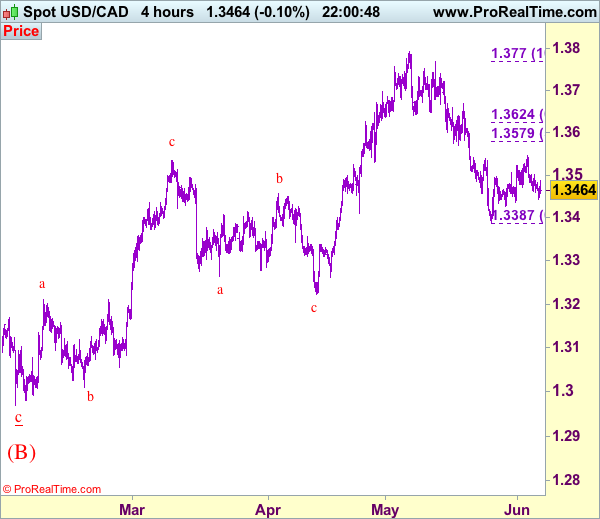
Trade Idea: USD/CAD – Sell at 1.3580
USD/CAD - 1.3469
Recent wave: Only wave v of c has ended at 0.9407 and wave C of major A-B-C correction is underway for headway to 1.4700
Trend: Near term up
Original strategy :
Sell at 1.3580, Target: 1.3380, Stop: 1.3640
Position: -
Target: -
Stop: -
New strategy :
Sell at 1.3580, Target: 1.3380, Stop: 1.3640
Position: -
Target: -
Stop:-
Although the greenback retreated from last week’s high of 1.3547, reckon downside would be limited to 1.3435-45 and upside risk remains for another rebound to 1.3550 but 1.3575-80 (50% Fibonacci retracement of 1.3770-1.3387) should limit upside and bring another decline, below 1.3435-40 would signal the rebound from 1.3387 has ended, bring retest of this level first. A drop below this support at 1.3387 would extend the fall from 1.3794 top for further weakness to 1.3350, then towards 1.3300 but loss of near term downward momentum should prevent sharp fall below 1.3250-60.
In view of this, would be prudent to sell on further subsequent recovery as 1.3571-79 (previous support and 50% Fibonacci retracement of 1.3770-1.3387) should limit upside and bring another decline. Above 1.3620-25 (61.8% Fibonacci retracement) would defer and suggest a temporary low is formed instead, risk a stronger rebound towards resistance at 1.3670.
To recap, wave B from 1.3066 is unfolding as an a-b-c and is sub-divided as a: 1.2192, b: 1.2716 and wave c is a 5-waver with i: 1.1983, ii: 1.2506, extended wave iii with minor iii at 1.0206, wave iv ended at 1.0781 and wave v as well as wave iii has ended at 0.9931, hence the subsequent choppy trading is the wave iv which is unfolding as (a)-(b)-(c) with (a) leg of iv ended at 1.0854, followed by (b) leg at 1.0108 and (c) leg as well as the wave iv ended at 1.0674. The wave v is sub-divided by minor wave (i): 0.9980, (ii): 1.0374, (iii): 0.9446, (iv): 0.9913 and (v) as well as v has possibly ended at 0.9407, therefore, consolidation with upside bias is seen for major correction, indicated target at 1.3700 and 1.4000 had been met and further gain to 1.4700 would be seen later.
CAC Dips on Soft Eurozone Retail Data
The French stock market continues to lose ground this week, as the CAC index has dropped 0.74 percent in the Tuesday session. Currently, the CAC is trading at 5,268.80 points. On the release front, there are no major eurozone events. Two retail sales indicators weakened, raising concerns about the strength of consumer spending. Retail PMI dipped to 52.0, down from 52.7 points. As well, Retail Sales dropped to 0.1%, down from the previous reading of 0.3%. This was short of the estimate of 0.2%. On a positive note, Eurozone Sentix Investor Confidence improved for a fourth straight month. The indicator climbed to 28.4 points in June, above the estimate of 27.6 points.
French stock markets have been drifting over the last few weeks, but that could change, as French voters go to the polls on June 11. In two rounds of voting, the French electorate will choose the 577 members of the National Assembly. French President Emmanuel Macron's LREM party is on track to win the first round, with the latest polls giving Macron's party 30 percent of the vote, well ahead of the conservative Republicans, who are well behind at 22 percent. Polls also show the LREM forming a majority in parliament. This would enable Macron to implement his pro-business agenda, so the French stock market could react to a Macron majority with strong gains.
The ECB is expected to hold course with its monetary policy, when policymakers meet on Thursday and set the new benchmark rate. The central bank has maintained the rate at a flat 0.0% since March 2016, and no change is expected at the upcoming meeting. At the same time, euro-area growth was respectable in the first quarter, and the markets would like the ECB to acknowledge the improvement in its rate statement or at ECB President Mario Draghi's press conference. The ECB has been cautious and is not expected to announce any changes to its asset-purchase program, which winds up in December. Will the ECB send out a hawkish message? Analysts will be poring over the rate statement and Draghi's follow-up comments, and any nuances or hints about a tighter monetary policy could push the French stock market to higher levels.
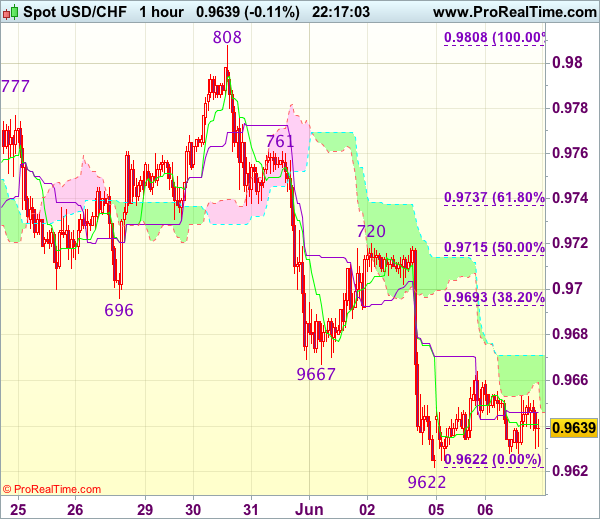
Trade Idea Update: USD/CHF – Sell at 0.9685
USD/CHF - 0.9635
Original strategy :
Sell at 0.9685, Target: 0.9585, Stop: 0.9720
Position : -
Target : -
Stop : -
New strategy :
Sell at 0.9685, Target: 0.9585, Stop: 0.9720
Position : -
Target : -
Stop : -
As the greenback has remained under pressure after Friday’s selloff, bearishness remains for recent decline to resume after consolidation, below support at 0.9622 would extend weakness to 0.9600-05 (50% projection of 1.0100-0.9692 measuring from 0.9808) but oversold condition should limit downside to 0.9570 and price should stay above support at 0.9550, risk from there has increased for a rebound to take place later.
In view of this, we are looking to sell dollar on recovery as 0.9685-90 should limit upside. Only break of resistance at 0.9720 would abort and signal a temporary low is formed instead, bring a stronger rebound to 0.9750 and then 0.9770 but price should falter below resistance at 0.9808.