Sample Category Title
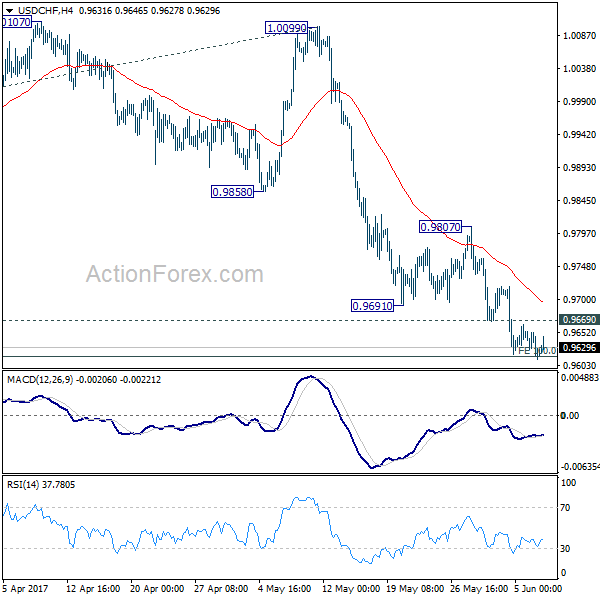
USD/CHF Daily Outlook
Daily Pivots: (S1) 0.9603; (P) 0.9628; (R1) 0.9643; More.....
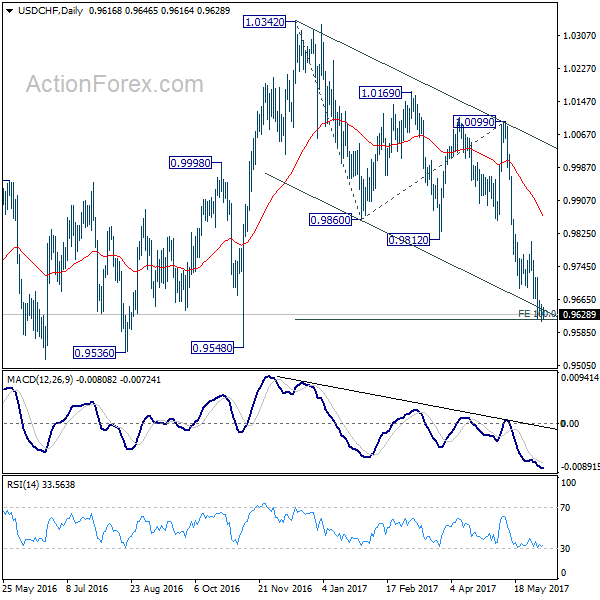
USD/CHF lose some downside momentum as it hits 100% projection of 1.0342 to 0.9860 from 1.0099 at 0.9617. But with 0.9669 minor resistance intact, deeper fall is still expected. We'd start to look for bottoming signal again as it approaches 0.9443 key support level. On the upside, above 0.9669 minor resistance will now indicate short term bottoming. In such in case, intraday bias will be turned back to the upside for 0.9807 resistance and above.
In the bigger picture, USD/CHF is still bounded in medium term range of 0.9443/1.0342 for the moment. Consolidative trading would likely continue and medium term outlook remains neutral. Break of 1.0342 key resistance is needed to confirm underlying bullish momentum in the pair. Meanwhile, downside attempts should be contained by 0.9443 key support level. However, sustained break of 0.9443 will carry larger bearish implication and target 0.9 handle.
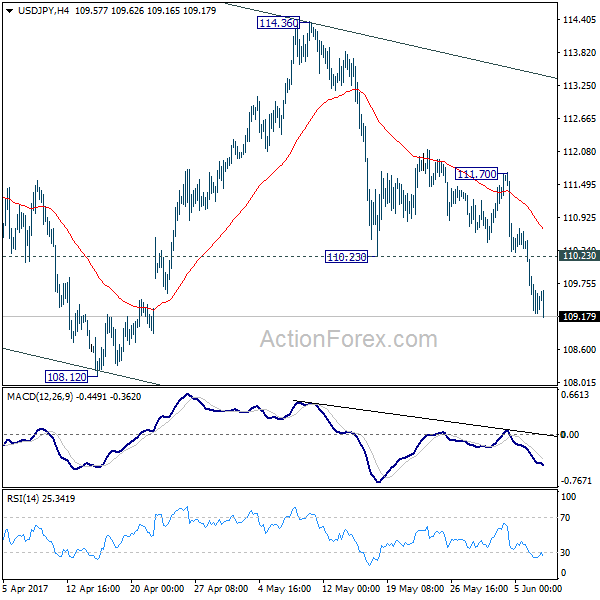
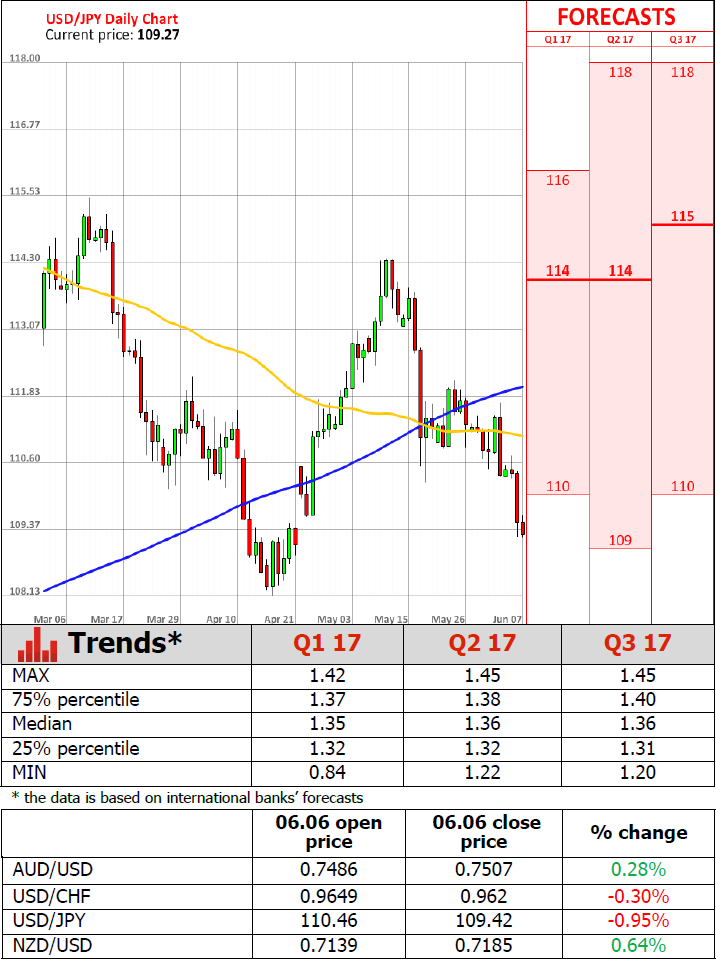
USD/JPY Daily Outlook
Daily Pivots: (S1) 108.91; (P) 109.71; (R1) 110.20; More...
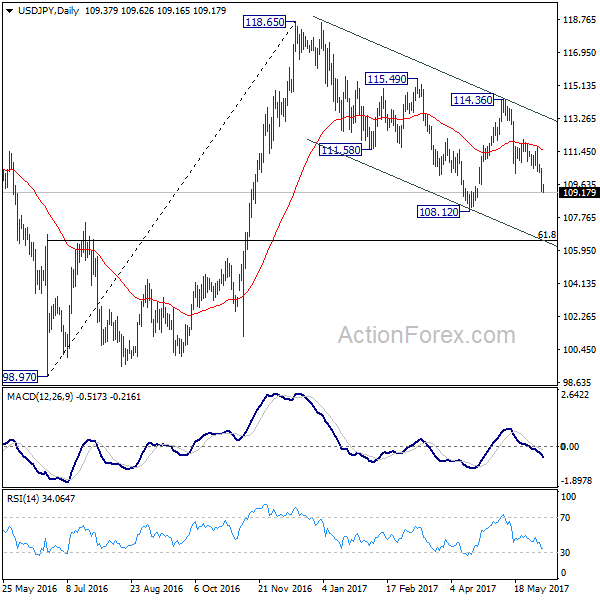
USD/JPY's fall is still in progress intraday bias remains on the downside for retesting 108.12 low first. Also whole decline from 118.65 is seen as a correction and is still in progress. Break of 108.12 will target 61.8% retracement of 98.97 to 118.65 at 106.48. We'll look for bottoming signal around 106.48. On the upside, above 110.23 support turned resistance will turn bias neutral first. But near term outlook will remain bearish as long as 111.70 resistance holds.
In the bigger picture, price actions from 125.85 high are seen as a corrective pattern. It's uncertain whether it's completed yet. But in case of another fall, downside should be contained by 61.8% retracement of 75.56 to 125.85 at 94.77 to bring rebound. Overall, rise from 75.56 is still expected to resume later after the correction from 125.85 completes.
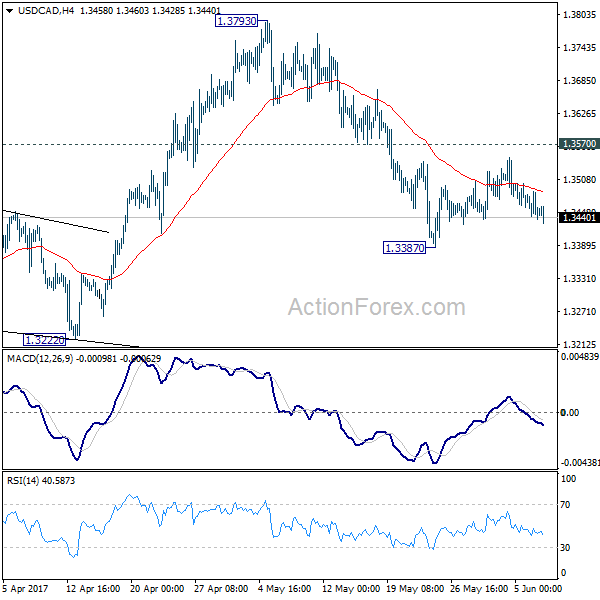
USD/CAD Daily Outlook
Daily Pivots: (S1) 1.3430; (P) 1.3458; (R1) 1.3480; More....
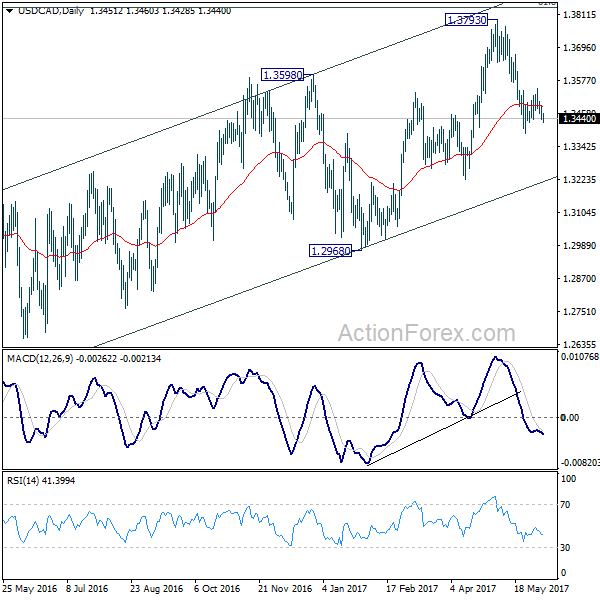
USD/CAD falls mildly again today with weak momentum. As it's staying in range above 1.3387, intraday bias remains neutral at this point. Consolidation from 1.3387 could still extend. But in case of another recovery, upside should be limited by 1.3570 resistance and bring fall resumption. We're holding on to the view that rise from 1.2968 has completed. And the larger rise from 1.2460 could have finished too. Below 1.3387 will target 1.3222 support first. Break of 1.3222 will affirm our bearish view and target 1.2968 key support level for confirmation. However, break of 1.3570 will turn focus back to 1.3793 high instead.
In the bigger picture, price actions from 1.4689 medium term top are seen as a correction pattern. The first leg has completed at 1.2460. Rise from 1.2460 is seen as the second leg and could have completed at 1.3793, ahead of 61.8% retracement of 1.4689 to 1.2460 at 1.3838. Break of 1.3222 should indicate the start of the third leg while further break of 1.2968 should confirm. Nonetheless, sustained trading above 1.3838 would pave the way to retest 1.4689 high.
US Job Openings Hit All-Time High In April
'These data underscore the difficulty in hiring new workers, which we think is increasingly likely to be a factor restraining payroll growth going forward.' — John Ryding, RDQ Economics
Job openings in the United States hit a record high in April and some businesses reported a shortage of qualified workers to fill job openings, pointing to the continued tightening of the labour market. The Job Openings and Labour Turnover Survey, or JOLTS, released by the Labour Department on Tuesday showed that the number of job openings rose 259K to a seasonally adjusted 6.0M in April, a new all-time high, following the preceding month's downwardly revised reading of 5.79M and surpassing analysts' expectations for 5.65M openings, with the largest increase occurring in accommodation and food services. April's increase was the largest in 12 months and pushed the jobs opening rate to 4.0%, the highest since July 2016, up from March's 3.6%. Nevertheless, the number of hires dropped 253K to 5.1M during the reported month, lowering the hiring rate to 3.5%, the lowest in 12 months, from March's 3.6% and pointing to a massive skills gap in the US labour market. The number of layoffs fell 71K to 1.59M, whereas the number of people quitting their jobs declined 111K to 3.03M.
NZD/USD Candlesticks and Ichimoku Analysis
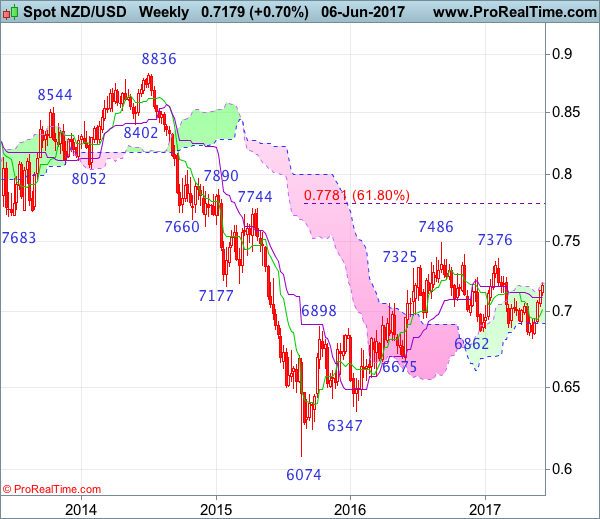
Weekly
• Last Candlesticks pattern: Shooting star
• Time of formation: 5 Sep 2016
• Trend bias: Down
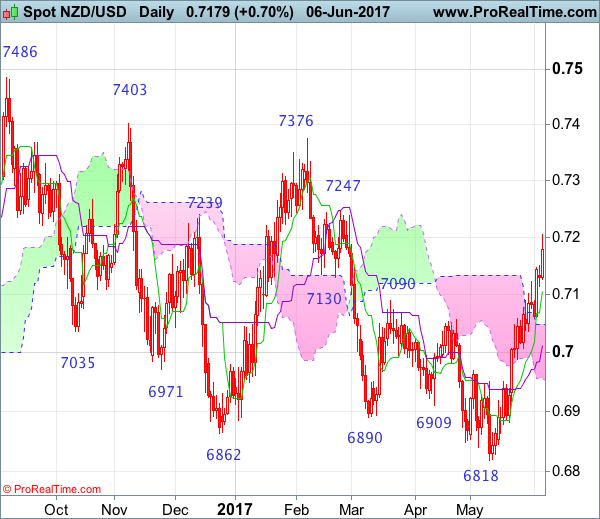
Daily
• Last Candlesticks pattern: Hammer
• Time of formation: 14 Mar 2017
• Trend bias: Near term up
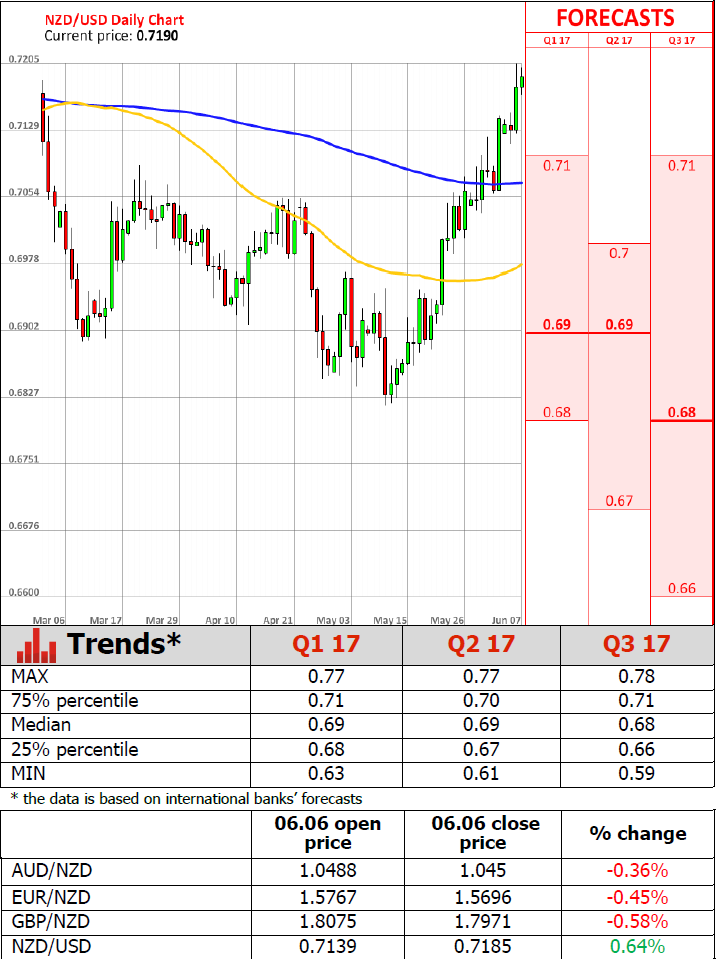
NZD/USD – 0.6974
As kiwi’s rise from 0.6820 (last month’s low) has gathered momentum after breaking resistance at 0.7090, adding credence to our view that low has been formed at 0.6820, hence consolidation with upside bias remains for this rebound to extend further gain to 0.7243-47 resistance but a daily close above this level is needed to provide confirmation and signal erratic decline from 0.7486 top has ended, bring subsequent rise to 0.7300-10 but price should falter below another previous resistance at 0.7376 due to near term overbought condition.
On the downside, whilst initial pullback to the Tenkan-Sen (now at 0.7106) cannot be ruled out, reckon downside would be limited to the upper Kumo (now at 0.7048) and bring another rise later to aforesaid upside targets. Only a daily close below the Kijun-Sen (now at 0.7012) would abort and suggest top is formed instead, risk weakness to 0.6988 and possibly towards the lower Kumo (now at 0.6952) but downside should be limited to 0.6900 and support at 0.6881 should remain intact.
Recommendation: Buy at 0.7100 for 0.7300 with stop below 0.7000.
On the weekly chart, kiwi has rallied for the past 4 consecutive weeks after finding decent demand at 0.6818 last month, suggesting low has indeed been formed there and consolidation with upside bias is seen for gain to 0.7245-50, then 0.7300, however, break of previous resistance at 0.7376 is needed to retain bullishness and signal the erratic decline from 0.7486 top has ended earlier, bring subsequent headway to 0.7400-10 but price should falter below said recent high, bring retreat later.
On the downside, although pullback to 0.7100-05 is likely, reckon last week’s low at 0.7035 would limit downside and bring another rise later. A weekly close below the Kijun-Sen (now at 0.7097) is needed to suggest top is possibly formed, risk test of the Tenkan-Sen (now at 0.7012) but downside should be limited to 0.6950 and bring another rebound later. Below 0.6915-20 would defer and suggest the rebound from 0.6820 has possibly ended instead, risk further fall to 0.6880 first. but said recent low at 0.6820 should hold on first testing.
Dairy Product Prices Rise 0.6% At Latest GDT Auction
'Milk output from New Zealand is expected to lift this season and Fonterra has already made a small upwards revision in the volume of whole milk powder expected to be sold on GDT next season.' — Susan Kilsby, AgriHQ
Dairy product prices rose for the sixth consecutive time at the latest Global Dairy Trade auction on Tuesday. The GDT Price Index climbed 0.6% from the prior auction that took place three weeks ago, with an average selling price of $3,395 per tonne. During the Tuesday auction, 22,0004 tonnes of dairy products were sold, compared to 21,236 tonnes sold at the preceding auction. Nevertheless, the price of whole milk powder dropped 2.9% to $3,143 per tonne. The price of cheddar surged 14.5%, the second highest lift since the commodity started trading on the GDT auction in July 2011, to $4,285 per tonne, whereas prices of skim milk powder jumped 7.9% to $2,156 per tonne. Meanwhile, the price of butter milk powder rose 5.8% to $2,092 per tonne, while prices of rennet casein climbed 4.8% to $6,849 per tonne. The price of butter advanced 3.3% to $5,631 per tonne, whereas lactose prices increased just 1.0% to $971 per tonne. Prices of anhydrous milk fat dropped 1.2% to 6,569 per tonne. Following the release, the Australian Dollar rose against its US counterpart to 71.92.
Australian Economy Expands 0.3% In March Quarter
'The weakness in today's data extends beyond the weather, and the slowdown in the domestic economy has occurred at a time when the global economic backdrop has improved.' — Michael Workman, Commonwealth Bank
The Australian economy expanded roughly in line with analysts' forecasts in the March quarter, official figures revealed on Wednesday. The Australian Bureau of Statistics reported that the economy grew 0.3% in the Q2, following the preceding quarter's expansion of 1.1% and slightly topping expectations for a 0.2% growth rate. On an annual basis, Australia's GDP rose 1.1% in the second quarter of this year but remained below the required rate. Household consumption, public consumption and inventories contributed 0.3%, 0.2% and 0.4%, respectively, to GDP growth in the Q2. However, the gains were offset by net exports and dwelling investment. Exports dropped 1.6%, while imports rose 1.7%. Thus, the contribution of exports was negative. The public sector, including both consumption and investment, added 0.1% to economic growth, with public infrastructure posting a 0.1% decline. Nevertheless, the Q2 slowdown was expected by the Reserve of Bank of Australia, which held its policy unchanged at its meeting on Tuesday. However, the Bank expressed optimism over the domestic outlook.
Slumpflation And Uncertainty Push Oil And Gold Higher
Trumpflation becomes Slumpflation as political uncertainty sees oil come to its senses and follow gold higher.
CRUDE OIL
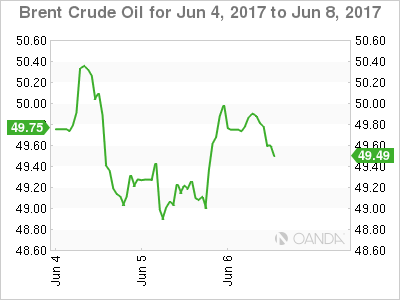
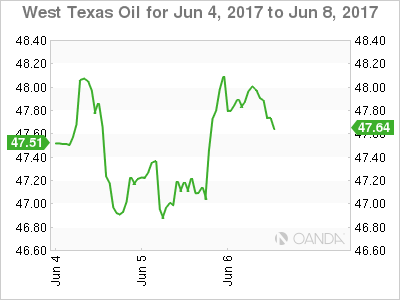
Crude oil prices rose overnight with Brent and WTI finishing some 70 cents higher, offsetting the declines of the previous day. A sagging U.S. Dollar, in general, has played it part, but the primary driver appears to be Qatar’s standoff with the rest of the Arab world. It is now becoming clear that port restrictions on Qatari flagged vessels are going to cause loading disruptions around the region for shipping moving gas and crude.
As mentioned yesterday, the threat of supply disruptions in the Middle East can never be construed as bearish for oil prices, and so it has come to pass. That said, the disruptions are seen as inconvenient rather than systematic and thus will maybe only put a floor on crude in the short term rather than starting a panic rally.
Attention now turns to this evenings U.S. Crude Inventory figures where the street is expecting a 3.5 million barrel draw down to follow last week’s monster 6.4 million barrel draw down. A number at or larger should give cheer to beleaguered oil bulls while a significant undershoot or a positive number will likely see crude coming under sustained short-term pressure again.
Brent spot trades at 49.75 this morning with resistance at 50.60 and then 51.50, the 200-day moving average. Support is delineated now at the 48.70 regions and then 48.00. A break of the latter suggesting a retest of the May lows around 46.30.
WTI spot trades at 47.90 this morning with resistance at 48.25 and then 49.35, the 200-day moving average. Support lies at 46.50 which is a must hold technical level. A break suggesting, like Brent, that more downside pain lies ahead.
GOLD
Gold continued its relentless march higher overnight, rising $17 to test the April high around 1296, before falling slightly to trade at 1292 in the early Asian session. A combination of geopolitical concerns from the Middle East, tomorrows U.K. elections and a wilting U.S. Dollar as the Street loses faith rapidly in the Trumpflation agenda, have played into gold’s hands.
Gold now has a double top at the 1296 area which will be initial resistance followed by the psychological 1300 level. A daily close and consolidation above the latter open up a lot of clear air from a technical perspective, with no resistance until the 1340 region. Technical support is at 1279 initially followed by 1270 and then 1260. The distance between the various technical levels giving plenty of room for intra-day volatility.
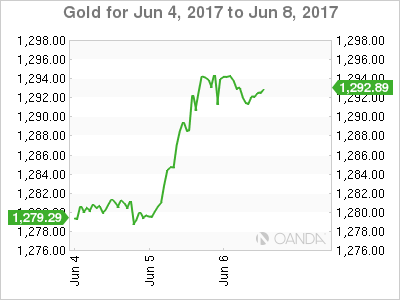
With Trumpflation rapidly becoming Slumpflation, and the degree of uncertainty around as we head into the latter half of the week, there would appear to be no reason for gold’s march higher to peter out. Therefore any dips should be well supported in Asia with a test of the highs possibly on the cards sooner rather than later.
Research UK Travel Notes: A Theresa May Win Would Be GBP Positive
- In this piece, we present the main takeaways from our recent trip to London.
- All we met expect PM Theresa May to win the UK election despite polls narrowing. How UKIP voters vote in Brexit constituencies may be decisive for the outcome.
- Still, the Conservatives may regard the election result as a disappointment, making Theresa May less powerful and vulnerable to hardline Brexiters.
- There is a consensus that a Conservative victory would be positive for GBP in the short term. A hung parliament is the most negative scenario.
- We seem to be alone in the view that a governable coalition between Labour, LibDems and SNP would be positive for GBP on 3-12M due to the softer Brexit among the three partiers (expected range 0.75-0.80).
- The most difficult part of the Brexit negotiation is the beginning (not least the settlement of the 'divorce bill'). Most expect a free trade agreement covering goods but not services to be concluded in three to five years.
- The Bank of England is sidelined despite higher inflation due to slower growth and Brexit uncertainties.
Theresa May still set to win – we expect GBP to rally afterwards
Despite the polls having narrowed, PM Theresa May is still expected by most to win the UK election and get a bigger majority than at present but smaller than expected at the beginning of the negotiations. Even if Theresa May regains power, the election may be considered a disappointment by the Conservatives if she wins by less than 80 seats, making it more likely that Conservative backbenchers will make things more complicated for her in the new election term. One bank argued that one should not over-interpret the movements in the opinion polls, as previous UKIP voters are key for the outcome of the election. If UKIP voters opt for the Conservatives in currently Labour-held constituencies, which voted for Brexit in the EU referendum, the mandates may shift to the Conservatives, implying that they may still win a solid majority. Whether the size of the majority will be large enough for Theresa May to avoid being vulnerable to hardline Brexiters is hard to predict, as it depends on the Brexit stance on new members of parliaments. Most expect GBP and UK assets to (relief) rally in case of a Conservative victory, regardless of the size of the victory, as it would remove one source of uncertainty. How big a rally depends on the size of the majority.
A 'hung parliament' (i.e. no party wins absolute majority in the House of Commons) is seen as the most negative scenario, as it would increase the political uncertainty significantly in a situation where it is high to begin with. This would be GBP negative.
We seem to be alone in our view that a governable coalition between Labour, LibDems and SNP would be positive for GBP on 3-12M due to the softer Brexit stance among the three parties. One bank argued that markets will instead focus (among other things) on UK public finances, as Jeremy Corbyn has some expensive promises in his manifesto.
Brexit negotiations set to be difficult
A base case scenario for Brexit has been formed, assuming Theresa May regains power in the UK. Regardless of the size of Theresa May's majority, we are heading for a hard Brexit, with the UK leaving both the single market and the customs union. However, her flexibility depends on the election outcome. A slim majority will make Theresa May vulnerable to hardline Brexiters, increasing the risk of a 'no deal' Brexit, while a bigger majority makes a smooth Brexit more likely (what we have labelled a 'decent Brexit' ourselves). Experts expect the most difficult part of the negotiations to be in the early stage, as the UK wants to negotiate withdrawal terms and future relationship simultaneously while the EU wants a phased approach by settling the withdrawal terms first (not least the so-called 'divorce bill') before moving on to discussing a free trade agreement. While it is difficult for the UK Prime Minister to sign a divorce bill in the range of EUR60-100bn without knowing the future relationship, a compromise could be to agree on the calculation principles before doing the actual calculations at the very end of the discussions. No one expects a possible free trade agreement to be concluded within two years, so we are likely to have a transitional period, where the discussions can continue. The free trade agreement is likely to cover goods but not services, which will hurt the service-oriented UK economy in the long term. One concern is that the UK does not have the necessary staff either to negotiate Brexit or afterwards when the UK takes over bureaucratic responsibility for itself from the EU.
Growth to remain weak short term – Bank of England sidelined during Brexit negotiations
Looking at the economy, we are pretty much in line with the consensus view. Most expect UK growth to continue slightly below trend growth of 0.4% in the short term (no recession although unemployment may begin to tick up slightly). The main reason is the real pay squeeze, which slows private consumption growth and business investments are unlikely to take over due to Brexit uncertainties. Also, we are yet to see a positive impact on net exports as the import content of exports is high, i.e. the weaker GBP increases import prices thus offsetting the positive impact on export prices. Inflation is expected to peak around 3% later this year but consensus is that the Bank of England will see through this due to concerns about economic activity and Brexit uncertainties. Like us, most expect the first hike from Bank of England at the earliest in mid-2019 after the withdrawal negotiations are concluded. A game changer could be if wage growth accelerates and responds to higher actual inflation at some point but this is considered unlikely.
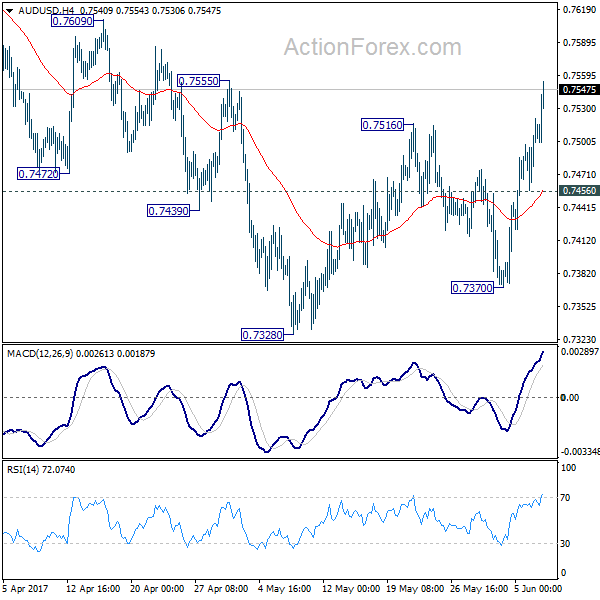
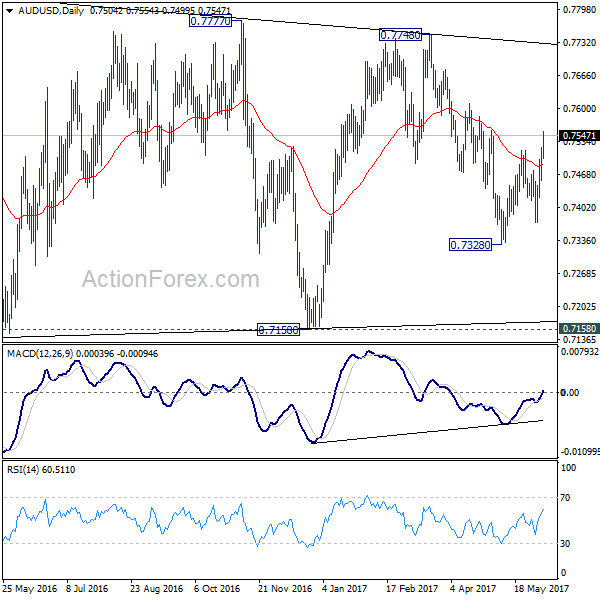
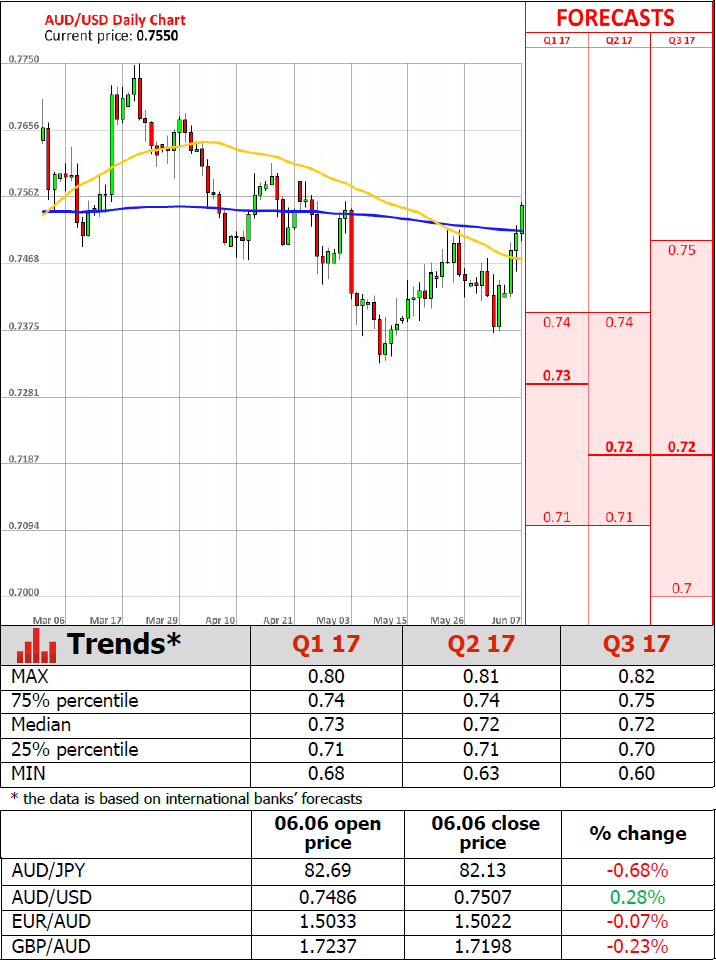
AUD/USD Daily Outlook
Daily Pivots: (S1) 0.7468; (P) 0.7495; (R1) 0.7533; More...
AUD/USD's strong rally and break of 0.7516 resistance indicates that the decline from 0.7748 is already completed at 0.7328. Intraday bias is back on the upside for 0.7748 and possibly above. But then, we'll be cautious on topping again as it approaches medium term fibonacci level at 0.7849. On the downside, below 0.7456 minor support will turn bias back to the downside for 0.7328 short term bottom.
In the bigger picture, we're still treating price actions from 0.6826 low as a corrective pattern. And, as long as 38.2% retracement of 0.9504 to 0.6826 at 0.7849 holds, long term down trend from 1.1079 is expected to resume sooner or later. Break of 0.6826 low will target 0.6008 key support level. However, firm break of 0.7849 will indicate that rise from 0.6826 is developing into a medium term rebound, rather than a sideway pattern. In such case, stronger rise should be seen to 55 month EMA (now at 0.8091) and above.