Sample Category Title
Trade Idea: EUR/JPY – Buy at 124.10
EUR/JPY - 124.79
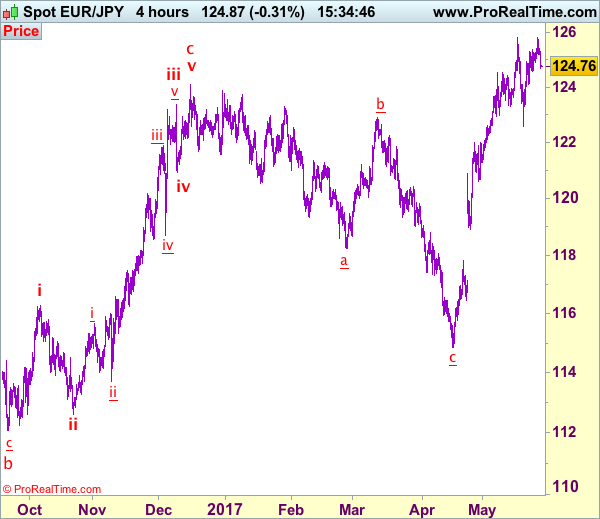
Recent wave: wave v of (C) ended at 94.12 and major correction in wave A has ended at 149.79
Trend: Near term up
Original strategy:
Buy at 124.60, Target: 126.50, Stop: 124.00
Position: -
Target: -
Stop: -
New strategy :
Buy at 124.10, Target: 126.10, Stop: 123.50
Position: -
Target: -
Stop:-
As the single currency has retreated after faltering below resistance at 125.82, retaining our view that consolidation below this level would be seen and correction to 124.50 cannot be ruled out, however, reckon support at 124.10 would limit downside and bring rebound later, above 125.45-50 would bring retest of 125.82 but break there is needed to confirm recent upmove has resumed and extend further gain to 126.20-30 and possibly 126.60-70 but reckon 127.00-10 would hold from here.
In view of this, we are inclined to buy euro on further corrective fall. Below 123.60-65 would suggest top has been formed and risk weakness to 123.30-35 and possibly towards 123.00, however, outlook remains consolidative and previous support at 122.56 should remain intact, bring another rebound later.
Our latest preferred count is that wave (ii) is ABC-X-ABC which ended at 123.33 and wave (iii) is unfolding with wave iii ended at 100.77, followed by wave iv at 111.57 and wave v as well as the wave (iii) has ended at 97.04, followed by wave (iv) at 111.43 and wave (v) has ended at 94.12 which is also the end of the larger degree v, this also implied the major wave (C) has also ended there, hence major correction has commenced from there with (A) leg unfolding in its lower degree wave c which has possibly ended at 145.69. Under this count, A-B-C wave (B) has commenced with A leg ended at 136.23, wave B at 143.79 and wave C has possibly ended at 149.79.
Our larger degree count is that the decline from 139.26 is wave (C) and is sub-divided into a diagonal triangle i-ii-iii-iv-v with wave i - 105.44, wave ii- 123.33, wave iii - 97.03, wave iv - 111.43, followed by the final wave v as well as the end of wave (C) at 94.12, this also mark the bottom of larger degree wave B. Under this count, major rise in wave C has commenced as an impulsive wave with minor wave III ended at 145.69, wave V is still in progress for further gain to 150.00. Having said that, this so-called wave V could well be the first leg of larger degree 5-waver wave C and this wave C should bring at least a retest of wave A top at 169.97 (July 2008).
Trade Idea: AUD/USD – Buy at 0.7405
AUD/USD – 0.7432
Recent wave: Wave 5 ended at 1.1081 and major correction has commenced for fall to 0.7000 and then towards 0.6500-10
Trend: Near term down
Original strategy :
Buy at 0.7405, Target: 0.7570, Stop: 0.7345
Position: -
Target: -
Stop: -
New strategy :
Buy at 0.7405, Target: 0.7570, Stop: 0.7345
Position: -
Target: -
Stop:-
Although aussie has retreated after faltering below indicated resistance at 0.7518 and near term downside risk remains for weakness to 0.7415-20, if our view that low has been formed at 0.7329 is correct, downside should be limited to 0.7400-05 and bring another rebound later, above 0.7480 would bring test of said resistance at 0.7518, break there would extend the rise from 0.7329 low to resistance at 0.7556, having said that, a break above there is needed to provide confirmation, bring subsequent rise towards 0.7595-00.
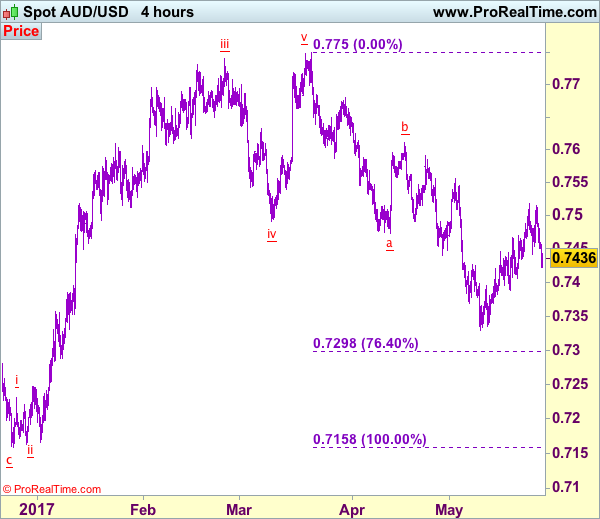
In view of this, we are looking to buy aussie on dips as 0.7400-05 should limit downside and bring another rise. A break of support at 0.7388 would abort and signal top is formed, bring further fall to 0.7360 but said recent low at 0.7329 should remain intact. Only a drop below this support at 0.7329 would abort and signal recent decline has resumed and extend weakness to 0.7295-00 (76.4% retracement of 0.7158-0.7750).
On the 4-hour chart, the move from 0.8066 is the wave 5 with i: 0.8860, ii: 0.8315, wave iii is an extended move ended at 1.0183, iv: 0.9706 and wave v has ended at 1.1081 (also the top of entire wave 5). The subsequent selloff is the major correction which is unfolding as ABC-X-ABC and 2nd A leg has ended at 0.8848, followed by a-b-c wave B which ended at 0.9758, hence, 2nd C wave is now in progress and indicated downside target at 0.7000 and 0.6950 had been met, so further fall to 0.6710-20 cannot be ruled out.
Technical Outlook: EURUSD Remains In Range Trading, US GDP Data In Focus
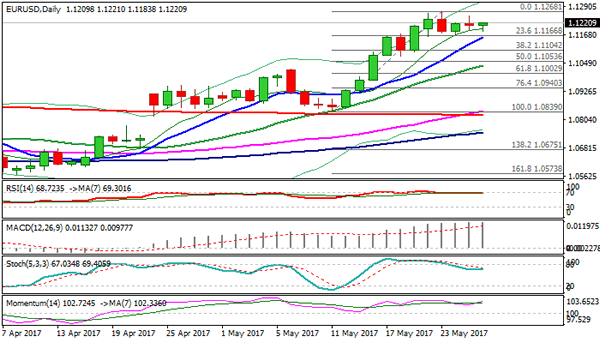
EURUSD extends consolidation within 1.1166/1.1268 range for the fifth consecutive day after broader bulls stalled at 1.1268 (2017 high) and downside attempts were so far contained by Fibo 23.6% of 1.0839/1.1268 upleg at 1.1166, reinforced by the top of thick 4-hr cloud / 10SMA.
Bullish technicals suggest further upside towards next target at 1.1313 (Fibo 76.4% of 1.1614/1.0340) but bulls may be dented by extended daily studies (RSI is attempting to reverse from overbought territory).
Stronger bearish signal could be expected on break below 1.1166 pivot that would trigger further weakness towards 1.1121 (daily Tenkan-sen) and 1.1104 (Fibo 38.2% of 1.0839/1.1268) and confirm correction on break.
US GDP data, due later today, are eyed for stronger direction signals.
Res: 1.1250, 1.1268, 1.1299, 1.1313
Sup: 1.1183, 1.1166, 1.1121, 1.1104
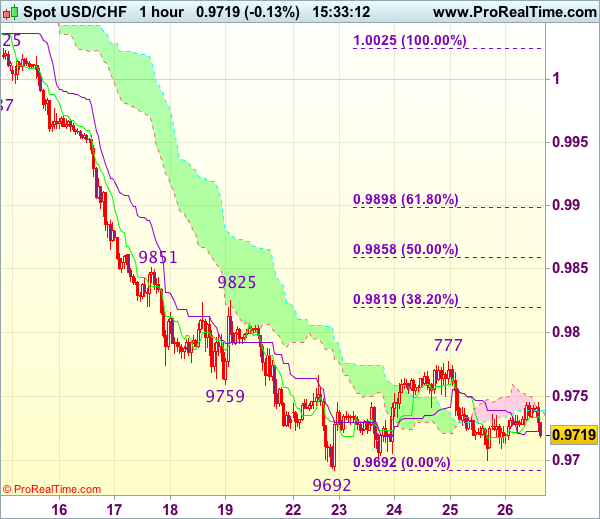
Trade Idea : USD/CHF – Hold long entered at 0.9700
USD/CHF - 0.9715
Most recent candlesticks pattern : N/A
Trend : Near term down
Tenkan-Sen level : 0.9728
Kijun-Sen level : 0.9723
Ichimoku cloud top : 0.9739
Ichimoku cloud bottom : 0.9738
Original strategy :
Bought at 0.9700, Target: 0.9800, Stop: 0.9700
Position : - Long at 0.9700
Target : - 0.9800
Stop : - 0.9700
New strategy :
Hold long entered at 0.9700, Target: 0.9800, Stop: 0.9700
Position : - Long at 0.9700
Target : - 0.9800
Stop : - 0.9700
The greenback met resistance at 0.9777 and has retreated, suggesting caution on our long position entered at 0.9700 but as long as support at 0.9692 holds, further consolidation would be seen with mild upside bias for another rebound, above said resistance at 0.9777 would add credence to our view that temporary low is formed, bring retracement of recent decline to 0.9800, then 0.9819-25 (38.2% Fibonacci retracement of 1.0025-0.9692 and previous resistance) but price should falter below resistance at 0.9851 (also just below 50% Fibonacci retracement at 0.9858), bring another decline later.
In view of this, we are holding on to our long position entered at 0.9700. Below said support at 0.9692 would signal recent decline has resumed and extend weakness to 0.9670-75 but reckon downside would be limited to 0.9650 and 0.9620-25 should hold, bring another rebound later.
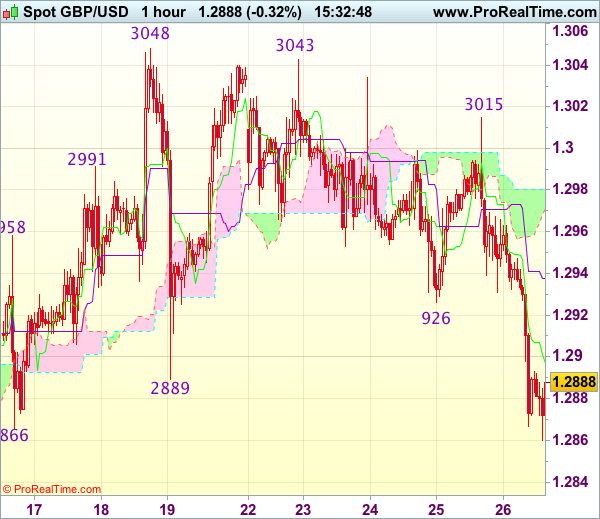
Trade Idea : GBP/USD – Hold long entered at 1.2960
GBP/USD - 1.2883
Most recent candlesticks pattern : N/A
Trend : Near term up
Tenkan-Sen level : 1.2897
Kijun-Sen level : 1.2938
Ichimoku cloud top : 1.2989
Ichimoku cloud bottom : 1.2971
Original strategy :
Bought at 1.2960, stopped at 1.2925
Position : - Long at 1.2960
Target : -
Stop : - 1.2925
New strategy :
Stand aside
Position : -
Target : -
Stop : -
Sterling ran into heavy selling pressure at 1.3015 yesterday and has dropped sharply, price just broke below 1.2866 support earlier today, suggesting top has indeed been formed at 1.3048 earlier and downside bias is seen for this the erratic decline from there to extend weakness to previous support at 1.2844, then 1.2831, however, near term oversold condition should prevent sharp fall below 1.2800 and reckon 1.2770-75 would hold from here.
In view of this, would not chase this fall here and would be prudent to stand aside for now. Above previous support at 1.2926 (now resistance) would defer and suggest an intra-day low is formed instead, bring a stronger rebound to 1.2950 but upside should be limited to 1.2990-00.
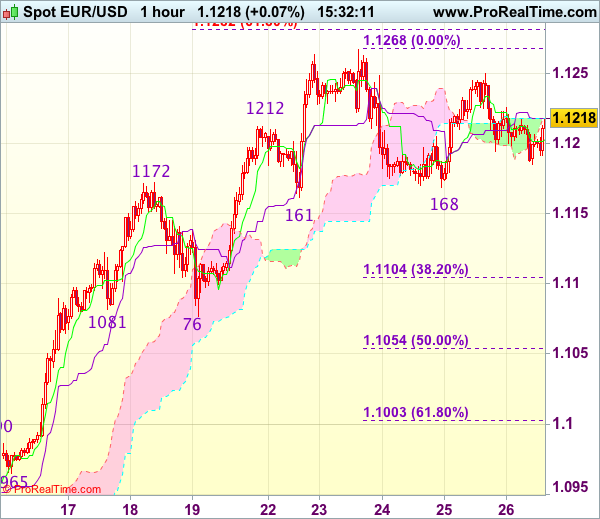
Trade Idea : EUR/USD – Stand aside
EUR/USD - 1.1220
Most recent candlesticks pattern : N/A
Trend : Up
Tenkan-Sen level : 1.1203
Kijun-Sen level : 1.1218
Ichimoku cloud top : 1.1218
Ichimoku cloud bottom : 1.1217
New strategy :
Stand aside
Position : -
Target : -
Stop : -
Although the single currency retreated after meeting resistance at 1.1250 yesterday, as euro found support at 1.1185 and has rebounded, suggesting consolidation with mild upside bias would be seen today, however, a break of said resistance is needed to retain bullishness and signal pullback from 1.1268 has ended, bring retest of this level, once this resistance is penetrated, this would signal recent upmove has resumed and extend gain to 1.1280-85 (61.8% projection of 1.0839-1.1172 measuring from 1.1076) and possibly towards 1.1300-10.
On the downside, below 1.1185 would bring another corrective fall to 1.1161-68 support but break there is needed to signal top has been formed at 1.1268, bring retracement of recent upmove to 1.1130 but reckon downside would be limited to 1.1100-05 (38.2% Fibonacci retracement of 1.0839-1.1268) and price should stay well above support at 1.1076, bring rebound later.
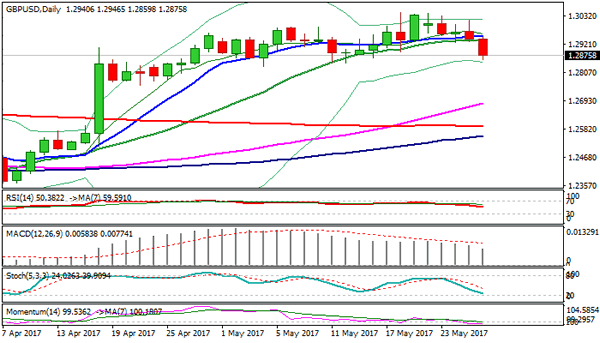
Technical Outlook: GBPUSD Slides Further After Weak GDP / Pre-Election Polls
Bears accelerated in Asia on Friday, following Thursday's close in red after attempts above psychological 1.3000 barrier were capped by falling weekly cloud.
Thursday's red daily candle with long upper shadow signaled rising downside risk, as the pair came under fresh pressure after weaker than expected UK Q1 GDP.
Additional pressure came on release of the latest polls showing narrowing lead of UK Conservative party against Labour party ahead of June 8 elections.
UK PM May party's lead narrowed to 5 points (Tories 43% vs Labour 38%), falling to the lowest after having a comfortable lead of 9 points last week.
The pound remains offered in early Europe, with end of week profit taking expected to put further pressure on the pair.
Technical studies turned bearish on lower timeframes as cable took out initial pivots provided by 10/20 SMA's at 1.2948/32 and acceleration lower also broke below daily Kijun-sen at 1.2901 on daily chart.
Near-term focus turned to key supports at 1.2844/30 (12 / 4 May troughs) break below which would risk extension towards next pivotal support at 1.2786 (Fibo 38.2% of 1.2365/1.3047).
Current pullback is seen as correction of larger uptrend from 1.2108 (14 Mar low) and should be ideally contained at 1.2790 zone, according to wave principles, as the pair is currently riding on the fourth (corrective) wave of five-wave cycle from 1.2108.
Break below 1.2790 pivot would signal stronger correction.
Upside is expected to stay protected by broken 10SMA / daily Tenkan-sen at 1.2950 zone.
Res: 1.2901, 1.2950, 1.2962, 1.3000
Sup: 1.2844, 1.2830, 1.2786, 1.2706
Trade Idea : USD/JPY – Hold long entered at 111.50
USD/JPY - 111.33
Most recent candlesticks pattern : N/A
Trend : Near term down
Tenkan-Sen level : 111.53
Kijun-Sen level : 111.60
Ichimoku cloud top : 111.70
Ichimoku cloud bottom : 111.52
Original strategy :
Bought at 111.50, Target: 112.50, Stop: 111.15
Position : - Long at 111.50
Target : - 112.50
Stop : - 111.15
New strategy :
Hold long entered at 111.50, Target: 112.50, Stop: 111.15
Position : - Long at 111.50
Target : - 112.50
Stop : - 111.15
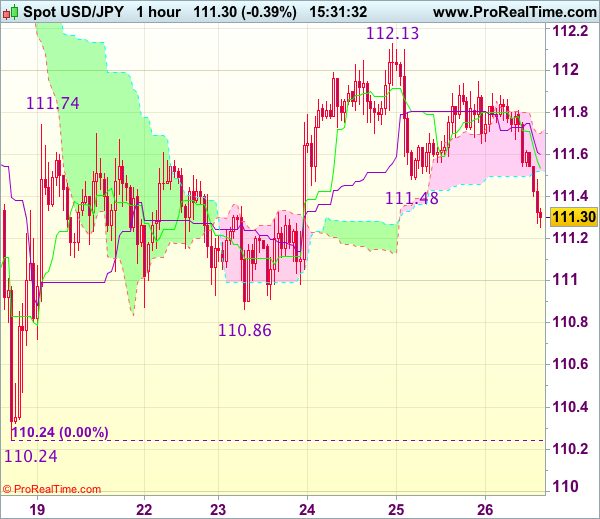
As the greenback has dropped again after faltering below 112.00, suggesting caution on our long position entered at 111.50 and 111.15-20 needs to hold to retain prospect of another rebound to 111.70 but break of 112.00 is needed to signal the pullback from 112.13 has ended, bring test of this level, break there would extend the erratic rise from 110.24 low to 112.36 (100% projection of 110.4-11174 measuring from 110.86) and then 112.45-50 (61.8% Fibonacci retracement).
In view of this, we are holding on to our long position entered at 111.50. Below 111.15-20 would abort and risk weakness to indicated support at 110.86 but only break there would confirm top has been formed and suggest the rise from 110.24 has ended, then further fall to 110.50-55 would follow.
AUD/USD Daily Outlook
Daily Pivots: (S1) 0.7430; (P) 0.7473; (R1) 0.7496; More...
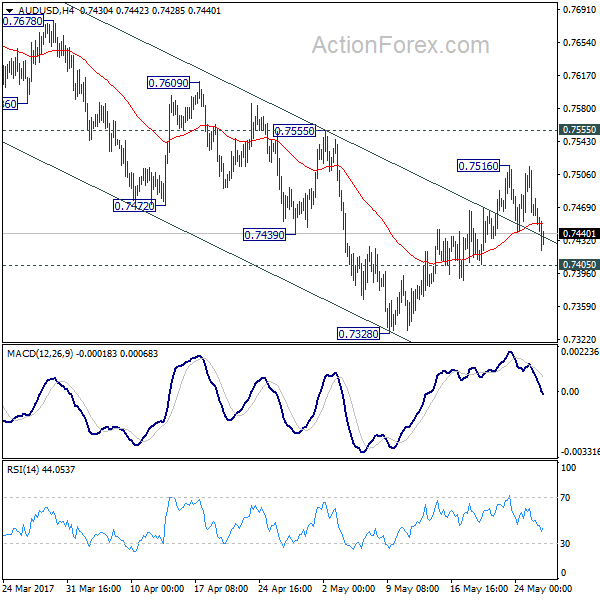
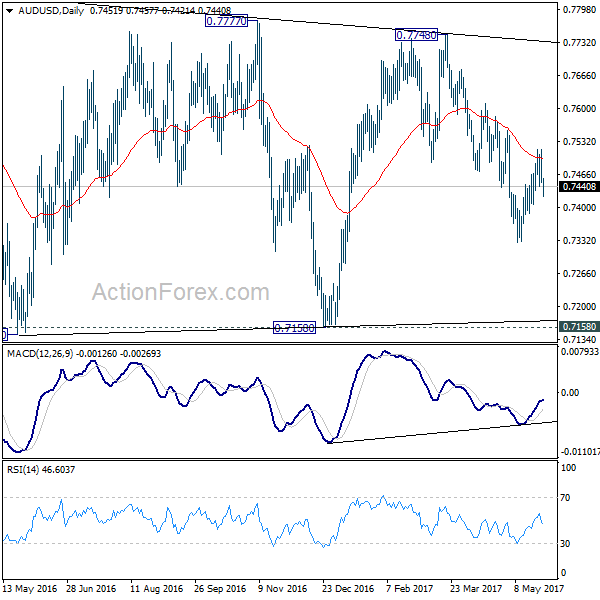
Intraday bias in AUD/USD remains neutral for the moment as it's staying below 0.7516 temporary top. With 0.7555 resistance intact, fall from 0.7748 is still expected to continue. Below 0.7405 minor support will turn bias to the downside for 0.7382. Break there will target 0.7144/7158 support zone. However, firm break of 0.7555 will argue that fall from 0.7748 is completed and turn bias back to the upside.
In the bigger picture, we're still treating price actions from 0.6826 low as a corrective pattern. And, as long as 38.2% retracement of 0.9504 to 0.6826 at 0.7849 holds, long term down trend from 1.1079 is expected to resume sooner or later. Break of 0.6826 low will target 0.6008 key support level. However, firm break of 0.7849 will indicate that rise from 0.6826 is developing into a medium term rebound, rather than a sideway pattern. In such case, stronger rise should be seen to 55 month EMA (now at 0.8115) and above.
Oil Slips On OPEC Meeting. US Q2 GDP Expected To Be Revised Higher
The much anticipated OPEC meeting held in Vienna yesterday saw the OIL cartel announce an extension of the oil production cuts until March 2018 as informally reported earlier. Yet, despite the announcement, crude oil prices fell sharply on the day with the NYMEX Crude oil futures falling 4.8% on the day.
The weaker oil prices also pulled down the price of other commodities including gold which slipped to $1256 an ounce. The US dollar managed to post some modest gains but remains largely flat, trading below the 97.50 handle.
In the UK, the Office for national statistics (ONS) revised down the first quarter GDP growth from the initially reported 0.3% QoQ to only 0.2%. The revised numbers came on account of consumers feeling the pinch with rising inflation and weak wage growth.
Looking ahead, the US Commerce department will be releasing the second revision to the first quarter GDP. Economists are expecting a higher revision to 0.9% from first estimates of 0.9%.
EURUSD intraday analysis
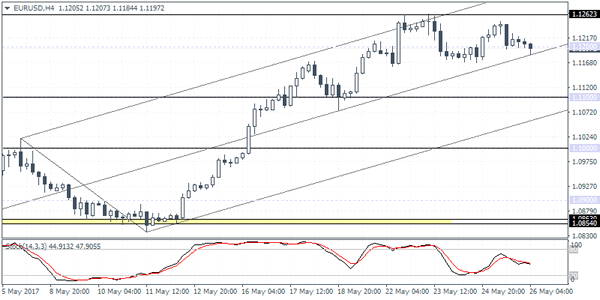
EURUSD (1.1197): The EURUSD attempted another go at testing the previous highs above 1.1200, but price action closed with a doji type candlestick pattern which indicates indecision in the markets.
However, for some meaningful correction to be expected, price action will need to follow through with a bearish close today, preferably below 1.1200. This will indicate a move towards the first support level at 1.1100. On the 4-hour chart, supporting the bearish view is the fact that yesterday's gains resulted in a lower high which suggests that some downside may be in store. The economic data today is relatively quiet as far as data from the eurozone is concerned, which will leave most of the heavy-lifting to the U.S. revised GDP numbers.
GBPUSD intraday analysis
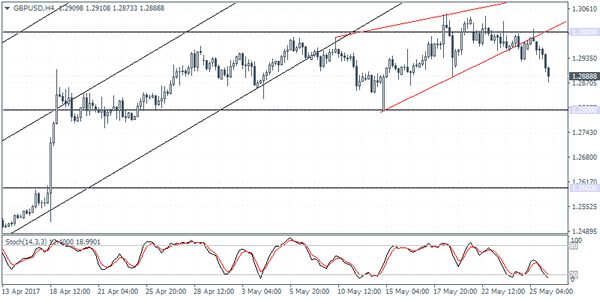
GBPUSD (1.2888): The British pound tested the 1.3000 handle briefly yesterday before closing bearish. The price action currently is indicating further declines in GBPUSD. The bearish momentum came on a weaker than expected GDP numbers for the first quarter.
Support at 1.2800 remains as the key support to the downside which will be the initial target. On the 4-hour chart, the breakout validates the rising wedge pattern which will see price action extend the declines to 1.2800. In the event of a retracement, watch for the resistance level at 1.3000 region which is likely to be tested once again. However, in the near term, GBPUSD is expected to test the support at 1.2800.
EURCAD intraday analysis
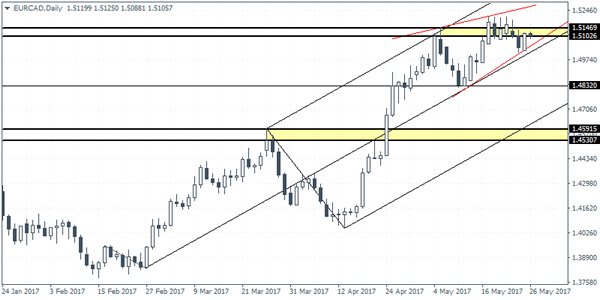
EURCAD (1.5105): The EURCAD was bullish yesterday as the Canadian dollar was hit by the selling in oil prices. The declines came as crude oil prices fell sharply despite the OPEC announcement to cut oil production.
EURCAD posted a bullish close yesterday back at the resistance level of 1.5102 - 1.5147. The re-adjusted rising wedge pattern suggests that in the short term, price action could be seen moving slightly higher towards 1.5147, reaching the top end of the resistance level. Following this minor push, EURCAD could be seen eventually breaking out from the rising wedge pattern. Initial support at 1.4832 will be tested, followed by a test towards 1.4519.