Sample Category Title
Market Update – European Session: Italy Consumer Confidence Hits A 2-Year Low, G7 Meets With Differences On Trade And...
Notes/Observations
Poll suggest that UK June 8th Parliamentary election could be more closely contested than previously thought; Conservative hold 5-point lead over Labour and might foreshadow a messier Brexit
G7 meets in Italy with differences on trade and climate change issues
Overnight:
Asia:
Japan National CPI rose for the 4th straight month and at a 3-month high (Y/Y: 0.4% v 0.4%e); Core CPI hit a 2-year high (Y/Y: 0.3% v 0.4%e)
Moody's commented following recent sovereign downgrade of China: Country might no longer get A1 rating if there were signs that debt kept rising and debt exceeds expectations
Europe:
UK YouGov/Times ElectionPoll: Conservatives 43%(-1) Labour 38%(+3); 5 % ;lead smallest since Apr 2016 (**Note: Taken after Manchester bombing)
EU draft negotiating paper: Brexit negotiators to demand UK agree to pay a fixed percentage of outstanding obligations on the day it leaves the EU
Americas:
Fed's Brainard (dove, voter): Risk balance has shifted due to a brighter global outlook; China's issues pose medium-term downside risk to the global economy
Fed's Williams (moderate, non-voter) reiterated own view that 3 interest rate hikes are appropriate in 2017; Fed to release details of balance sheet plan in coming months
Fed's Bullard (non-voter, dovish): Prices have started to deviate noticeably from 2% inflation path; Lagging price level is worrisome. Fed should start reducing balance sheet to increase policy flexibility.
Energy:
OPEC/non-OPEC ministers agreed to extend production cuts by 9 months at current levels (as speculated). OPEC did considered 6, 9 and 12-month oil reduction scenarios and consideration to deeper production cuts
Economic Data
(TR) Turkey May Economic Confidence: 100.5 v 99.5 prior
(HU) Hungary Apr Unemployment Rate: 4.6% v 4.4%e
(CN) Weekly Shanghai copper inventories (SHFE): 198.6K v 196.4K tons prior
(TW) Taiwan Q1 Final GDP Y/Y: 2.6% v 2.6%e
(IT) Italy May Consumer Confidence Index: 105.4 v 107.3e (lowest reading since Jan 2015); Manufacturing Confidence: 106.9 v 108.0e; Economic Sentiment: 106.2 v 107.4 prior
Fixed Income Issuance:
(IN) India sold total INR150B vs. INR150B indicated in 2024, 2027, 2034 and 2046 bonds
SPEAKERS/FIXED INCOME/FX/COMMODITIES/ERRATUM
Equities
Indices [Stoxx50 -0.7% at 3559, FTSE +0.1% at 7524, DAX -0.4% at 12568, CAC-40 -0.7% at 5298, IBEX-35 -1.0% at 10831, FTSE MIB -1.0% at 21083, SMI -0.2% at 9019, S&P 500 Futures -0.1%]
Market Focal Points/Key Themes European Indices trade mostly lower led by the FTSE MIB and French CAC, with the FTSE100 outperforming having traded new all time highs. Corporate news flow has been relatively quiet, Restaurant Group shares are outperforming up over 10% following a trading update and Spirax-Sparco trades sharply higher after the acquisition of Chromalox for $415M. RBS shares trade lower after the termination of settlement talks over 2008 rights issue, and Petrofac continues to fall following analyst downgrades. Alfa Financial Services saw strong demand after its IPO this morning with shares higher by ~30%. On the US earnings docket, Big Lots expected to report in a quiet day for scheduled corporate news ahead of the long weekend.
Equities
Consumer discretionary [Restaurant Group [RTN.UK] +8.7% (Trading update), Intertek Grp [ITRK.UK] -1.0% (Earnings), Britvic [BVIC.UK] -2.8% (Pepsi sells 11.8M shares at 695p/shr)]
Industrials: [Spirax-Sparco [SPX.UK] +6.7% (Acquisition)
Financials: [RBS [RBS.UK] -1.8% (Termination of settlement talks over 2008 rights issue), Alfa Finl Services [ALFA.UK] +30% (IPO priced at 325p/shr)]
Energy: [Petrofac [PFC.UK] -4.2% (Follow through, analyst downgrade)
Speakers
EU President Tusk opening remarks at G7 in Italy noted that the Summit would be one of the more challenging one in years as leaders had different views on trade and climate. Expected unity to be expressed on Ukraine; nothing showing that sanctions should be lifted against Russia
EU's Juncker: President Trump was not aggressive at all on German trade (refute earlier press reports). (**Note: German press reported that President Trump complained about the Germany's trade surplus, Trump conversation to EU officials about Germans were "bad, very bad" because the country sold more cars to the US than it imported)
IMF's Rice: confident that a deal to ease the Greek debt burden can be reached in the next few months
IMF Mission Statement on Ukraine: Decisive implementation of reforms remains critical for Ukraine to achieve stronger and sustainable growth
Portugal Debt Agency (IGCP): Early repayment of an additional portion of the IMF loan will be made over the next 30 months
China PBoC said to consider changing methodology around daily Yuan mid-point fixing. Said to add "counter-cyclical adjustment factor" that may reduce the impact of market swings. Under new formula, institutions said to provide quotes for the fixing taking into account the previous day's official closing price (occurs at 16:30 local time). No further details of the new formula provided
China's Dagong credit agency: China's downside economic risks are controllable
Currencies
GBP was softer and at 2-month lows after a poll showed a narrowing lead for British PM May over her opposition ahead of elections next month. assumption that a landslide election win for May would strengthen her hand over hard-line Brexiteers in her ruling party and allow her to negotiate a smoother departure from the European Union, had been a source of support for sterling. GBP/USD lower by 0.5% around 1.2870 just ahead of the NY morning. The pair has had much difficulty sustaining moves above 1.30 in prior sessions.
JPY currency was firmer in the aftermath of Japan's Apr CPI data. Overall the data trend did provide some light at the end of the tunnel as core CPI inflation rate accelerated to two-year high but still well below the BOJ target. Some analysts expect higher inflation in Japan in coming months due to a tightening labor market and a recovery in energy prices
Fixed Income
Bund futures trade at 161.59 up 21 ticks, recovering losses from the earlier part of the week to end up slightly higher on the week. Key resistance lies between the 161.70 to 162.00 range, followed by 163.68. A break of 160.01 support level could see lows target 159.01 followed by 157.50.
Gilt futures trade at 128.97 higher by 9 ticks after tentatively breaking the May 18th high of 128.94. Major resistance remains the 129.14 April 18th high. If we see another leg higher, upside may target the 132.80 level. Key support lies at the 128.52 support level. An acceleration lower could test the 127.43 region.
Friday's liquidity report showed Thursday's excess liquidity declined to €1.6255T a drop of €2.5B from €1.6280T prior. Use of the marginal lending facility rose to €204M from €186M prior.
Corporate issuance saw $350M come to market via one issue with American Financial Group Inc's senior unsecured offering This week's issuance is at $36.25B, ahead of the analysts' issuance target to come in around $35B. For the week ending May 24th Lipper US fund flows reported IG funds net inflows $2.1B bringing YTD inflows to $56.98B, High yield funds reported outflows of $0.57B bringing YTD outflows to $6.01B.
Looking Ahead
(IT) G7 Leaders begin 2-day meeting in Taormina, Sicily
(BR) Brazil May CNI Consumer Confidence: No est v 103.4 prior
06:00 (UK) DMO to sell combined £2.0B in 1-month, 3-month and 6-month bills (£0.5B, £0.5B and £1.0B respectively)
06:45 (US) Daily Libor Fixing - 07:00 (BR) Brazil May FGV Construction Costs M/M: +0.1%e v -0.1% prior
07:30 (IN) India Weekly Forex Reserves
08:00 (BR) Brazil Apr PPI Manufacturing M/M: No est v 0.0% prior; Y/Y: No est v 1.7% prior
08:00 (ES) Spain Debt Agency (Tesoro) announces upcoming Bond issuance
08:15 (UK) Baltic Dry Bulk Index
08:30 (US) Q1 Preliminary GDP Annualized Q/Q: 0.9%e v 0.7% advance; Personal Consumption: 0.4%e v 0.3% advance
08:30 (US) Q1 Preliminary GDP Price Index: 2.3%e v 2.3% advance; Core PCE Q/Q: 2.0%e v 2.0% advance
08:30 (US) Apr Preliminary Durable Goods Orders: -1.5%e v +0.9% prior; Durables Ex Transportation: 0.4%e v 0.0% prior; Capital Goods Orders (Non-defense ex aircraft): 0.5%e v 0.5% prior; Capital Goods Shipments (Non-defense/ex-aircraft): 0.5%e v 0.3% prior (revised from 0.3%); Durables Ex-Defense: No est v 0.5% prior
09:00 (MX) Mexico Apr Unemployment Rate (Seasonally adj): 3.5%e v 3.5% prior; Unemployment Rate (unadj): 3.3%e v 3.2% prior
09:30 (BR) Brazil Primary Budget Balance (BRL): +6.7Be v -11.0B prior; Nominal Budget Balance: -26.3Be v -54.3B prior; Net Debt to GDP Ratio: 48.1%e v 47.8% prior
10:00 (US) May Final University of Michigan Confidence: 97.5e v 97.7 prelim
11:00 Potential sovereign ratings
(KR) Kuwait Sovereign Debt to be rated by Moody's
(QA) Qatar Sovereign Debt to be rated by Moody's
13:00 (US) Weekly Baker Hughes Rig Count data
15:00 - (CO) Colombia Central bank Interest Rate Decision: Expected to cut Overnight Lending Rate by 25bps to 6.25%
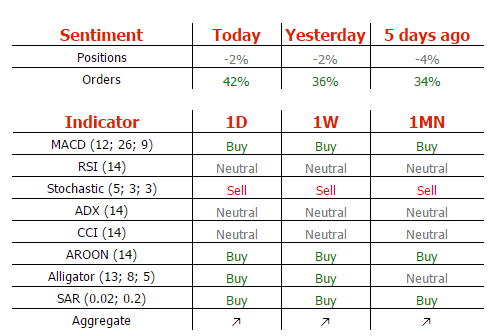
Gold Stalling For The Time At $1263, Silver Monitoring 50% Fibonacci Retracement, Crude Oil Collapsing.
Gold Stalling for the time at $1263.
Gold's retracement seems to end up. Hourly support is located at 1246 (18/05/2017 low). Stronger support is given at 1195 (10/03/2017 low). Expected to show further upside pressures.
In the long-term, the technical structure suggests that there is a growing upside momentum. A break of 1392 (17/03/2014) is necessary ton confirm it, A major support can be found at 1045 (05/02/2010 low).
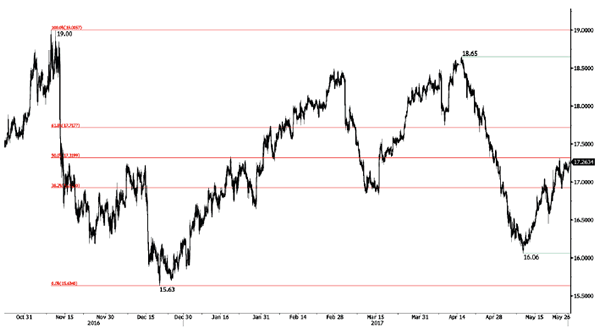
Silver Monitoring 50% Fibonacci retracement.
Silver increases. Strong support is given at 15.63 (20/12/2017 low). Closest support is given at 16.20 (04/05/2017 low). Key resistance is given at a distance at 19.00 (09/11/2017 high). Expected to breakl 50% Fibonacci retracement around 17.30.
In the long-term, the death cross indicates that further downsides are very likely. Resistance is located at 25.11 (28/08/2013 high). Strong support can be found at 11.75 (20/04/2009).
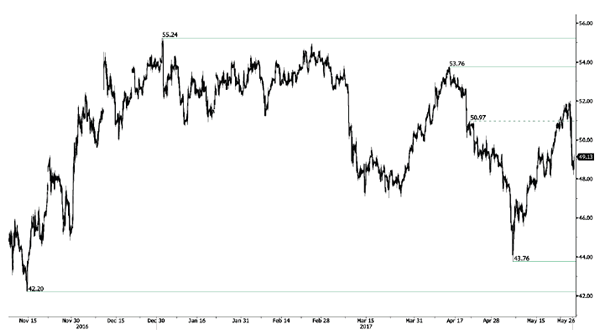
Crude oil Collapsing.
Crude oil has collapsed after the bounce on short-squeeze move. Support is given at a distance 43.76 (05/05/2017 low). Demand was very strong and the road is wide-open for further increase.
In the long-term, crude oil has recovered after its sharp decline last year. However, we consider that further weakness are very likely. Strong support lies at 24.82 (13/11/2002) while resistance can now be found at 55.24 (03/01/2017 high).
EUR/JPY Fading Momentum, EUR/GBP Growing Demand, EUR/CHF Selling Pressures Increase.
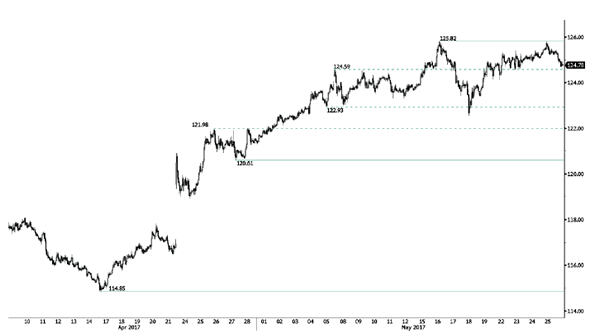
EUR/JPY Fading momentum.
EUR/JPY is trading slightly lower. Hourly support is given at 122.56 (18/05/2017 low). Major support is given at 114.90 (18/04/2017low). Expected to see further renewed buying pressures towards 126.00.
In the longer term, the technical structure validates a medium-term succession of lower highs and lower lows. As a result, the resistance at 149.78 (08/12/2014 high) has likely marked the end of the rise that started in July 2012. Strong support at 94.12 (24/07/2012 low) looks nonetheless far away.
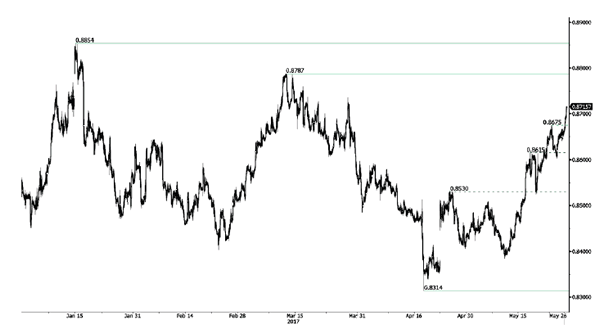
EUR/GBP Growing demand.
EUR/GBP is strengthening. The technical has turned positive since the pair has broken resistance at 0.8530 (25/04/2017 low). Strong support can be found at 0.8304 (05/12/2017 low). Expected to see further continued increase towards resistance at 0.8787 (13/03/2017 high).
In the long-term, the pair has largely recovered from recent lows in 2015. The technical structure suggests a growing upside momentum. The pair is trading above from its 200 DMA. Strong resistance can be found at 0.9500 psychological level
EUR/CHF Selling pressures increase.
EUR/CHF is trading lower. We believe that the medium-term pattern suggests us to see continued bearish pressures towards key support that can be found at 1.0623 (24/06/2016 low).
In the longer term, the technical structure is mixed. Resistance can be found at 1.1200 (04/02/2015 high). Yet,the ECB's QE programme is likely to cause persistent selling pressures on the euro, which should weigh on EUR/CHF. Supports can be found at 1.0184 (28/01/2015 low) and 1.0082 (27/01/2015 low).
USD/CHF Heading Lower, USD/CAD Riding Downtrend Channel, AUD/USD Downside Pressures.
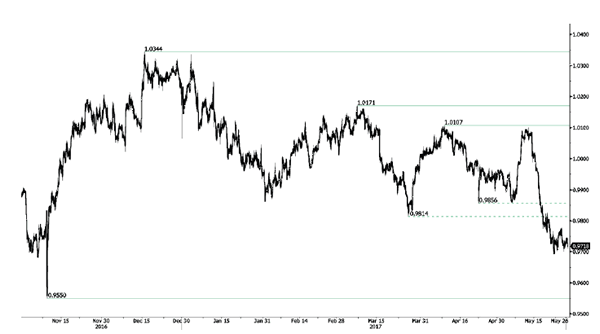
USD/CHF Heading lower.
USD/CHF continues to push lower since the pair broke support located at 0.9814 (27/03/2017 low). Strong resistance is given at 1.0107 (10/04/2017 high). Expected to show continued weakness.
In the long-term, the pair is still trading in range since 2011 despite some turmoil when the SNB unpegged the CHF. Key support can be found 0.8986 (30/01/2015 low). The technical structure favours nonetheless a long term bullish bias since the unpeg in January 2015
USD/CAD Riding downtrend channel.
USD/CAD keeps on weakening since the pair reached 1.3800. Hourly support can be found at 1.3411 (24/04/2017 high) then 1.3353 (20/01/2017 high). Expected to show continued bearish pressures within downtrend channel.
In the longer term, there is now a death cross with the 50 dma crossing below the 200 dma indicating further downside pressures. Strong resistance is given at 1.4690 (22/01/2016 high). Long-term support can be found at 1.2461 (16/03/2015 low).
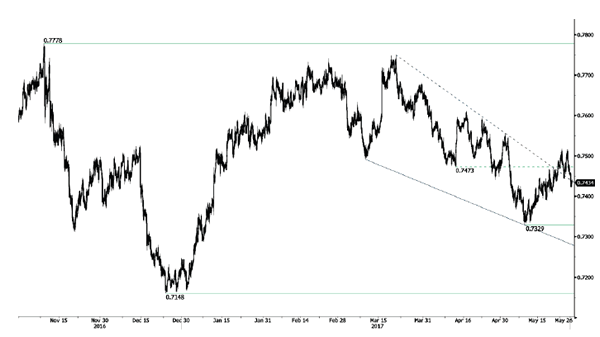
AUD/USD Downside pressures.
AUD/USD is pushing lower. Hourly support is given at 0.7329 (09/05/2017 low). As long as prices remain below the resistance at 0.7608 (17/04/2017 high), there are strong downside risks.
In the long-term, we are waiting for further signs that the current downtrend is ending. Key supports stand at 0.6009 (31/10/2008 low) . A break of the key resistance at 0.8295 (15/01/2015 high) is needed to invalidate our long-term bearish view.
EUR/USD Targeting Resistance At 1.3000, GBP/USD Lack Of Follow-Through, USD/JPY Weakening.
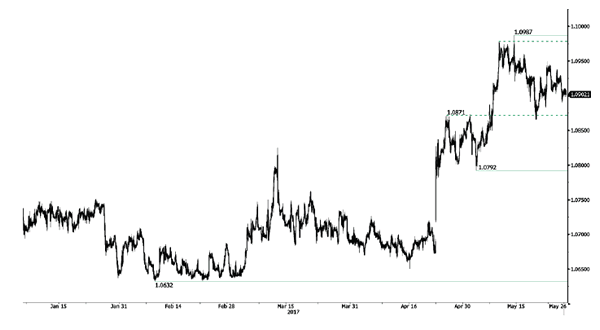
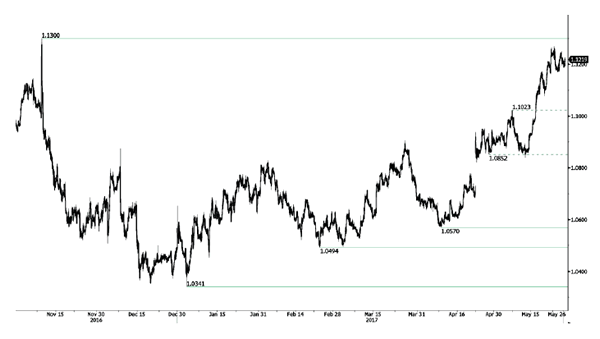
EUR/USD Targeting resistance at 1.3000.
EUR/USD is trading higher towards strong resistance at 1.1300 (09/11/2017 high). Hourly support can be found at 1.1169 (24/05/2017 low). Stronger support lies at 1.0842 11/05/2017 low).and key support is given at 1.0494 (22/02/2017 low). Expected to continue growing higher.
In the longer term, the death cross late October indicated a further bearish bias. The pair has broken key support given at 1.0458 (16/03/2015 low). Key resistance holds at 1.1714 (24/08/2015 high). Expected to head towards parity.
GBP/USD Lack of follow-through.
GBP/USD is trading sideways. Hourly resistance is given at 1.3048 (18/05/2017 high). Hourly support are given at 1.2831 (04/05/2017 low) and 1.2757 (21/04/2017 low). An unlikely break of this last support would indicate further weakness. Expected to show renewed buliish pressures.
The long-term technical pattern is even more negative since the Brexit vote has paved the way for further decline. Long-term support given at 1.0520 (01/03/85) represents a decent target. Long-term resistance is given at 1.5018 (24/06/2015) and would indicate a long-term reversal in the negative trend. Yet, it is very unlikely at the moment.
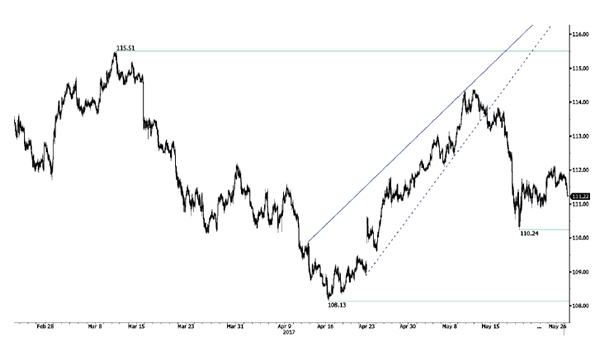
USD/JPY Weakening.
USD/JPY has exited the symmetrical triangle and keeps pushing lower. Hourly support is given at 110.24 (18/05/2017 low). Stronger support is located at 108.13 (17/04/2017 low). Other key supports lie at a distant 106.04 (11/11/2016 low). The road is wide-open for further decline.
We favor a long-term bearish bias. Support is now given at 96.57 (10/08/2013 low). A gradual rise towards the major resistance at 135.15 (01/02/2002 high) seems absolutely unlikely. Expected to decline further support at 93.79 (13/06/2013 low).
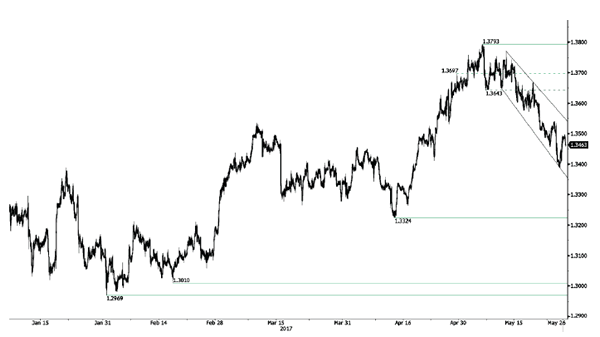
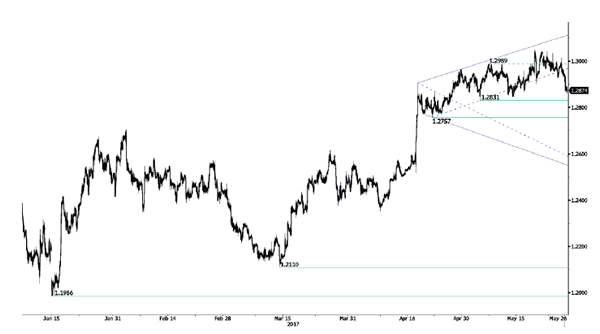
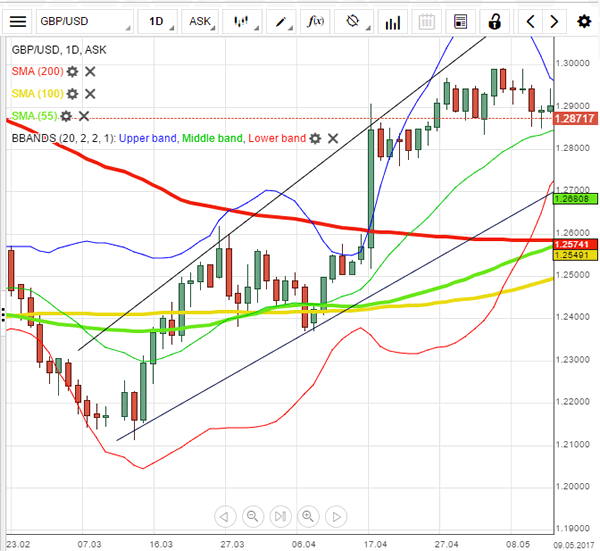
Trade Idea: GBP/USD – Sell at 1.2920
GBP/USD – 1.2875
Recent wave: Wave V of larger degree wave (III) has ended at 1.1986 and major correction has commenced from there for gain to 1.3000 and 1.3140-50
Trend: Near term up
New strategy :
Sell at 1.2920, Target: 1.2770, Stop: 1.2980
Position: -
Target: -
Stop:-
The British pound met heavy selling pressure at 1.3015 yesterday and has tumbled, the breach of previous support at 1.2866 signals top has been formed at 1.3048 earlier, hence consolidation with downside bias is seen for further fall to 1.2844 and 1.2831 support, break there would provide confirmation and bring further fall to 1.2800 and later towards support at 1.2757 which is likely to hold on first testing.
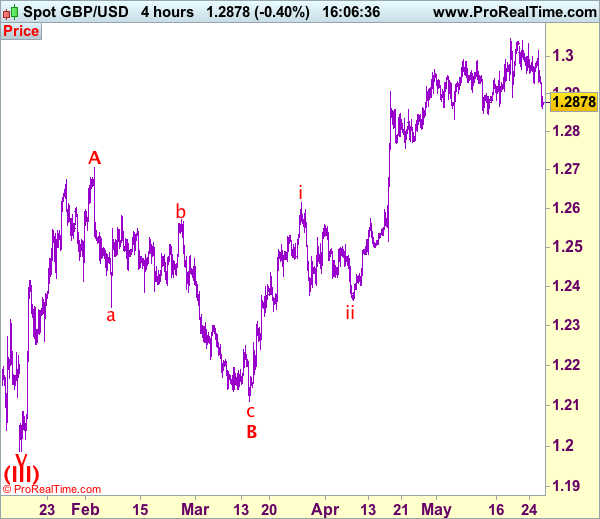
Our preferred count on the daily chart is that cable's rebound from 1.3500 (wave (A) trough) is unfolding as a wave (B) with A ended at 1.7043, followed by triangle wave B and wave C as well as wave (B) has ended at 1.7192, the subsequent selloff is the larger degree wave (C) which is still unfolding with minor wave (III) of larger degree wave 3 ended at 1.1986, hence wave (IV) correction is in progress which could either be a triangle wave (IV) of a complex formation but upside should be limited to 1.3500 and price should falter well below 1.4000, bring another decline in wave (V) of 3 for weakness to 1.1500, then 1.1200.
On the upside, whilst recovery to 1.2900 is likely, reckon previous support at 1.2926 would turn into resistance and limit cable’s upside, bring another decline. Above 1.2965-70 would defer and risk a stronger rebound to 1.3000 but said resistance at 1.3015 should remain intact, bring another decline later.
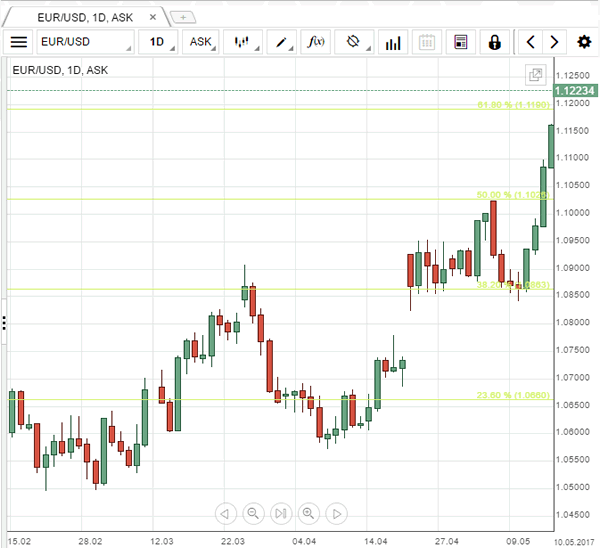
EUR/USD Analysis: Rebounds Back Above 1.12
'It was supposed to be a year of risk that could lead to a break up of the euro. It's turning out to be the best year in a decade for the shared currency.' – Stefania Spezzati, Bloomberg
Pair's Outlook
During the early hours of Friday's trading session the common European currency traded against the US Dollar just above the strong support cluster near the 1.1190 level. It is almost exactly where this week's trading session began. Due to that factor the situation remains almost unchanged. From the downside the rate is supported by the combined support of the 61.80% Fibonacci retracement level and the monthly R2 at the already mentioned level. From the upside the pair faces the resistance of the upper Bollinger band at 1.1310 and the weekly R1 at 1.1306. The only difference, compared with Monday, is the fact that the Bollinger band has moved higher.
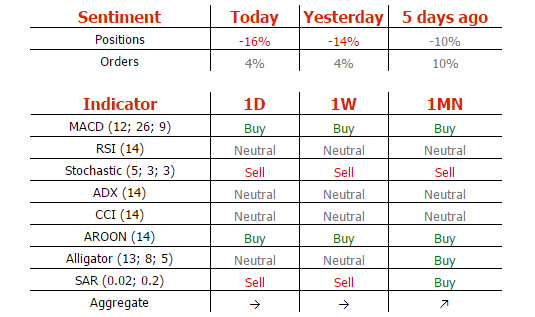
Traders' Sentiment
Traders remain bearish on the pair, as 61% of open positions are short. Meanwhile, 53% of trader set up orders are to sell the Euro.
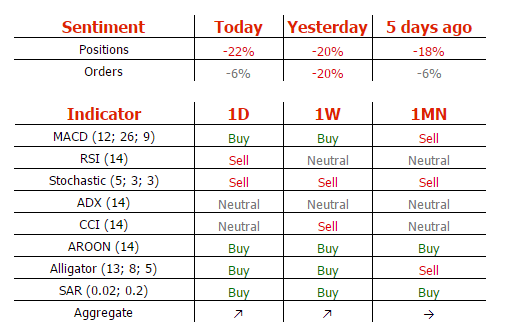
GBP/USD Analysis: To Retest Trends’ Supports
'I think the pressure is on here. We could see a significant move lower (in sterling) provided these uncertainties [the upcoming elections in the UK] in the polls persist.' – Stephen Innes, OANDA (based on Reuters)
Pair's Outlook
Yesterday, once again the Cable remained relatively unchanged, experiencing a small decline, which caused the consolidation trend to be preserved for another day. Risks are still skewed to the downside, but with the GBP/USD pair having a strong support at 1.2850, formed by the lower Bollinger band, the consolidation trend's lower boundary and the broadening rising wedge's support line. Losses are unlikely to exceed this area, although volatility lower is quite possible. Meanwhile, technical studies are unable to confirm either scenario, as they retain mixed signals.
Traders' Sentiment
Market sentiment remains relatively neutral, as 52% of all open positions are short and the remaining 48% are short. At the same time, the share of buy orders inched slightly up, namely from 52 to 53%.
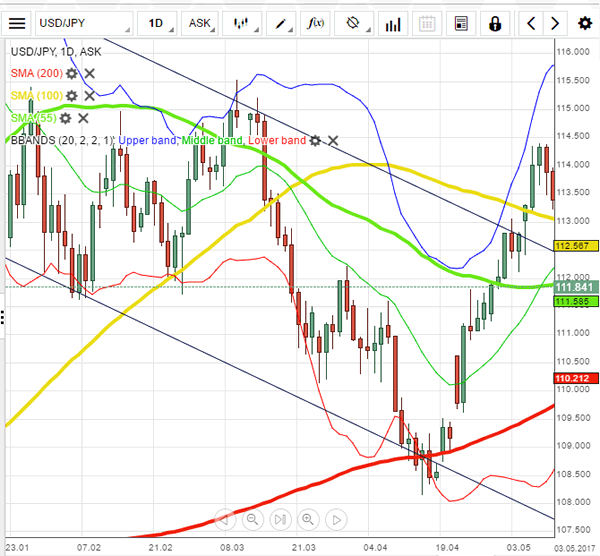
USD/JPY Analysis: Still Anchored To 55-Day SMA
'The rise in Treasury yields is supporting the dollar. It appears that speculative buying of Treasuries has run its course, with Trump concerns and geopolitical risks no longer fresh news.' – Daiwa Securities (based on Reuters)
Pair's Outlook
The Greenback successfully outperformed the Japanese Yen on Thursday, causing another setback in the anticipated decline towards 111.00. Treasury yields keep weighing on the Buck, thus, a negative outcome is most likely today, despite technical indicators being unable to confirm this possibility. The weekly PP and the 55-day SMA now form immediate support, but are likely to fail at holding the losses. The main target at the moment is the 111.00 handle, but a drop that low is yet uncertain, as fundamental data could have a bullish effect on the USD/JPY pair today, in which case intraday losses have a solid chance of completely being erased.
Traders' Sentiment
Traders remain bearish towards the US Dollar, with 58% of all open positions being short. Purchase orders take up 52% of the market.
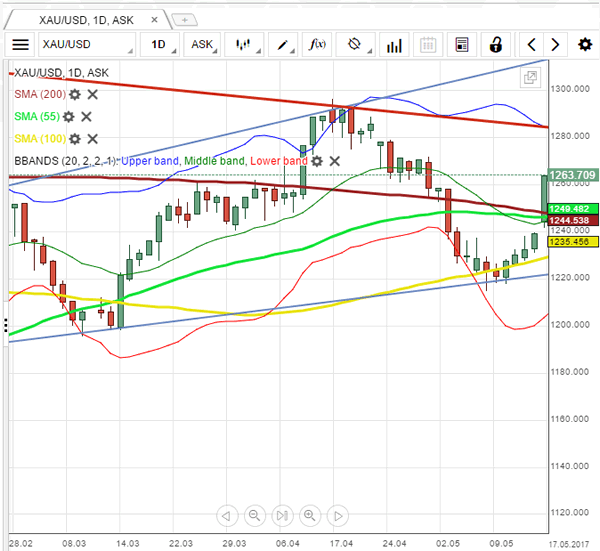
Gold Analysis: Fails To Surge Above 1,260
'China's net gold imports via main conduit Hong Kong dropped 33.5 percent in April from the previous month.' – Vijaykumar Vedala, Reuters
Pair's Outlook
On Friday morning the yellow metal's price remained below the 1,260 mark, as it failed to reach for the levels near the 1,270 level. However, during Thursday's and Friday's trading the commodity price did not need to retreat for support of the cluster near the 1,250 mark. Which means that a bullish momentum persists in the bullion. Moreover, the 55-day SMA seems to be moving away from the mentioned support cluster to provide support higher. These small factors combined allow to keep in force the forecast of the yellow metal reaching the 1,270 mark in the near future.
Traders' Sentiment
SWFX market sentiment remains unchanged, as 51% of open positions are short. However, 71% of pending commands are to buy the bullion.