Sample Category Title
USD/CAD Candlesticks and Ichimoku Analysis
Weekly
• Last Candlesticks pattern: Shooting doji
• Time of formation: 02 May 2016
• Trend bias: Up
Daily
• Last Candlesticks pattern: Bearish engulfing
• Time of formation: 5 May 2017
• Trend bias: Up
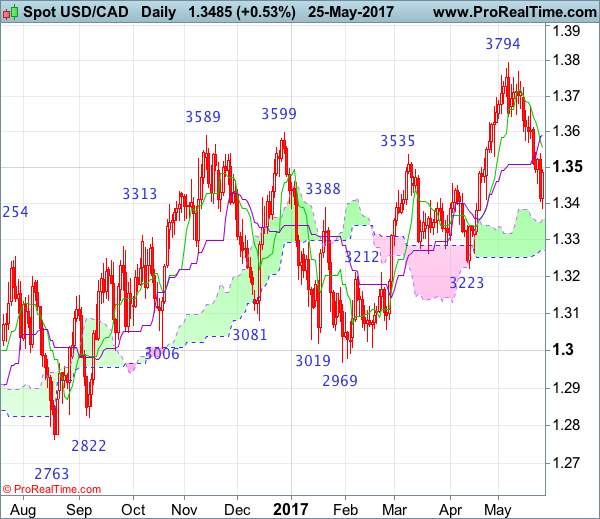
USD/CAD – 1.3408
As the greenback has dropped again after brief bounce to 1.3670, dampening our bullishness and suggesting top has been formed at 1.3794, hence consolidation with downside bias is seen for further weakness to the upper Kumo (now at 1.3357), however, break of support at 1.3262 is needed to retain bearishness and bring test of key level at 1.3223. Looking ahead, only a daily close below this support would signal recent entire rise from 1.2461 has ended instead, bring further fall to 1.3150-60 and possibly towards 1.3100 but support at 1.3056 should remain intact and price should stay above 1.3009.
On the upside, whilst initial recovery to 1.3530-40 cannot be ruled out, reckon the Tenkan-Sen (now at 1.3555) would limit upside and bring another decline. Only a daily close above the Kijun-Sen (now at 1.3591) would defer and suggest first leg of decline from 1.3794 has ended instead, bring a stronger rebound to 1.3630 and then 1.3670 but upside should be limited to 1.3700-10 and price should falter below said resistance at 1.3794, bring another decline later.
Recommendation: Sell at 1.3540 for 1.3340 with stop above 1.3640.
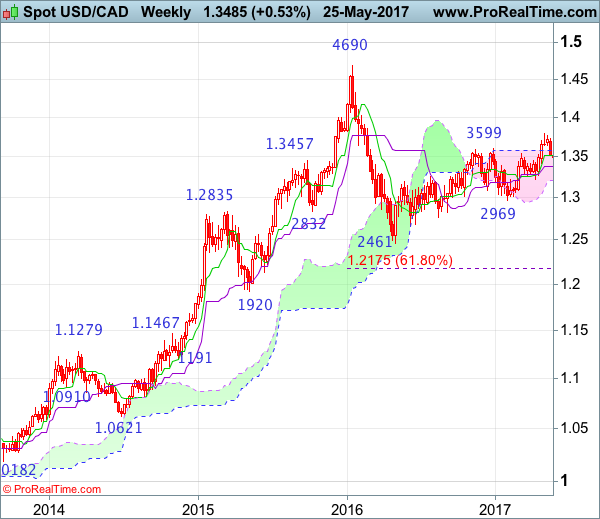
On the weekly chart, the greenback has slipped again this week after last week’s long black candlestick, reinforcing the view of a bearish reversal pattern (shooting doji), suggesting top has been formed at 1.3794 and consolidation with downside bias is seen for weakness to 1.3345-50, then towards 13262 support but break of key level at 1.3223 is needed to add credence to this view, bring further fall to 1.3140-50, then 1.3080-85, however, downside should be limited to 1.3000-10 and previous chart support at 1.2969 should remain intact.
On the upside, expect recovery to be limited to 1.3541 resistance and bring another decline. Above the upper Kumo (now at 1.3576) would bring a stronger rebound towards resistance at 1.3670 but still reckon upside would be limited to 1.3700 and bring another decline later. Only a break of 1.3794 resistance would revive bullishness and signal recent erratic upmove from 1.2461 (2016 low) has resumed and extend further gain to 1.3835-40 (61.8% Fibonacci retracement of 1.4690-1.2461) and then 1.3900 but psychological resistance at 1.4000 should remain intact.
GBP/USD Daily Outlook
Daily Pivots: (S1) 1.2934; (P) 1.2967; (R1) 1.3007; More...
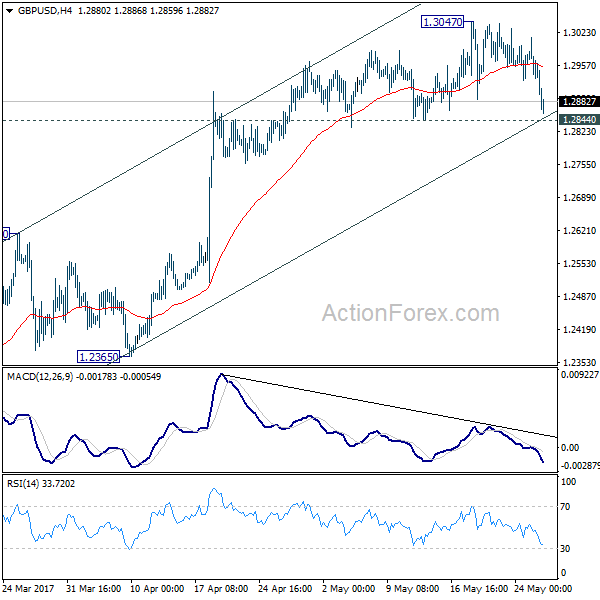
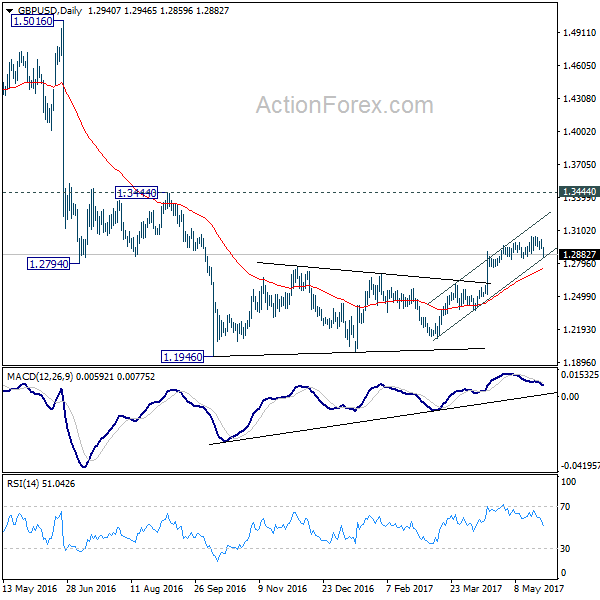
GBP/USD's fall from 1.3047 accelerates lower but it's staying above 1.2844 support for the moment. Intraday bias remains neutral first. As long as 1.2844 minor support holds, further rise remains mildly in favor. Nonetheless, as we are still viewing price actions from 1.1946 as a corrective move, we'd expect upside to be limited below 1.3444 resistance to bring near term reversal. On the downside, break of 1.2844 will indicate short term topping and turn bias back to the downside for 1.2614 resistance turned support first.
In the bigger picture, fall from 1.7190 is seen as part of the down trend from 2.1161. There are signs of reversal, like breaking of 55 week EMA, weekly MACD turned positive, and monthly MACD crossed above signal line. But still, break of 1.3444 resistance is need to confirm medium term bottoming. Otherwise, outlook will remains bearish for extend the down trend through 1.1946 low.
USD/JPY Daily Outlook
Daily Pivots: (S1) 111.54; (P) 111.74; (R1) 112.02; More...
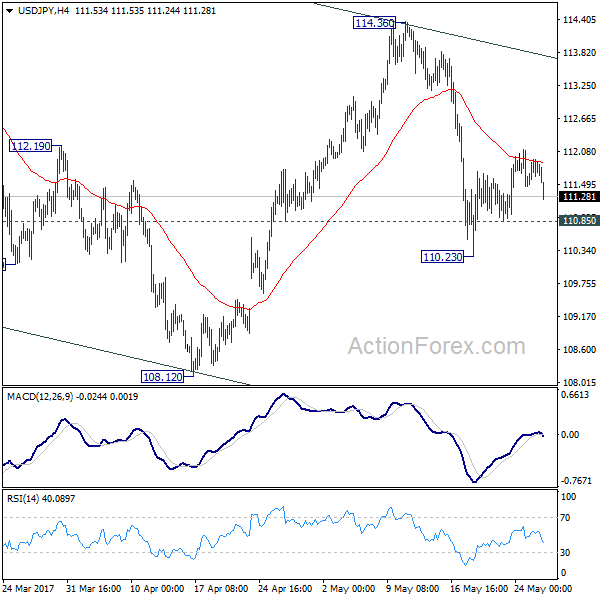
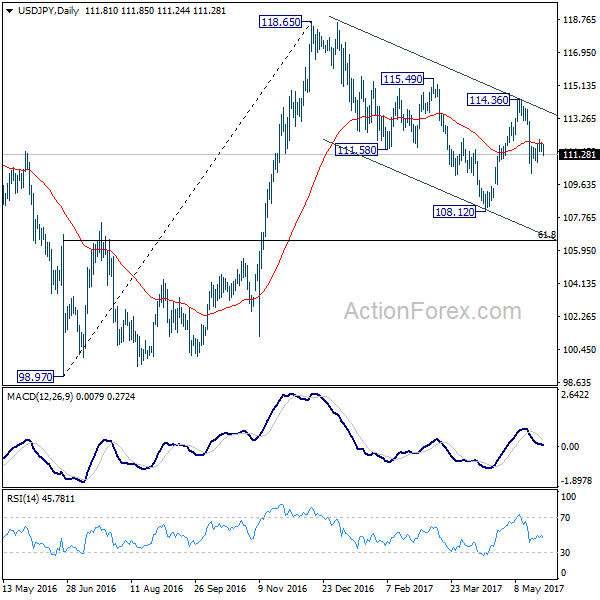
No change in USD/JPY's outlook. The corrective price actions from 110.23 could still extend. But after al, it's a correction and the larger fall is expected to resume later. On the downside, below 110.85 minor support will turn bias to the downside to extend the fall from 114.36 to 108.12 low. Break there will resume the whole decline from 118.65. In that case, we'll look for bottoming signal again at 61.8% retracement of 98.97 to 118.65 at 106.48.
In the bigger picture, price actions from 125.85 high are seen as a corrective pattern. It's uncertain whether it's completed yet. But in case of another fall, downside should be contained by 61.8% retracement of 75.56 to 125.85 at 94.77 to bring rebound. Overall, rise from 75.56 is still expected to resume later after the correction from 125.85 completes.
USD/CHF Daily Outlook
Daily Pivots: (S1) 0.9707; (P) 0.9722; (R1) 0.9745; More.....
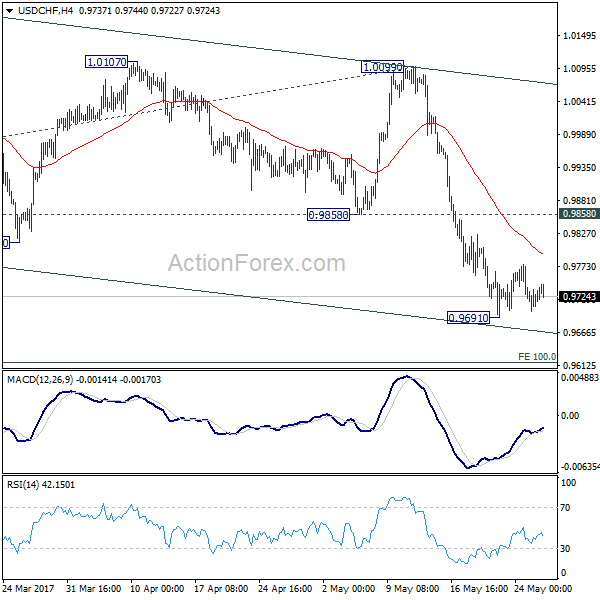
Intraday bias in USD/CHF remains neutral as it's staying in consolidation from 0.9691. In case of another rise, upside is expected to be limited by 0.9858 support turned resistance and bring fall resumption. Whole decline from 1.0342 is still in progress and below 0.9691 will target 100% projection of 1.0342 to 0.9860 from 1.0099 at 0.9617. We'll start to look for reversal signal below there.
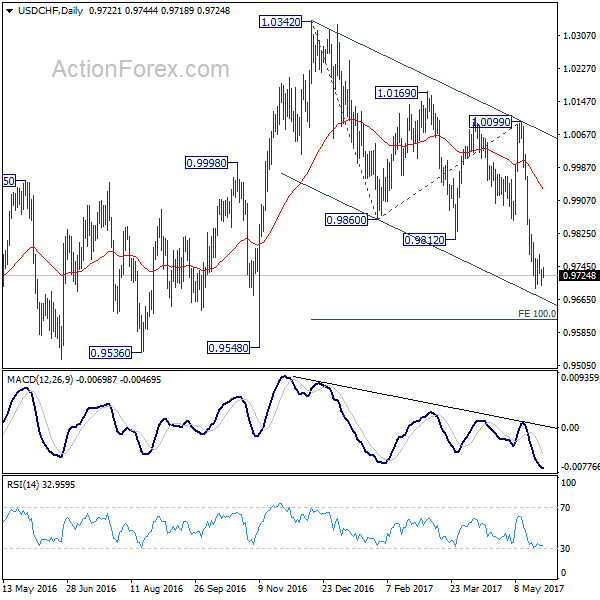
In the bigger picture, USD/CHF is bounded in medium term range of 0.9443/1.0342 for the moment. Consolidative trading would likely continue and medium term outlook remains neutral. Break of 1.0342 key resistance is needed to confirm underlying bullish momentum in the pair. Meanwhile, downside attempts should be contained by 0.9443 key support level.
EUR/USD Daily Outlook
Daily Pivots: (S1) 1.1185; (P) 1.1218 (R1) 1.1242; More....
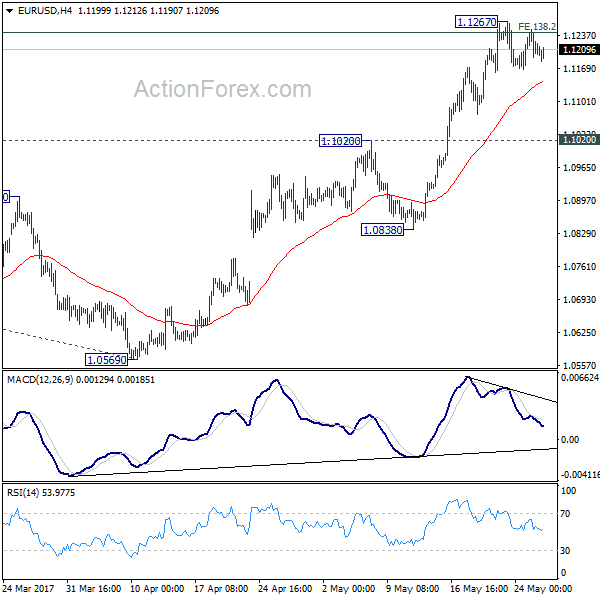
Intraday bias in EUR/USD remains neutral as consolidation from 1.1267 is still in progress. We'd stay cautious on strong resistance from 1.1245/98 (138.2% projection of 1.0339 to 1.0828 from 1.0569 at 1.1245) resistance zone to limit upside and bring reversal. But decisive break of 1.1298 will carry larger bullish implication and target 1.1615 resistance next. On the downside, though, break of 1.1020 resistance turned support will indicate rejection from 1.1245/98 and turn bias to the downside for 1.0838 support first.
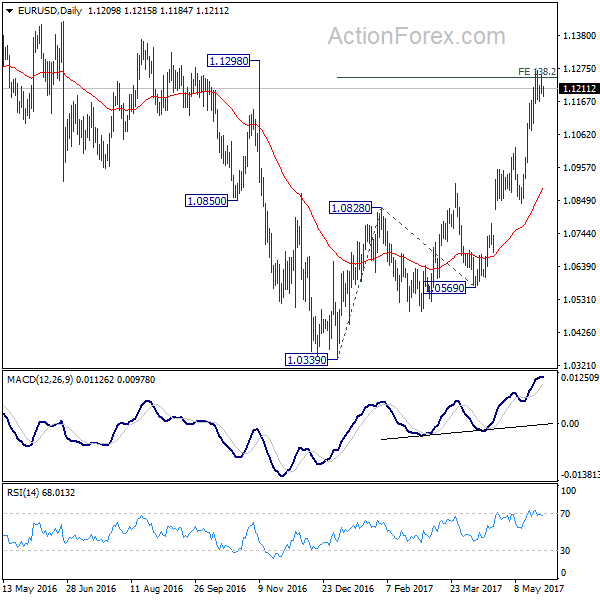
In the bigger picture, the case for medium term reversal continues to build up with EUR/USD now far above 55 week EMA. Also, bullish convergence condition is seen in weekly MACD. Focus will now be on 1.1298 key resistance. Rejection from there will maintain medium term bearishness and would extend the whole down trend from 1.6039 (2008 high). However, firm break of 1.1298 will indicate reversal. In such case, further rally would be seen back to 1.2042 support turned resistance next.
The Main Event Today Is The G7 Meeting In Italy
Market movers today
The main event today is the G7 meeting in Italy as well as the impact on inflation from the continued decline in the oil prices after the OPEC meeting.
There are only have a few data releases out of the US today, where the second round of US GDP numbers as well as the second estimated for PCE for Q1 are due to be published this afternoon.
Yesterday, European government bond yields fell on the back of the move in US Treasury yields on Wednesday after the release of the FOMC minutes. The minutes were seen to be dovish by the market. Given the comments from the FOMC, we have changed our call for three-four hikes to three hikes next year. There were also more signals on the reduction on the balance sheet (QT). Read more on our view on the Federal Reserve, rate hikes and QT in FOMC Minutes, Fed outlines QT principles and expects to hike soon, 24 May 2017.
Selected market news
The oil price continued to decline after the OPEC meeting disappointed the market. OPEC extended the supply cuts but the market had hoped for more. Read more here: Flash Comment International: OPEC supply cut extension disappoints the oil market, 25 May 2017.
This has dragged down energy shares in the Asian region and many of the Asian equity indices have declined this morning and have been unable to follow the positive sentiment from the US markets yesterday.
In the currency market, the euro is trying to break through the 1.12 versus the USD, while USDJPY has been range-trading around the 111-112 level. The People's Bank of China is planning to change the yuan reference calculation by adding a ‘counter-cyclical adjustment factor'. This should aim to limit big swings in the market.
The Fed's James Bullard supported the statements in the FOMC minutes in comments made to reporters in Tokyo this morning that the Fed is ‘very close' to where it needs to be on monetary policy.
In Europe, both Fitch and Moody's have published positive statements on Portugal after the EU commission recommended that Portugal should be exiting the ‘excessive deficit procedure'. Moody's notes this is a credit positive, while Fitch notes that this ‘underscores the strengthening in the country's public finances following policy adjustments and an economic recovery'. This is supportive for the PGB market even though short term, the focus will be on the possibility of additional issuance, as the Portuguese Debt Office recently announced that it will step up the repayment of the IMF debt.
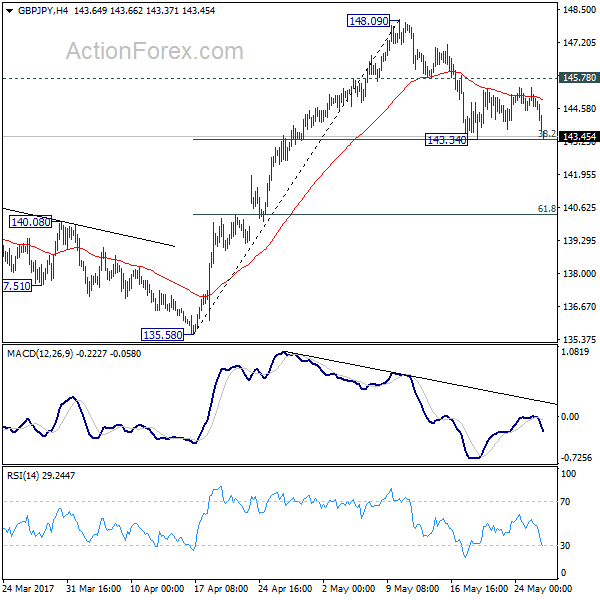
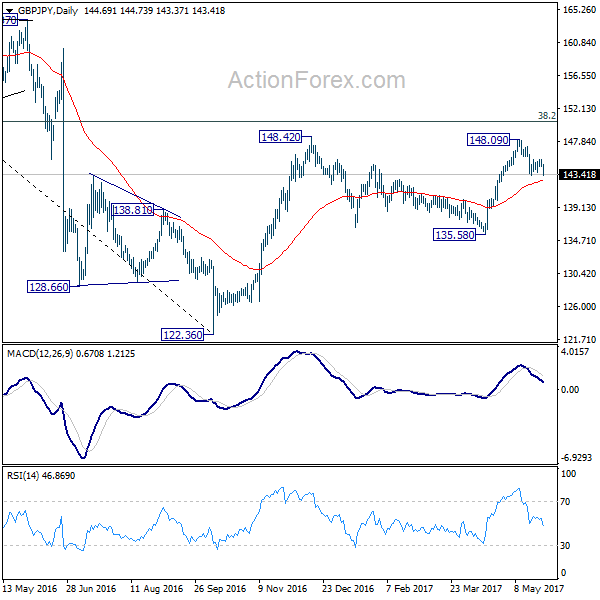
GBP/JPY Daily Outlook
Daily Pivots: (S1) 144.32; (P) 144.88; (R1) 145.28; More....
GBP/JPY's recovery was limited below 145.78 resistance and drops sharply. Focus is now on 143.34 support. Break there will extend the whole decline from 148.09 to 61.8% retracement of 135.58 to 148.09 at 140.35. At this point, we'd still expect rebound from 122.36 to resume later. Hence, we'd look for strong support below 140.35 to contain downside and bring rebound. Ob the upside, above 145.78 will turn bias back to the upside for retesting 148.09 first.
In the bigger picture, based on current momentum, rise from 122.36 bottom should be developing into a medium term move. Break of 38.2% retracement of 195.86 to 122.36 at 150.42 should pave the way to 61.8% retracement at 167.78. This will now be the favored case as long as 135.58 support holds.
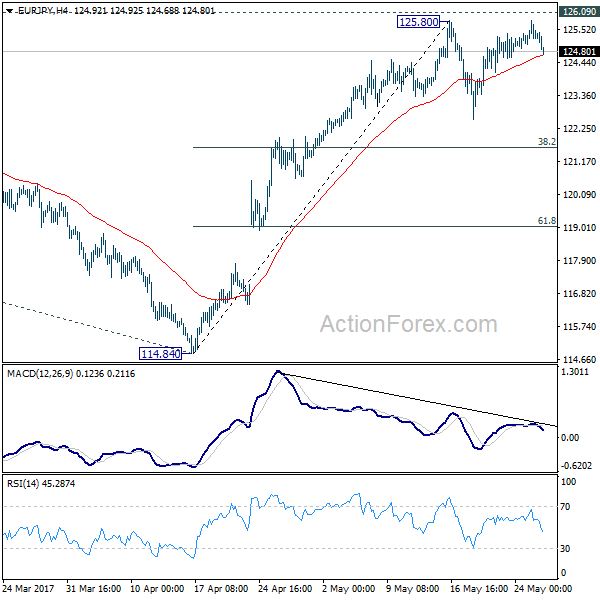
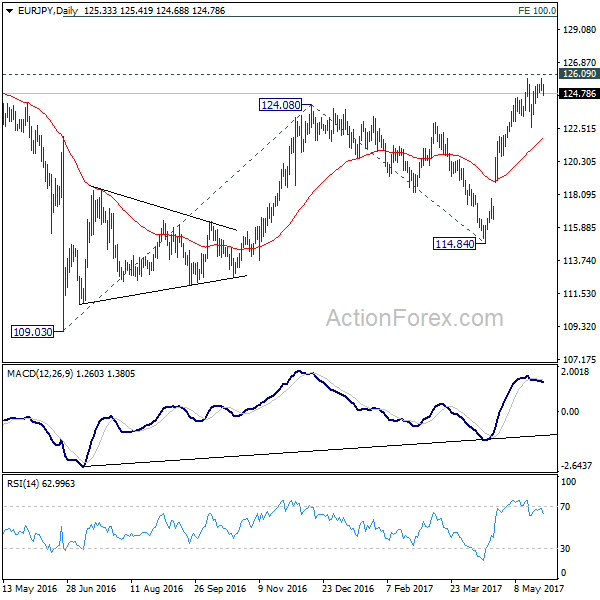
EUR/JPY Daily Outlook
Daily Pivots: (S1) 125.01; (P) 125.41; (R1) 125.75; More...
EUR/JPY failed to take out 125.80 resistance and weakens again. Intraday bias remains neutral as the consolidation from 125.80 might extend with another fall. But still, downside should be contained by 38.2% retracement of 114.84 to 125.80 at 121.61 to bring rise resumption. We're staying mildly bullish in the cross. And, break of 126.09 key resistance will extend the whole rebound from 109.03 to 100% projection of 109.03 to 124.08 from 114.84 at 129.89.
In the bigger picture, focus is back on 126.09 support turned resistance. Decisive break there will confirm completion of the down trend from 149.76. And in such case, rise from 109.20 is at the same degree and should target 141.04 resistance and above. Meanwhile, rejection from 126.09 and break of 114.84 will extend the fall from 149.76 through 109.20 low.
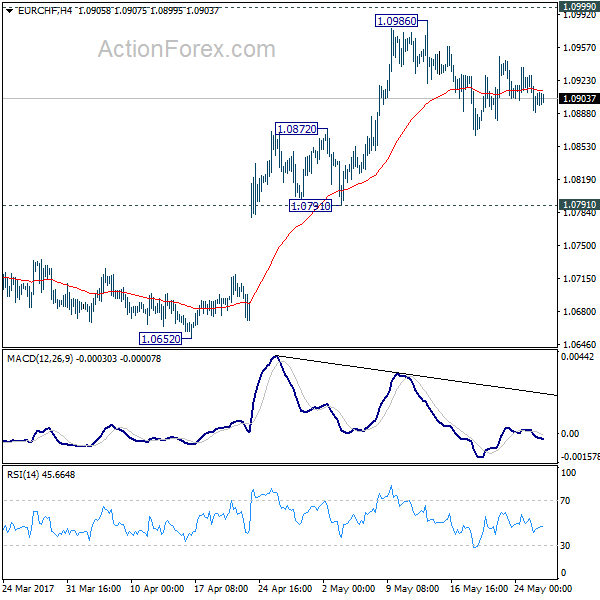
EUR/CHF Daily Outlook
Daily Pivots: (S1) 1.0889; (P) 1.0908; (R1) 1.0927; More...
No change in EUR/CHF's outlook as consolidation from 1.0986 extends. Intraday bias remains neutral for the moment. Deeper fall could be seen but downside is expected to be contained by 1.0791/0872 support zone to bring rise resumption. As noted before, the consolidative pattern from 1.1198 should be completed. Firm break of 1.0999 resistance will pave the way for a retest on 1.1198 high.
In the bigger picture, the price actions from 1.1198 are seen as a corrective move. Current strong rebound is raising the chance that it's completed after defending 38.2% retracement of 0.9771 to 1.1198 at 1.0653. Decisive break of 1.0999 resistance will target a test on 1.1198 high. For now, this will be the preferred case as long as 1.0791 support holds.

EUR/AUD Daily Outlook
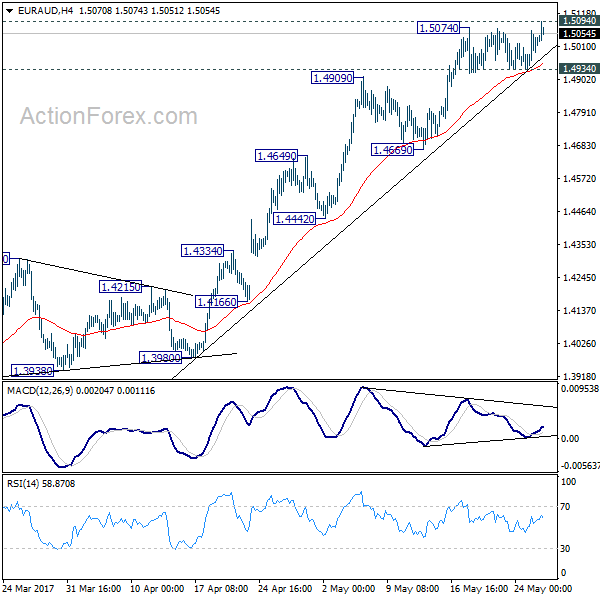
Daily Pivots: (S1) 1.4963; (P) 1.5013; (R1) 1.5087; More...
Breach of 1.5074 suggests that recent rise in EUR/AUD is resuming and intraday bias is back on the upside. We're holding on to the bullish view that the medium term trend has reversed. Break of 1.5094 resistance will extend the rally from 1.3624 to next medium term fibonacci level at 1.5455. On the downside, below 1.4934 will indicate short term topping and bring lengthier consolidation. But further rise would remain in favor as long as 1.4669 support holds.
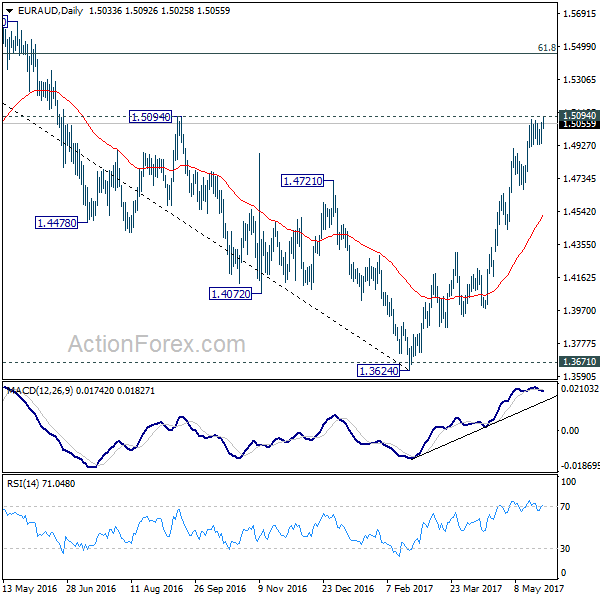
In the bigger picture, price actions from 1.6587 medium term top are viewed as a corrective pattern. Such correction should be completed at 1.3624 after defending 1.3671 key support. Rise from 1.3642 is now expected to target 61.8% retracement of 1.6587 to 1.3624 at 1.5455 and above. In any case, outlook will now stay cautiously bullish as long as 1.4309 resistance turned support holds.