
Sample Category Title
Japan’s National Consumer Prices Came In As Expected In April
For the 24 hours to 23:00 GMT, the USD rose 0.15% against the JPY and closed at 111.77.
Overnight data showed that Japan's national consumer price index (CPI) rose 0.4% YoY in April, mainly driven by higher energy prices, after reporting an advance of 0.2% in the previous month. Moreover, the core CPI also inched up by 0.3%, but missed analysts' estimate of a 0.4% increase.
In the Asian session, at GMT0300, the pair is trading at 111.56, with the USD trading 0.19% lower against the USD from yesterday's close.
The pair is expected to find support at 111.42, and a fall through could take it to the next support level of 111.29. The pair is expected to find its first resistance at 111.82, and a rise through could take it to the next resistance level of 112.09.
The currency pair is trading below its 20 Hr and 50 Hr moving averages.

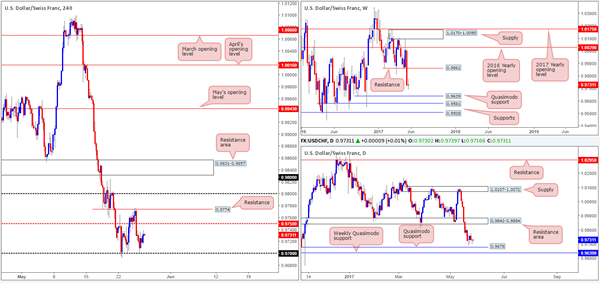
Swiss Franc Trading Slightly Lower In The Morning Session
For the 24 hours to 23:00 GMT, the USD marginally declined against the CHF and closed at 0.9730.
In the Asian session, at GMT0300, the pair is trading at 0.9735, with the USD trading a tad higher against the CHF from yesterday’s close.
The pair is expected to find support at 0.9708, and a fall through could take it to the next support level of 0.9682. The pair is expected to find its first resistance at 0.9753, and a rise through could take it to the next resistance level of 0.9772.
Investors will now keep a close eye on Switzerland’s GDP figures, KOF leading indicator, UBS consumption indicator, ZEW’s survey on expectations and real retail sales, all slated to release next week.
The currency pair is trading above its 20 Hr and 50 Hr moving averages.

Loonie Trading Slightly Lower This Morning
For the 24 hours to 23:00 GMT, the USD rose 0.57% against the CAD and closed at 1.3488.
In the Asian session, at GMT0300, the pair is trading at 1.3489, with the USD trading marginally higher against the CAD from yesterday’s close.
The pair is expected to find support at 1.3419, and a fall through could take it to the next support level of 1.3349. The pair is expected to find its first resistance at 1.3528, and a rise through could take it to the next resistance level of 1.3567.
With no economic release in Canada today, traders will now closely await nation’s GDP growth figures for the first quarter as well as March, along with manufacturing PMI data for May, all scheduled to release next week.
The currency pair is trading above its 20 Hr and 50 Hr moving averages.

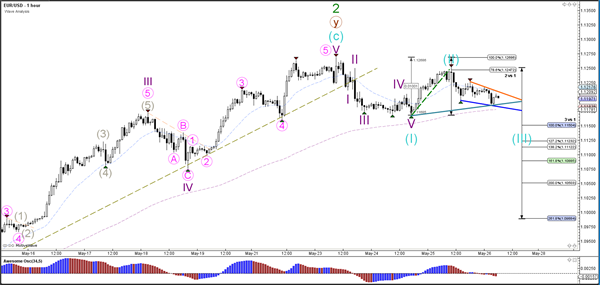
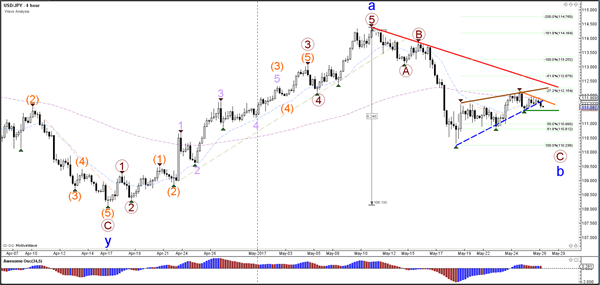
Daily Technical Analysis: EURUSD, GBPUSD, USDJPY, USDCHF
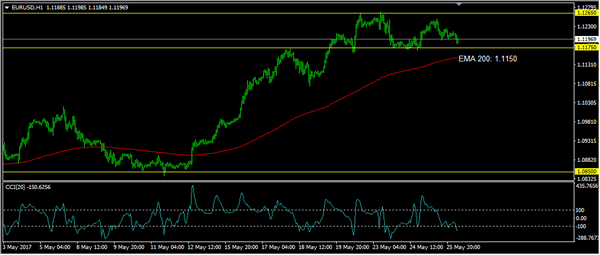
EURUSD
The EURUSD was indecisive yesterday. Price is moving sideways between 1.1265 – 1.1175 as you can see on my H1 chart below suggest a consolidation phase. The bias is neutral in nearest term. Immediate support is seen around 1.1175 – 1.1150 (H1 EMA 200). A clear break below that area could trigger further bearish pullback testing 1.1075 but overall I still prefer a bullish scenario at this phase and any downside pullback should be seen as a good opportunity to buy. On the upside, we need a clear break above 1.1265 to continue the bullish scenario targeting 1.1300 – 1.1350 area.
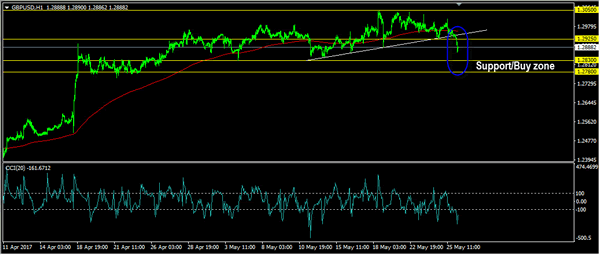
GBPUSD
The GBPUSD attempted to push higher yesterday, topped at 1.3013 but closed lower at 1.2940 and hit 1.2866 earlier today in Asian session. Price broke below the trend line support as you can see on my H1 chart below suggests a bearish correction phase targeting 1.2830 – 1.2780 key support area which is a good place to buy with a tight stop loss. Immediate resistance is seen around 1.2925/50. A clear break above that area could lead price to neutral zone in nearest term testing 1.3000 – 1.3050 key resistance area.
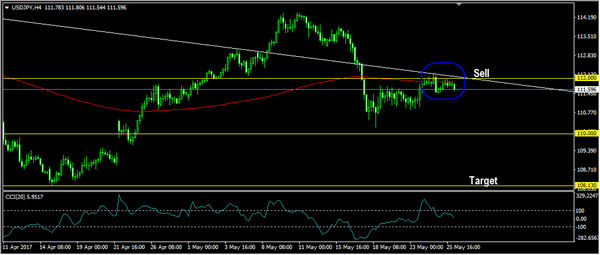
USDJPY
The USDJPY didn’t make significant movement yesterday. The bias is neutral in nearest term but as long as price stay below the trend line resistance (see my H4 chart below) and 112.00 area I still prefer a bearish scenario at this phase targeting 108.00 region. Immediate support is seen around 111.46 (yesterday’s low). A clear break below that area could trigger further bearish pressure testing 111.00 or lower. On the upside, 112.00 region remains a key resistance and good place to sell with a tight stop loss as a clear break above that area would nullify the bearish bias.
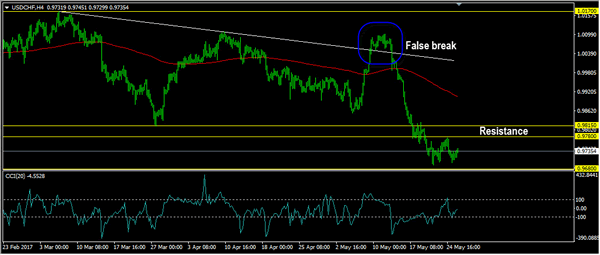
USDCHF
The USDCHF was indecisive yesterday. The bias is neutral in nearest term but overall price is still in a bearish phase as a part of the false breakout scenario as you can see on my H4 chart below with nearest target seen at 0.9650. Immediate resistance is seen around 0.9780 – 0.9815 area which remains a good place to sell with a tight stop loss.
EURGBP Looking Ready To Cool Off As The Week Closes
Key Points:
- Long-term wedge likely to put pressure on the pair moving forward.
- A number of technical readings are shifting their bias to bearish.
- An unclear fundamental forecast might see heightened technical trading.
The EURGBP is fast approaching what could prove to be another near-term peak for the pair which might see it make an about-face in the coming days. This apparent shift in bias is highlighted by a number of technical signals but, most notably, the presence of the long-term falling wedge structure. Ultimately, we don't expect to see massive losses accrued but there could be some decent downside risk to capitalise on.
Starting with the long-term wedge, we can take a closer look at exactly what evidence we have to suggest losses are now coming down the line. As illustrated below, the upside of the wedge is currently being tested by the EURGBP and a reversal here is looking likely given the trend line forecasted by the January and March highs. However, as this trend of lower-highs has only been tested twice, it's understandable to be somewhat sceptical that this is, in fact, a strong zone of resistance.
Luckily for us, we have a number of other technical signals on offer which also indicate that a downturn could be on the horizon. For one, the stochastics are deeply overbought and in sore need of being relieved by a near-term slip to the downside. What's more, the ADX is barely registering that the recent upswing even counts as a weak trend – its reading hovering at around the 20.00 mark. Both of these instruments suggest that the bulls are nearly exhausted and that the mere presence of that declining trend line could be an effective cap on gains moving forward.
If we do indeed see a reversal, losses should be limited to around the 0.8546 level. This is predominantly due to the fact that this price represents the intersection of the 100 day moving average and the 61.8% Fibonacci level. Nevertheless, don't discount the pair's ability to sink below this handle as the EURGBP could invert its parabolic SAR reading here which would, in turn, help to keep the bulls out in force. The result of this would likely see the EURGBP move below its 100 day moving average and potentially even test the downside of the wedge.
Ultimately, our technical outlook is rather bearish moving ahead and we don't have a strong fundamental reason to put this forecast into doubt. Regardless, keep half an eye on both the Brexit and Greek Debt Crises as they are likely to upset the balance of power between the EUR and the GBP moving ahead. Exactly which side of the quote will be favoured by any breaking news is not yet clear so, whilst we can speculate that we are going to see increased volatility, we may have to rely on the technical bias a bit more than usual which should mean losses are now on the cards.
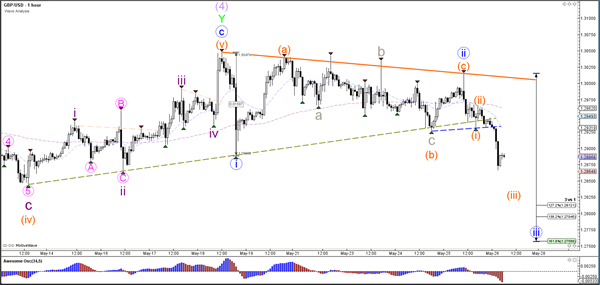
Daily Technical Analysis: GBP/USD Completes Reversal Pattern At 1.30 Resistance
Currency pair GBP/USD
The GBP/USD broke the support trend line (dotted green) of the bullish channel, which could indicate a potential bearish reversal or correction. The Cable was unable to break above the 1.30 psychological round level.
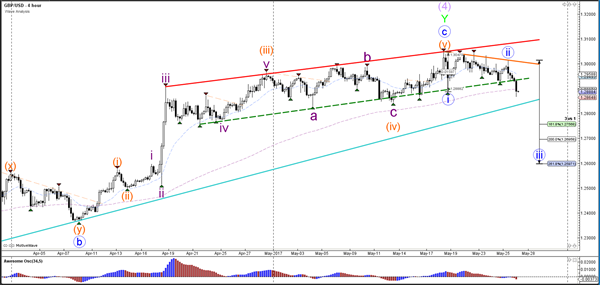
The GBP/USD showed a lengthy consolidation zone but broke below several key support levels (dotted lines). This bearish break could start a wave 3 (orange) which would become more likely if price managed to reach 1.2825. A wave could emerge once the wave 3 is confirmed and completed.
Currency pair EUR/USD
The EUR/USD failed to break above the 1.1250 resistance zone so far which is a major decision zone for either a bullish breakout or a bearish reversal. The critical level is the 100% Fibonacci at 1.1268: a break above this resistance top invalidates wave 2 (blue) whereas a break above 1.13 invalidates another bearish wave 2 (green). A bearish reversal, however, could see price break below support (blue).
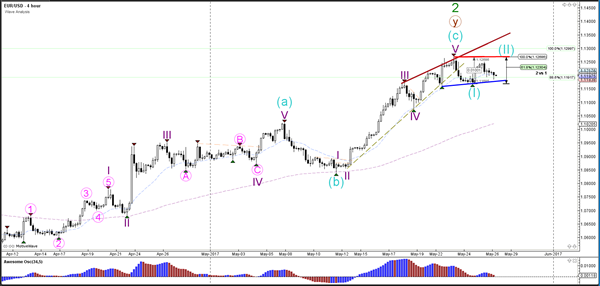
The EUR/USD respected and turn at the 78.6% Fibonacci resistance. Price will now need to show new direction by breaking support (blue) or resistance (orange).
Currency pair USD/JPY
The USD/JPY is unable to break above the -27.2% Fibonacci target and could be building a bearish break (dotted blue) instead. Price will need to break below the support fractal (green) before a larger push could occur.
The USD/JPY is could be in wave 3 (purple) if price manages to reach the 161.8% Fibonacci target.
Daily Technical Outlook And Review: EUR/USD, GBP/USD, AUD/USD, USD/JPY, USD/CAD, USD/CHF, DOW 30, GOLD
A note on lower timeframe confirming price action...
Waiting for lower timeframe confirmation is our main tool to confirm strength within higher timeframe zones, and has really been the key to our trading success. It takes a little time to understand the subtle nuances, however, as each trade is never the same, but once you master the rhythm so to speak, you will be saved from countless unnecessary losing trades. The following is a list of what we look for:
- A break/retest of supply or demand dependent on which way you're trading.
- A trendline break/retest.
- Buying/selling tails ... essentially we look for a cluster of very obvious spikes off of lower timeframe support and resistance levels within the higher timeframe zone.
- Candlestick patterns. We tend to only stick with pin bars and engulfing bars as these have proven to be the most effective.
We typically search for lower-timeframe confirmation between the M15 and H1 timeframes, since most of our higher-timeframe areas begin with the H4. Stops are usually placed 1-3 pips beyond confirming structures.
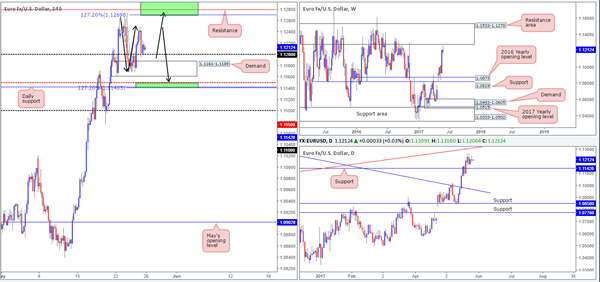
EUR/USD
Beginning with the weekly timeframe this morning, we can see that this unit remains lurking beneath the edge of a formidable resistance area coming in at 1.1533-1.1278. The zone has managed to cap upside since May 2015, so it's not a base one should ignore. On the daily timeframe, however, the candles are seen consolidating between a support level drawn from 1.1142 and a trendline resistance etched from the low 1.0711.
Transferring over to the H4 timeframe, it's easy to see that the single currency recently stabilized around the 1.12 handle following a modest selloff from a high of 1.1250 during yesterday's London morning segment. Based on this recent movement, we have some interesting harmonics at play:
First up is the H4 mid-level support at 1.1150, shadowed closely by daily support mentioned above at 1.1142. What makes this small zone so interesting is the H4 AB=CD (see black arrows) 127.2% Fib ext. at 1.1140 taken from the high 1.1268.
The second area of interest can be seen between 1.13/1.1269. This zone boasts a H4 resistance at 1.1279, a round number at 1.13 and a H4 AB=CD (see black arrows) 127.2% Fib ext. at 1.1269 taken from the low 1.1168. Also of interest here is the daily trendline resistance mentioned above, as it intersects beautifully with the 1.13 handle.
Our suggestions: Technically speaking, there is equal opportunity to trade this pair both a long and short today, as both noted zones boast a daily support/resistance.
However, we do slightly favor the resistance area 1.13/1.1269 since there is less restriction seen below the zone. The support area noted at 1.1142/1.1150 has a rather large demand planted above it at 1.1161-1.1189 that could potentially act as a resistance!
Data points to consider: US Core durable goods orders and US prelim GDP q/q at 1.30pm GMT+1.
Levels to watch/live orders:
- Buys: 1.1142/1.1150 ([waiting for a reasonably sized H4 bull candle – preferably a full-bodied candle – to form before pulling the trigger is advised] stop loss: ideally beyond the candle's tail).
- Sells: 1.13/1.1269 ([waiting for a reasonably sized H4 bear candle – preferably a full-bodied candle – to form before pulling the trigger is advised] stop loss: ideally beyond the candle's wick).
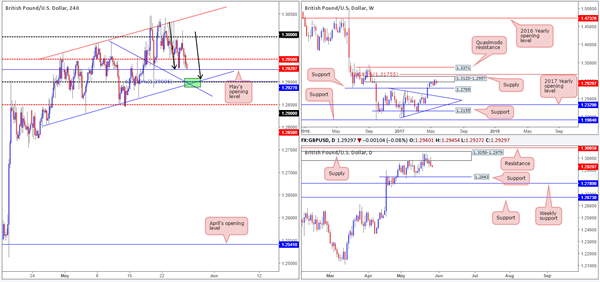
GBP/USD
The H4 candles, as you can see, failed to generate much follow-through buying after crossing the large psychological boundary 1.30 during yesterday's London morning session. Consequent to this, the H4 mid-level support at 1.2950 was consumed and, as we write, May's opening level seen nearby at 1.2927 is currently being challenged. Beyond this monthly level, key support rests around the 1.29 handle. Here's why:
H4 channel support converges with 1.29 taken from the low 1.2804.
H4 trendline support etched from the high 1.2987 also fuses with 1.29.
A H4 AB=CD (see black arrows) 127.2% Fib ext. at 1.29 taken from the high 1.3033 lines up beautifully with the 1.29 level.
While this small area does appear tempting, we still have to take into account what the higher-timeframe structure is telling us, which, in our opinion, is not really supportive. Weekly price remains trading from a supply base drawn from 1.3120-1.2957, and daily action continues to trade from a supply seen within the said weekly supply at 1.3058-1.2979. The closest higher-timeframe support rests at 1.2843.
Our suggestions: Although the higher timeframes point to further selling, there's no reason not to expect a bounce from the 1.2888/1.2907 (green rectangle) today. How much of a bounce is difficult to judge since we could find resistance around May's opening level mentioned above at 1.2927, so we'd recommend handling this trade aggressively here guys.
Data points to consider: US Core durable goods orders and US prelim GDP q/q at 1.30pm GMT+1.
Levels to watch/live orders:
- Buys: 1.2888/1.2907 – a bounce is expected from here – stops best placed below 1.2888.
- Sells: Flat (stop loss: N/A).
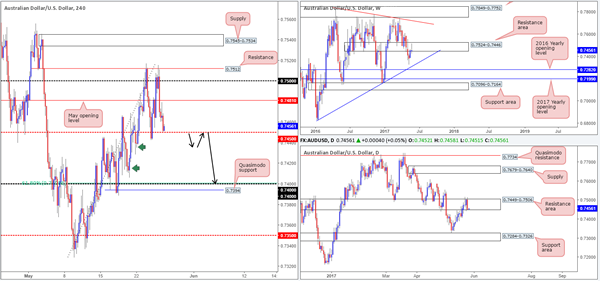
AUD/USD
Kicking this morning's report off from the weekly timeframe, it's clear to see that the sellers have stamped in some authority within the resistance area planted at 0.7524-0.7446. This move is further supported by the full-bodied bearish daily candle formed within a daily resistance zone seen housed within the said weekly area at 0.7449-0.7506. So, for now at least, the bears do look as though they have the upper hand.
Looking over to the H4 timeframe, nonetheless, the mid-level support at 0.7450 is currently holding this market higher. It's doubtful that this will continue for an extended period given the higher-timeframe structures in play right now! A decisive H4 close below 0.7450 would likely reach the 0.74 handle, and quite possibly lower, as the next higher-timeframe downside target does not come into view until we reach the daily support area at 0.7284-0.7326.
Our suggestions: Is a H4 close below 0.7450 a tradable move? In our opinion, yes it is. Granted we do have two nearby H4 demands lurking nearby marked with green arrows (0.7440/0.7420), and these zones may produce a minor reaction. The more appealing area, however, is definitely 0.74, since it merges with a 61.8% Fib support taken from the low 0.7328 and a H4 Quasimodo support at 0.7394. Therefore, we believe this is where the market will target beyond 0.7450.
Personally, we would wait for a H4 close to form below 0.7450, that follows through with a retest at 0.7450 as resistance and then prints a reasonably sized H4 bear candle, preferably a full-bodied candle, before committing to a position.
Data points to consider: US Core durable goods orders and US prelim GDP q/q at 1.30pm GMT+1.
Levels to watch/live orders:
- Buys: Flat (stop loss: N/A).
- Sells: Watch for H4 price to engulf 0.7450 and then look to trade any retest seen thereafter ([waiting for a reasonably sized bear candle to form following the retest is advised] stop loss: ideally beyond the candle's wick).
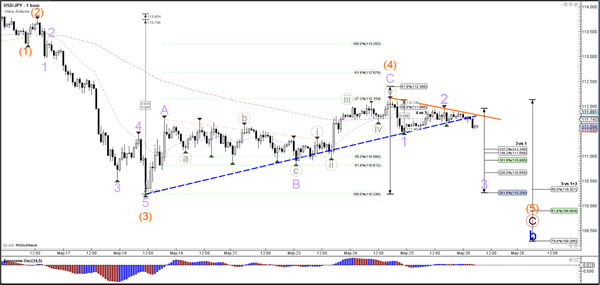
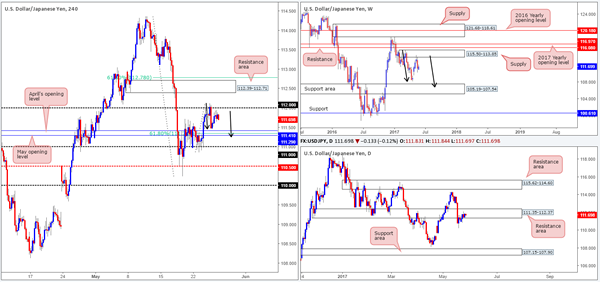
USD/JPY
As can be seen from the H4 chart this morning, the candles are seen trading between the 112 handle and May/April's opening levels at 111.29/111.41. Also of particular interest on this scale is the potential AB=CD pattern (black arrows) that terminates around May's opening line at 111.29, which also boasts a 61.8% Fib support at 111.34 taken from the low 110.85.
Despite this confluence, the bigger picture shows that the daily candles are seen trading within the confines of a resistance area penciled in at 111.35-112.37. What's more, we also see weekly action showing room for the unit to trade as low as 105.19-107.54: a support area stretched all the way back to early 2014!
Our suggestions: A bounce is highly likely to be seen from 111.29/111.41. How much of a bounce though is difficult to judge since a long from here would entail going up against potential weekly/daily sellers. If you still intend on going long from this region, we would strongly advise using strict trade management, since getting caught on the wrong side of higher-timeframe flow would not be pleasant!
Data points to consider: US Core durable goods orders and US prelim GDP q/q at 1.30pm GMT+1.
Levels to watch/live orders:
- Buys: 111.29/111.41– a bounce is expected from here – stops best placed below 111.29.
- Sells: Flat (stop loss: N/A).
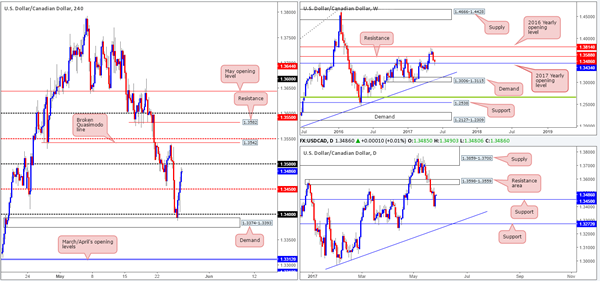
USD/CAD
The USD/CAD, as you can see, advanced beautifully from the H4 demand at 1.3374-1.3393 yesterday as the price of oil aggressively tumbled lower. As we write, the H4 candles are seen lurking just ahead of the 1.35 band, which could potentially halt further buying. Over on the daily timeframe, the pair closed back above the support level at 1.3450. This could bring about a move up to the resistance area pegged at 1.3598-1.3559 that happens to hold a weekly resistance line at 1.3588 within.
Our suggestions: Right now we do not see much structure to hang our hat on. Buying this market, although the higher-timeframe flow suggests additional upside is possible, could be risky in view of the nearby 1.35 line. In regards to selling, our desk would not be comfortable on the sell side of this market knowing where price is positioned on the higher timeframes.
So for now, we're going to remain on the sidelines.
Data points to consider: US Core durable goods orders and US prelim GDP q/q at 1.30pm GMT+1.
Levels to watch/live orders:
- Buys: Flat (stop loss: N/A).
- Sells: Flat (stop loss: N/A).
USD/CHF
The Swissy, once again, found itself tackling the 0.97 handle yesterday, and has managed to hold firm for a third consecutive time this week! The bounce from this line has placed the H4 candles within striking distance of the H4 mid-level resistance line at 0.9750, which could be seeing some action sometime during today's sessions. Sitting directly below the 0.97 handle, however, is a daily Quasimodo support at 0.9678. And a few pips below here sits a weekly Quasimodo support barrier coming in at 0.9639.
Personally, we do not see much tradable structure at this time. But what we would be interested in is trading a fakeout of 0.97. A fakeout through this psychological band that connects with the aforementioned daily Quasimodo support is a valid long, in our book of technical setups. The reason being is there are likely a truckload of sell stops lingering just below 0.97. These stops, when filled, become sell orders, and give the big boys liquidity to buy into from the daily Quasimodo!
Our suggestions: Should price whipsaw through 0.97, test 0.9678, and close back above 0.97, we will look to enter long, targeting the 0.9750 region as an initial take-profit target.
Data points to consider: US Core durable goods orders and US prelim GDP q/q at 1.30pm GMT+1.
Levels to watch/live orders:
- Buys: 0.97 region ([wait for price to fakeout beyond the 0.97 handle – touch 0.9678 – and then close back above 0.97, before looking to commit to a position] stop loss: ideally beyond the candle's tail).
- Sells: Flat (stop loss: N/A).
DOW 30
The H4 supply at 21139-21101 held beautifully during yesterday's segment, despite multiple attempts to push into the zone. This base, technically speaking, is the last remaining supply standing in the way of this index achieving fresh record highs.
The bulls are in fine form on the weekly timeframe, recently breaching the top edge of a trading range fixed between 20425/21000. In the event that this bullish momentum continues to be seen, it's highly likely that fresh record highs will be achieved. Climbing down to the daily candles, we can see that the resistance area at 21022-20933 was also recently taken out. Assuming that the bulls remain above this zone today, we would expect this base to offer support to the market.
Our suggestions: Although the bulls look incredibly determined at this time, entering long expecting price to reach new highs would still be a risk, in our opinion. Waiting for the H4 supply mentioned above at 21139-21101 to be taken out is likely the safer route, before considering hunting for longs. Therefore, until we see a decisive close above this area, our desk will remain patiently waiting on the sidelines.
Data points to consider: US Core durable goods orders and US prelim GDP q/q at 1.30pm GMT+1.
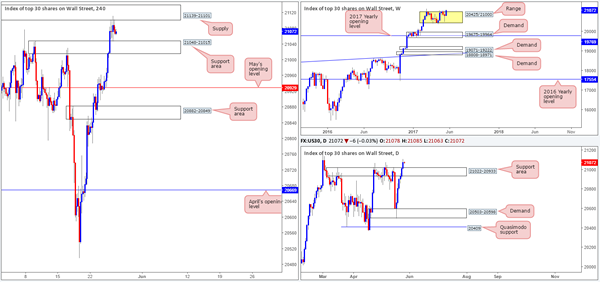
Levels to watch/live orders:
- Buys: Watching for H4 price to close above H4 supply at 21139-21101 before looking to long this market.
- Sells: Flat (stop loss: N/A).
GOLD
It was a rather monotonous day in the gold market yesterday, with price ranging no more than $6. As a result, much of the following report will echo thoughts put forward in Thursday's analysis…
Based on recent H4 action, the candles have, in our opinion, entered into a phase of consolidation between 1245.9/1248.0 (March/April's opening levels) and a H4 supply zone coming in at 1268.3-1262.7. With the H4 supply being positioned just below May's opening level at 1270.5 and also located around the top edge of a daily resistance area currently in play at 1265.2-1252.1, the bulls will likely struggle to get beyond this wall. With that being said, we feel that price will eventually break to the downside and look to target the daily support area drawn from 1216.7-1225.7, which happens to converge with a trendline support taken from the low 1180.4. Also notice here that the H4 support level marked at 1227.2 is positioned directly above this daily zone.
Our suggestions: For the time being, our desk has agreed that remaining on the sidelines until we see a decisive H4 close form beyond the current H4 range is the better/safer route to take. A decisive H4 close lower coupled with a retest to the underside of the range, and a reasonably sized H4 bearish candle (full-bodied if possible) would be enough evidence to suggest a short is valid down to 1227.2.
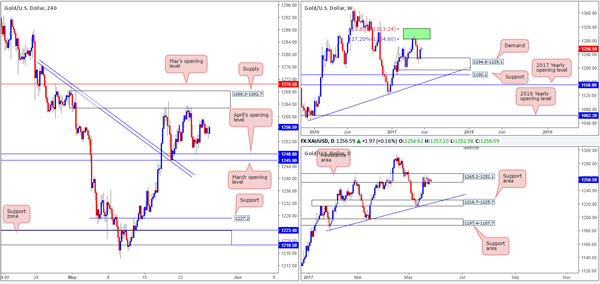
Levels to watch/live orders:
- Buys: Flat (stop loss: N/A).
- Sells: Watching for a H4 close to form below 1245.9/1248.0 before we consider shorts in this market.
European Open Briefing: Oil Prices Declined Sharply After The OPEC Agreement
Global Markets:
- Asian stock markets: Nikkei down 0.40 %, Shanghai Composite gained 0.10 %, Hang Seng rose 0.05 %, ASX 200 fell 0.65 %
- Commodities: Gold at $1257 (+0.10 %), Silver at $17.18 (-0.10 %), WTI Oil at $48.55 (-0.75 %), Brent Oil at $51.20 (-0.55 %)
- Rates: US 10-year yield at 2.25, UK 10-year yield at 1.04, German 10-year yield at 0.36
News & Data
- Japan National CPI (YoY) Apr: 0.4% (exp 0.4%; prev 0.2%)
- Tokyo CPI (YoY) May: 0.2% (prev -0.1%)
- Japan PPI Services (YoY) Apr: 0.7% (prev 0.8%)
- PBoC Fixes USDCNY Reference Rate At 6.8698 (prev fix 6.8695 prev close 6.8705)
- OPEC disappointment hits oil, stocks; sterling down on UK vote jitters – RTRS
- U.S. inflation path since 2012 is worrisome, policymaker says – RTRS
Markets Update:
Oil prices declined sharply after the OPEC agreement to extend the existing output cut deal disappointed speculators who were betting on larger cuts. WTI fell from $52 to a low of almost $48.
This put some pressure on the Canadian Dollar, which is sensitive to Oil price movements. USD/CAD rallied from 1.3380 to 1.35. A clear break above 1.35 would signal that the currency pair could recover further in the near-term. The next notable resistance level then lies at 1.3650/60.
The Dollar caught a bid overnight. The Euro fell back below 1.12, while GBP/USD declined to 1.2866. The Pound came under pressure after polls showed that UK Prime Minister May's lead is narrowing two weeks ahead of the election.
The Dollar was also boosted by hawkish comments by Federal Reserve member John Williams. He said that he sees three rate hikes as appropriate this year, and that the US economy is still running somewhat hot.
Upcoming Events:
- 08:00 BST – ECB Member Coeure speaks
- 13:30 BST – US GDP
- 15:00 BST – US Michigan Consumer Sentiment
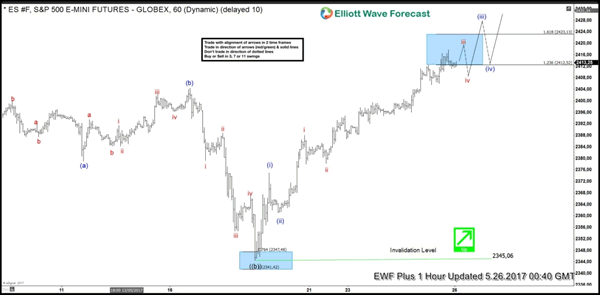
Elliott Wave View: ES_F E-Mini S&P500 Pullback Near
Short Term Elliott Wave view in ES_F E-Mini S&P500 suggests the rally to 2403.75 ended Minor wave A. Minor wave B unfolded as an Expanded Flat Elliott Wave structure where Minute wave ((a)) ended at 2379, Minute wave ((b)) ended at 2404.5, and Minute wave ((c)) of B ended at 2344.5. After ending the pullback, the Index started a new leg higher and the rally from 2344.5 low looks to be unfolding as a 5 waves Elliott Wave impulse structure where Minutte wave (i) ended at 2375, Minutte wave (ii) ended at 2361, and Minutte wave (iii) remains in progress and can reach 2423.13 or 161.8% fibonacci extension of Minutte wave (i). Expect Minutte wave (iv) pullback to start once Minutte wave (iii) is over before turning higher one more leg in Minutte wave (v). This last push higher will also complete larger degree Minute wave ((i)) and as impulse, it should be accompanied with momentum divergence.
Once Minute wave ((i)) is complete, the Index should pullback within Minute wave ((ii)) in 3, 7, or 11 swing to correct cycle from 5/18 low (2344.7) before the rally resumes again. As ES_F E-Mini S&P500 has broken above the previous peak at 2404.5, it gives more conviction that the Index has started the next leg higher and thus pullback can likely hold above 2344.7 for more upside. We don’t like selling the proposed pullback and expect buyers to appear again once Minute wave ((ii)) pullback is complete at later stage, provided that pivot at 2344.7 low remains intact.
Market Morning Briefing: Dollar Index (97.27) Held Previous Day’s Low
STOCKS
Dow (21082.95, +0.34%) has moved up exactly as expected. Now we need to see if it is able to break above 21200 or comes off sharply from there to re-test 21000 or lower in the near term. Note that 21200 is an important resistance to keep an eye on. A sustained break above 21200 could turn very bullish towards 21400-21600 in the long term.
Dax (12621.72, -0.17%) fell yesterday and is trading sideways within the 12700-12500 region for now. Trading exactly in the middle of the broader 12400-12900 region, there is equal chances of moving in either direction. We will have to wait and watch for some confirmation.
Shanghai (3109.25, +0.05%) has risen sharply breaking the immediate resistance on the daily charts, while the support on the 3-day charts has held well producing a bounce in the last few sessions as expected. There is enough room on the upside towards 3200 in the medium term.
Nikkei (19762.11, -0.26%) could possibly remain sideways within 20000-19600 region as mentioned earlier. Thereafter if resistance near 20000 holds, there could be a sharp fall towards 19200 or lower; else a sustained price confirmation above 20000 is needed to initiate further bullishness.
Nifty (9509.75, +1.59%) faced sharp bounce from levels just above our mentioned 9350 support. But also note that 9525 is an important immediate resistance and on a break above 9525-9530 only, we may become more bullish towards 9700-9800 on a longer term; else a fall back towards 9350-9300 is possible in the near term.
COMMODITIES
Muted price action has been seen in Gold (1256). If 1249 holds on a closing basis then sideways consolidation within 1249-1280 continues. Thus we need to keep a close watch on the price action in Dollar Index which could give some cue on further Gold direction. But we will remain bearish while it is trading below 1280 levels and a close below 1249 could open up 1230 levels as well.
Similar kind of trading pattern has been seen in silver (17.15) also. It is trading above 17 levels, thus a possibility of a sideways movement between 16.90-17.50 levels can't be ruled out.
Copper (2.58) is hovering around between 2.55-2.60 for last few days . Only above 2.62, higher resistances of 2.68-72 can come into consideration. In the medium term 2.55 are going to be a strong support now but a close below that could open up 2.44-35 levels as well.
We had clearly mentioned in our yesterday's morning briefing that “The only concern is the short term overbought condition though the downside possibly limited to 51.80 for Brent and 49.30 for WTI”. Yesterday Brent (51.50) fell $2.51, nearly 5% and WTI (48.88) was down by $2.45. Immediate trading range for Brent and WTI are 51.20-52.80 and 47.43-49.51 respectively.
FOREX
Dollar Index (97.27) held previous day's low to recover to a minor degree but the corrective bounce can reach 98.30 at best if it manages to break and sustain above the interim resistance of 97.45. Our downside target of 96.50-00 remains unchanged.
Euro (1.1196) is seeing a normal correction while the larger uptrend remains intact so far. This correction can take it to 1.1100-1.1075 where fresh buying can be expected again.
Dollar Yen (111.56) is almost stable and has not been able to break above 12 in the last 3-sessions. But while above important support at 110, there is scope for an upmove towards 114.0-114.5 in the medium term. We could possibly see a sideways consolidation for a few sessions before a sharp directional move is seen.
Pound (1.28890) is trading above support near 1.2865 and while that holds, a rise towards 1.32 cannot be ignored. Downside could be limited to 1.2750 in the next 2-3 sessions while an up move towards 1.3250 is still on the cards.
Aussie (0.7432) is trading lower and could possibly come off towards 0.74 or slightly lower in the near term.
Dollar Rupee (64.61) could remain stable within 64.90-64.50 today and while immediate resistance of 65.00-65.20 holds, the possibility of further Rupee weakness seems less.
INTEREST RATES
The US yields are almost stable but are trying to slowly inch up towards higher levels. There is some potential for an upmove in the near term.
The German-US 10YR (-1.88%) has come off from resistance at -1.83% and while that holds, the yield spread could come down in the near term.
The German yields by themselves are trying to move up slowly and looks bullish in the near term.
The UK yields are down and heading towards medium term support levels. A bounce thereafter could be possible by another 2-3sessions.
The Japanese yields on the other hand have fallen in the last 2-sessions and could test the earlier resistance turned support before again bouncing back in the longer run.