Sample Category Title
Trade Idea Wrap-up: GBP/USD – Hold long entered at 1.2960
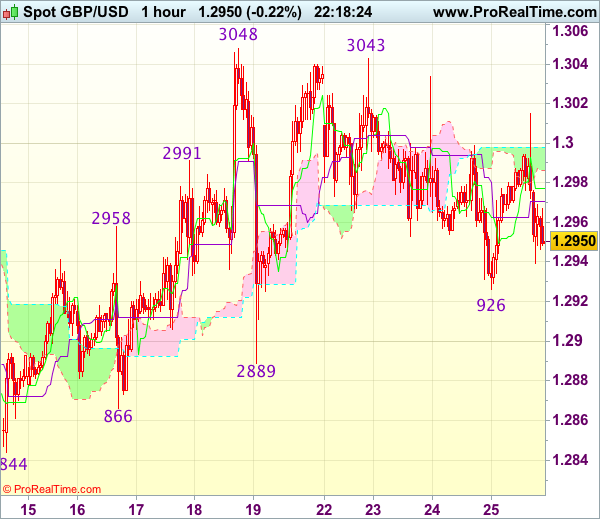
GBP/USD - 1.2950
Most recent candlesticks pattern : N/A
Trend : Near term up
Tenkan-Sen level : 1.2977
Kijun-Sen level : 1.2971
Ichimoku cloud top : 1.2998
Ichimoku cloud bottom : 1.2986
Original strategy :
Bought at 1.2960, Target: 1.3060, Stop: 1.2925
Position : - Long at 1.2960
Target : - 1.3060
Stop : - 1.2925
New strategy :
Hold long entered at 1.2960, Target: 1.3060, Stop: 1.2925
Position : - Long at 1.2960
Target : - 1.3060
Stop : - 1.2925
Failure to extend intra-day rebound and current retreat from 1.3015 suggest caution on our long position entered at 1.2960 but as long as yesterday’s low at 1.2926 holds, prospect of another rebound remains, above said intra-day high would bring test of strong resistance at 1.3043-48, however, break there is needed to confirm early upmove has resumed and extend headway to 1.3075-80 and possibly towards 1.3100-10 later.
In view of this, we are holding on to our long position entered at 1.2960. Below said support at 1.2926 would abort and risk weakness to 1.2900 but break of indicated support at 1.2889 is needed to signal top has been formed at 1.3048 earlier, bring retracement of recent upmove to 1.2850-55 first.
Trade Idea Wrap-up: EUR/USD – Stand aside
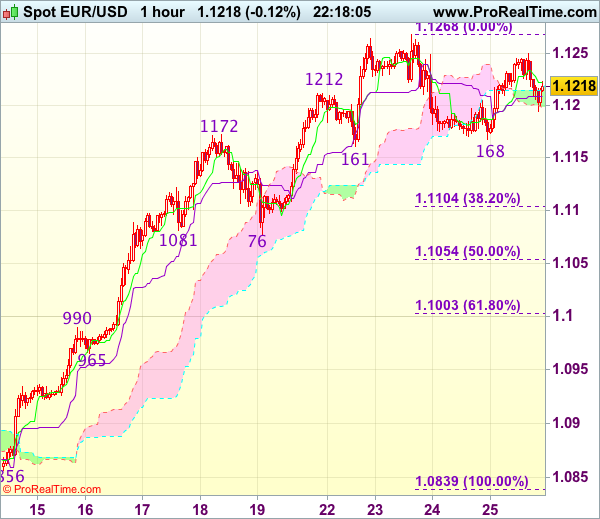
EUR/USD - 1.1214
Most recent candlesticks pattern : N/A
Trend : Up
Tenkan-Sen level : 1.1222
Kijun-Sen level : 1.1209
Ichimoku cloud top : 1.1217
Ichimoku cloud bottom : 1.1198
New strategy :
Stand aside
Position : -
Target : -
Stop : -
Although the single currency has rebounded after holding above previous support at 1.1161 and retest of this week’s high at 1.1268 cannot be ruled out, break there is needed to signal recent upmove has resumed and extend further gain to 1.1280-85 (61.8% projection of 1.0839-1.1172 measuring from 1.1076) and possibly towards 1.1300-10. If said resistance continues to hold, then further consolidation would take place.
On the downside, below 1.1195-00 would bring another corrective fall to 1.1161-68 support but break there is needed to signal top has been formed at 1.1268, bring retracement of recent upmove to 1.1130 but reckon downside would be limited to 1.1100-05 (38.2% Fibonacci retracement of 1.0839-1.1268) and price should stay well above support at 1.1076, bring rebound later.
Trade Idea Wrap-up: USD/JPY – Hold long entered at 111.50
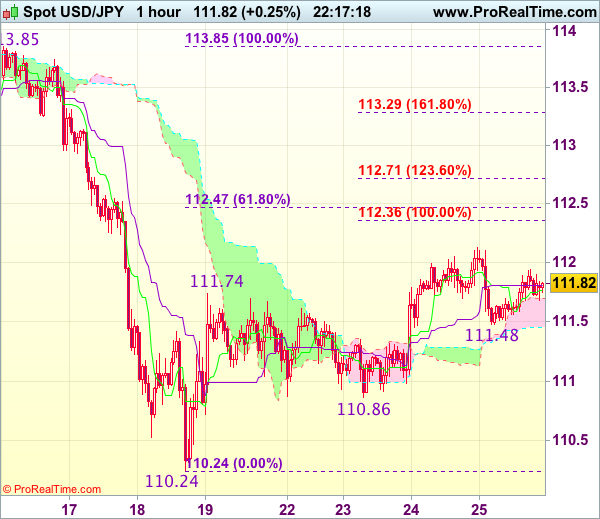
USD/JPY - 111.81
Most recent candlesticks pattern : N/A
Trend : Near term down
Tenkan-Sen level : 111.77
Kijun-Sen level : 111.81
Ichimoku cloud top : 111.70
Ichimoku cloud bottom : 111.46
Original strategy :
Bought at 111.50, Target: 112.50, Stop: 111.15
Position : - Long at 111.50
Target : - 112.50
Stop : - 111.15
New strategy :
Hold long entered at 111.50, Target: 112.50, Stop: 111.15
Position : - Long at 111.50
Target : - 112.50
Stop : - 111.15
Although the greenback retreated after meeting resistance at 112.13 yesterday, reckon the lower Kumo (now at 111.46) would limit downside and bring another rebound, above said resistance would extend the erratic rise from 110.24 low to 112.36 (100% projection of 110.4-11174 measuring from 110.86) and then 112.45-50 (61.8% Fibonacci retracement), however, reckon 112.75-80 would limit upside.
In view of this, we are holding on to our long position entered at 111.50. Below the lower Kumo (now at 111.46) would risk weakness to 111.25-30 but break of indicated support at 110.86 is needed to signal top is formed and suggest the rise from 110.24 has ended, then further fall to 110.50-55 would follow.
WTI Corrected After OPEC Meeting Outcome
Latest EIA data recorded a 4.43mn barrel decline in inventories for the latest week. WTI traded higher this morning, hitting the highest level of 51.96, last seen on April 19.
However, it was followed by a retracement after OPEC announced the existing output cut agreement to be extended for 9 months, as markets have largely priced in the expectations. The announcement was in line with the consensus.
The price rebounded after testing the significant support line at 50.00, where provide a stronger support.
Some OPEC member states exempted from the agreement, such as Iran, Libya, and Nigeria, have been increasing their production. Some non-OPEC oil producers, such as Russia and Ka-zakhstan, also attempt to enlarge their production.
In addition, the US shale oil industry has seen a marked recovery since February last year be-cause of higher oil prices. The US Baker Hughes data (that records the number of new Oil Rigs) is showing additional Rigs added every week.
In general, the oil supply remains high, which has and will offset OPEC's output cut effort to an extent.
The price will likely consolidate above the level at 50.00. It is not likely to see subsequent strong bullish momentum to boost the price further up.
The resistance level is at 51.20, followed by 51.50 and 52.00.
The support line is at 50.50, followed by 50.00 and 49.60.
CAC Steady in Holiday-Thinned Trade
The France CAC 30 continues to have a quiet week. This lack of movement has continued on Thursday, with French banks closed for Ascension Day. Early in the North American session, the CAC is trading at 5342.65 points. On the release front, there are no economic releases out of France or the eurozone. OPEC members are holding a meeting in Vienna, and the markets will be keeping a close eye on oil prices. On Friday, heads of states from the G-7 nations meet in Sicily. As well, the US will release revised GDP for the first quarter, which is expected at 0.9%, compared to the initial GDP release, which came in at 0.7%.
Fresh after his decisive election win, French President Emmanuel Macron has set his sights on a strong showing in parliamentary elections in June. Macron appears to be well on his way, as a recent poll for Sud Radio found that Macron's center party would win a third of the seats in the first round of the vote, ahead of all other parties. Macron is keen to deepen relations with Germany, which is France's largest trading partner, with 16% of French exports going to Germany. The closeness of Franco-German relations was highlighted by Macron's visit to Berlin just days after winning the presidency. Macron should be able to work well with German chancellor Angela Merkel, both of whom are firm supporters in European integration. The EU is facing difficult challenges, notably Britain's departure from the club and Donald Trump's protectionist agenda.
There were no dramatic statements in the Federal Reserve minutes. Policymakers were careful in their message, saying that a rate hike was coming "soon". To disappointed markets, this sounded like a "definite maybe". Does that mean a move at the June policy meeting? The markets believe so, as Fed funds futures for a June hike remained at 78% after the minutes were released. At the same time, the Fed has given itself some wiggle room, and could opt to delay a hike until the second quarter if inflation or consumer indicators take an unexpected nosedive. The minutes stated that policymakers wanted to see additional evidence that the recent slowdown in the economy was temporary before raising rates. As for additional hikes in 2017, the markets remain skeptical. The odds for a September rate stand at just 37%. This pessimism is a result of a weak performance from the US economy in Q1, as well as doubts that President Trump, who is facing congressional investigations over his connections with the Russian government, will be able to pass his agenda of cutting taxes and government spending. Gone are the heady days at the end of 2016, when a red-hot US economy had analysts predicting four rate hikes in 2017. At the same time, a strong improvement in economic data could quickly change the cautious tone of the Fed and revive discussion of four rate hikes this year.
Technical Outlook: AUDUSD Third Consecutive Upside Rejection
The Aussie dollar fell again on Thursday after the third consecutive upside rejection, as recovery rally from 0.7328 (09 May low) shows signs of fatigue, following repeated failures to sustain break above 0.7500 barrier, where weekly cloud top, reinforced by weekly Kijun-sen capped rallies. Additional pressure is building on reversal of slow stochastic from overbought zone border. Wednesday's low at 0.7742 (also Fibo 38.2% of 0.7328/0.7517 upleg) marks lower trigger, break of which is expected to spark stronger correction which may extend towards next Fibo supports at 0.7423 and 0.7400 (50% and 61.8% retracement respectively) Break below 0.7400, which is also the base of 4-hr cloud is needed to confirm reversal and lower top at 0.7517. Expect prolonged consolidation phase while the pair holds between 0.7442 and 0.7517 congestion.
Res: 0.7500; 0.7517; 0.7530; 0.7555
Sup: 0.7460; 0.7442; 0.7423; 0.7400
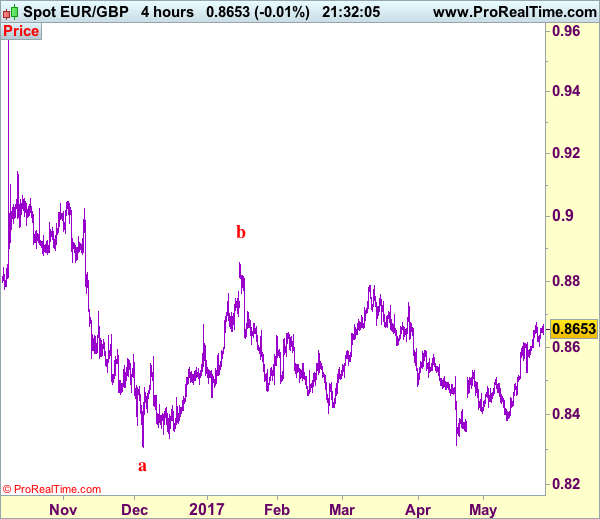
Trade Idea: EUR/GBP – Buy at 0.8575
EUR/GBP - 0.8651
Recent wave: Major double three (A)-(B)-(C)-(X)-(A)-(B)-(C) is unfolding and 2nd (A) has possibly ended at 0.6936.
Trend: Near term up
Original strategy :
Buy at 0.8575, Target: 0.8675, Stop: 0.8535
Position : -
Target : -
Stop : -
New strategy :
Buy at 0.8575, Target: 0.8675, Stop: 0.8535
Position : -
Target : -
Stop : -
Although the single currency rebounded after finding support at 0.8603 yesterday, break of this week’s high at 0.8675 is needed to confirm the erratic rise from 0.8312 low has resumed and extend gain to 0.8700, having said that, loss of upward momentum should prevent sharp move beyond resistance at 0.8735, risk from there is seen for a retreat later. If said resistance at 0.8675 continues to hold, then further consolidation would take place and risk of another retreat to 0.8600-05 cannot be ruled out but reckon downside would be limited to 0.8570-75 and bring another rise later.
In view of this, would not chase this rise here and would be prudent to buy euro again on pullback as 0.8575-85 should limit downside. Below 0.8550 would defer and suggest top is possibly formed, bring subsequent test of said support at 0.8524, once this level is penetrated, this would provide confirmation.
Our preferred count is that, after forming a major top at 0.9805 (wave V), (A)-(B)-(C) correction is unfolding with (A) leg ended at 0.8400 (A: 0.8637, B: 0.9491 and 5-waver C ended at 0.8400. Wave (B) has ended at 0.9413 and impulsive wave (C) has either ended at 0.8067 or may extend one more fall to 0.8000 before prospect of another rally. Current breach of indicated resistance at 0.9043 confirms our view that the (C) leg has ended and bring stronger rebound towards 0.9150/54, then towards 0.9240/50.
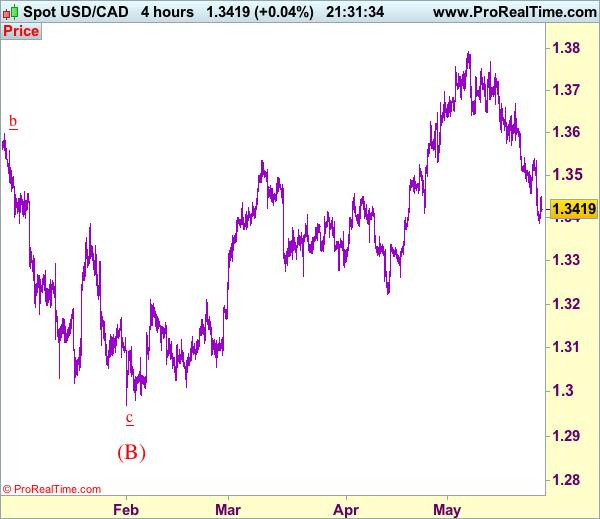
Trade Idea: USD/CAD – Sell at 1.3540
USD/CAD - 1.3415
Recent wave: Only wave v of c has ended at 0.9407 and wave C of major A-B-C correction is underway for headway to 1.4700
Trend: Near term up
New strategy :
Sell at 1.3540, Target: 1.3340, Stop: 1.3600
Position: -
Target: -
Stop:-
As the greenback has fallen again after brief recovery to 1.3540 yesterday, suggesting the decline from 1.3792 top is still in progress and bearishness remains for further weakness to 1.3350, then towards 1.3300, however, loss of near term downward momentum should prevent sharp fall below 1.3250-60, risk from there has increased for a rebound to take place later.
In view of this, would not chase this fall here and we are looking to sell on recovery as 1.3530-40 should limit upside, bring another decline. Above 1.3600 would abort and suggest low is possibly formed, risk test of resistance at 1.3670, break there would add credence to this view, bring further gain to 1.3700 first.
To recap, wave B from 1.3066 is unfolding as an a-b-c and is sub-divided as a: 1.2192, b: 1.2716 and wave c is a 5-waver with i: 1.1983, ii: 1.2506, extended wave iii with minor iii at 1.0206, wave iv ended at 1.0781 and wave v as well as wave iii has ended at 0.9931, hence the subsequent choppy trading is the wave iv which is unfolding as (a)-(b)-(c) with (a) leg of iv ended at 1.0854, followed by (b) leg at 1.0108 and (c) leg as well as the wave iv ended at 1.0674. The wave v is sub-divided by minor wave (i): 0.9980, (ii): 1.0374, (iii): 0.9446, (iv): 0.9913 and (v) as well as v has possibly ended at 0.9407, therefore, consolidation with upside bias is seen for major correction, indicated target at 1.3700 and 1.4000 had been met and further gain to 1.4700 would be seen later.
DAX Subdued on German Holiday
The DAX index continues to have a quiet week. The lack of movement continues on Thursday, with no German or eurozone indicators on the schedule. German banks are closed for Ascension Day, so we can expect an uneventful day from the stock markets. Currently, the DAX is trading at 12,613.75 points. The markets will be keeping a close eye on OPEC, as members are holding a meeting in Vienna. If there are any dramatic announces from the summit, fluctuations in oil prices could have a strong effect on global stock markets. On Friday, heads of state from the G-7 nations meet in Sicily. The US will release revised GDP for the first quarter, which is expected at 0.9%, compared to the initial GDP release, which came in at 0.7%.
German business confidence hit a record high in May. The Ifo Business Climate Index improved to 114.6, its highest level since Germany was reunified in 1991. The election of Emmanuel Macron as the French president has boosted business confidence, as the German corporate sector is optimistic that Berlin and Paris can work together to improve the eurozone economy. France is Germany's second largest trading partner and Macron underscored the importance he attaches to Franco-Germans relation when he visited German chancellor Angela Merkel within days of winning the presidency. The Brexit vote and Donald Trump's "America first" agenda present serious challenges to the EU, and Merkel and Macron will have no problem seeing eye-to-eye in their desire to deepen European integration.
The ECB released its Financial Stability Review on Wednesday, and the report found that financial stress in the euro-area remained at low levels, as there is growing optimism about economic conditions in the eurozone. The review found that there financial market and bank stress indicators remained contained, but noted that "sovereign stress" had risen in 2017, due to greater political uncertainty, such as the triggering of Article 50, whereby Britain gave official notice that it was withdrawing from the EU. Another concern highlighted by the review is that government finances in the eurozone "remain fragile", and an increase in interest rates could have a negative effect on the fiscal situation of weaker members, such as Italy and Portugal.
The Federal minutes were a disappointment, as the minutes conveyed a less hawkish tone than the markets had expected. Policymakers were careful in their message, saying that a rate hike was coming "soon". To disappointed markets, this sounded like a "definite maybe". Does that mean a move at the June policy meeting? The markets believe so, as Fed funds futures for a June hike remained at 78% after the minutes were released. At the same time, the Fed has given itself some wiggle room, and could opt to delay a hike until the second quarter if inflation or consumer indicators take an unexpected nosedive. The minutes stated that policymakers wanted to see additional evidence that the recent slowdown in the economy was temporary before raising rates. As for additional hikes in 2017, the markets remain skeptical. The odds for a September rate stand at just 37%. This pessimism is a result of a weak performance from the US economy in Q1, as well as doubts that President Trump, who is facing congressional investigations over his connections with the Russian government, will be able to pass his agenda of cutting taxes and government spending. Gone are the heady days at the end of 2016, when a red-hot US economy had analysts predicting four rate hikes in 2017. At the same time, a strong improvement in economic data could quickly change the cautious tone of the Fed and revive discussion of four rate hikes this year.
AUD/USD Respecting The Channel
The AUD/USD, popular Ozzie, is moving alongside upper EQ channel making zig zag bullish pattern. This bullish pattern is characterized by a slow grind towards D H3/H4 channel top and we might expect a possible continuation if the price doesn't make a 4h close below D L5/ W L3 0.7430. The POC zone is 0.7455-65 (ATR low, EQ channel bottom, D L4, EMA89). In the case that price goes below POC (without closing below 0.7430) a bullish spike into the channel itself will also be a bullish sign.