Sample Category Title
AUD/USD Respecting The Channel
The AUD/USD, popular Ozzie, is moving alongside upper EQ channel making zig zag bullish pattern. This bullish pattern is characterized by a slow grind towards D H3/H4 channel top and we might expect a possible continuation if the price doesn't make a 4h close below D L5/ W L3 0.7430. The POC zone is 0.7455-65 (ATR low, EQ channel bottom, D L4, EMA89). In the case that price goes below POC (without closing below 0.7430) a bullish spike into the channel itself will also be a bullish sign.
GOLD: Consolidates With Upside Bias
GOLD: The commodity closed higher the past week leaving risk higher. On the downside, support comes in at the 1,250.00 level where a break will turn attention to the 1,240.00 level. Further down, a cut through here will open the door for a move lower towards the 1,230.00 level. Below here if seen could trigger further downside pressure targeting the 1,220.00 level. Conversely, resistance resides at the 1,260.00 level where a break will aim at the 1,270.00 level. A turn above there will expose the 1,280.00 level. Further out, resistance stands at the 1,290.00 level. All in all, GOLD looks to strengthen further.
USD/JPY Mid-Day Outlook
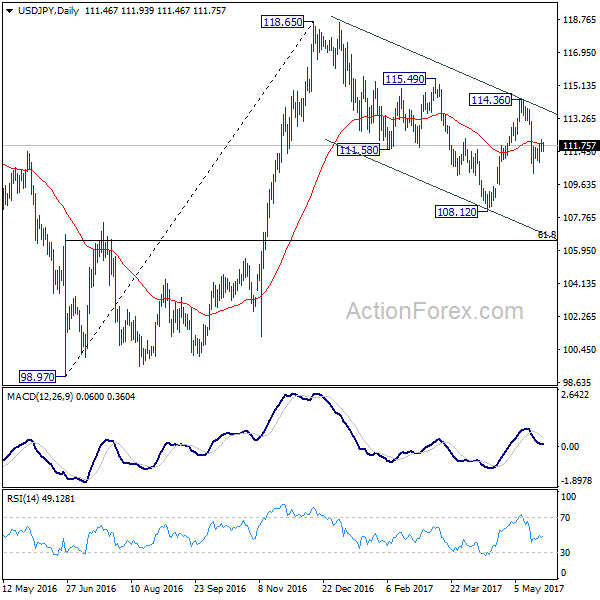
Daily Pivots: (S1) 111.26; (P) 111.69; (R1) 111.92; More...
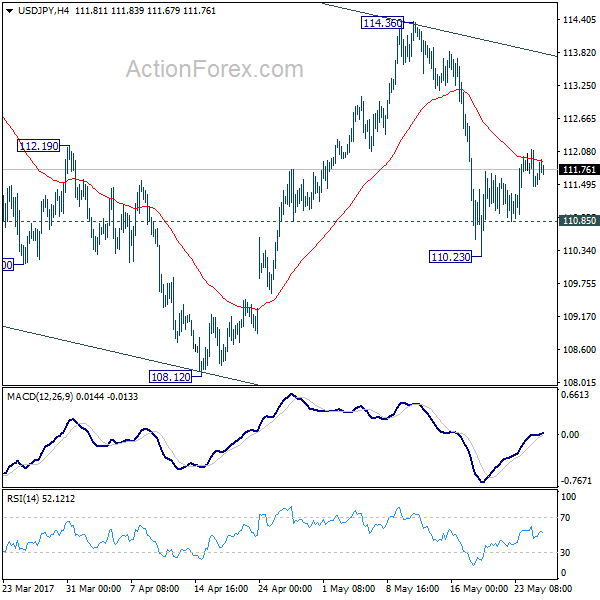
Intraday bias in USD/JPY remains neutral for the moment. The rebound from 110.23 is still seen as a correction even though it might extend. On the downside, below 110.85 minor support will turn bias to the downside to extend the fall from 114.36 to 108.12 low. Break there will resume the whole decline from 118.65. In that case, we'll look for bottoming signal again at 61.8% retracement of 98.97 to 118.65 at 106.48.
In the bigger picture, price actions from 125.85 high are seen as a corrective pattern. It's uncertain whether it's completed yet. But in case of another fall, downside should be contained by 61.8% retracement of 75.56 to 125.85 at 94.77 to bring rebound. Overall, rise from 75.56 is still expected to resume later after the correction from 125.85 completes.
USD/CHF Mid-Day Outlook
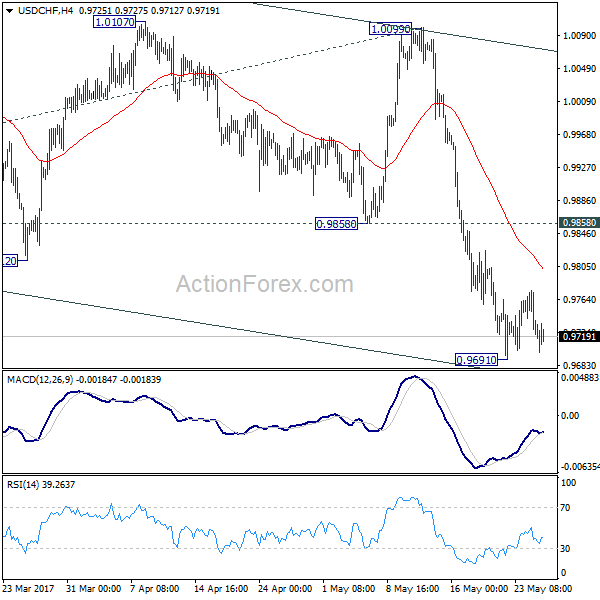
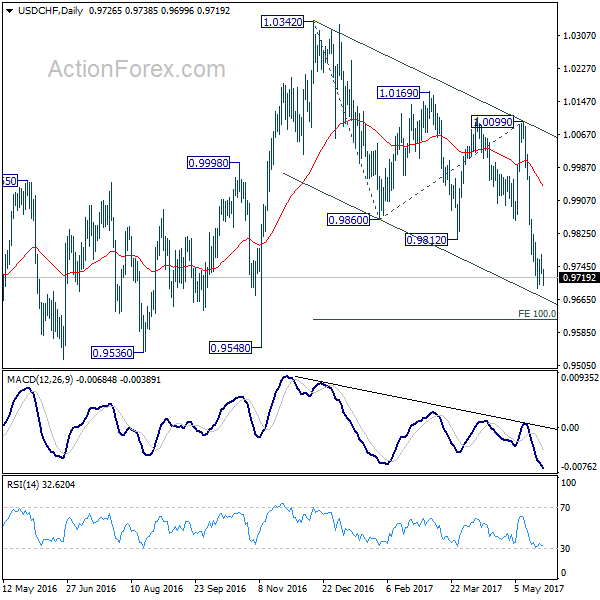
Daily Pivots: (S1) 0.9713; (P) 0.9745; (R1) 0.9761; More.....
USD/CHF's consolidation from 0.9691 temporary low is still in progress and intraday bias remains neutral. Another recovery cannot be ruled out. But upside should be limited by 0.9858 support turned resistance and bring fall resumption. Whole decline from 1.0342 is still in progress and below 0.9691 will target 100% projection of 1.0342 to 0.9860 from 1.0099 at 0.9617. We'll start to look for reversal signal below there.
In the bigger picture, USD/CHF is bounded in medium term range of 0.9443/1.0342 for the moment. Consolidative trading would likely continue and medium term outlook remains neutral. Break of 1.0342 key resistance is needed to confirm underlying bullish momentum in the pair. Meanwhile, downside attempts should be contained by 0.9443 key support level.
GBP/USD Mid-Day Outlook
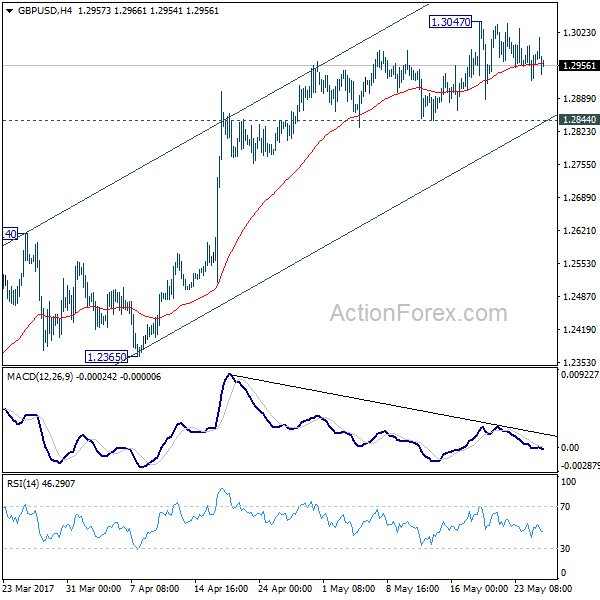
Daily Pivots: (S1) 1.2934; (P) 1.2967; (R1) 1.3007; More...
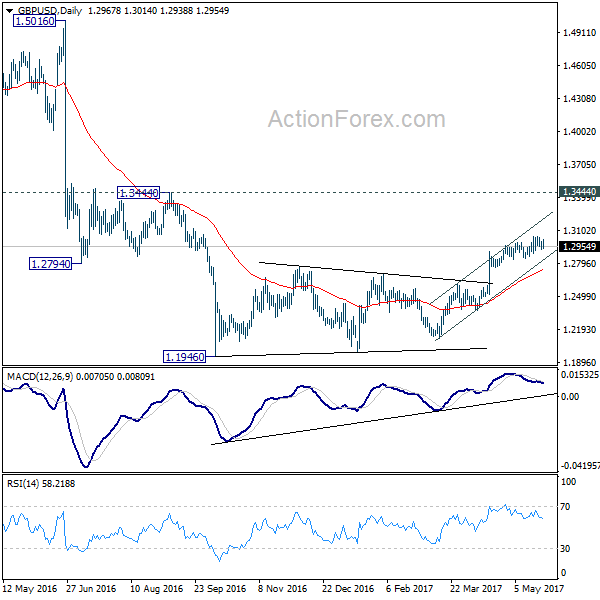
Intraday bias in GBP/USD remains neutral as consolidation from 1.3047 is still in progress. As long as 1.2844 minor support holds, further rise remains mildly in favor. Nonetheless, as we are still viewing price actions from 1.1946 as a corrective move, we'd expect upside to be limited below 1.3444 resistance to bring near term reversal. On the downside, break of 1.2844 will indicate short term topping and turn bias back to the downside for 1.2614 resistance turned support first.
In the bigger picture, fall from 1.7190 is seen as part of the down trend from 2.1161. There are signs of reversal, like breaking of 55 week EMA, weekly MACD turned positive, and monthly MACD crossed above signal line. But still, break of 1.3444 resistance is need to confirm medium term bottoming. Otherwise, outlook will remains bearish for extend the down trend through 1.1946 low.
EUR/USD Mid-Day Outlook
Daily Pivots: (S1) 1.1184; (P) 1.1202 (R1) 1.1235; More....
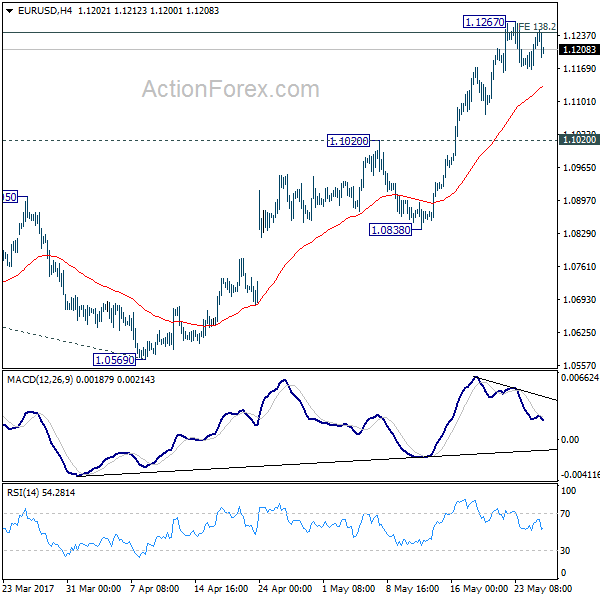
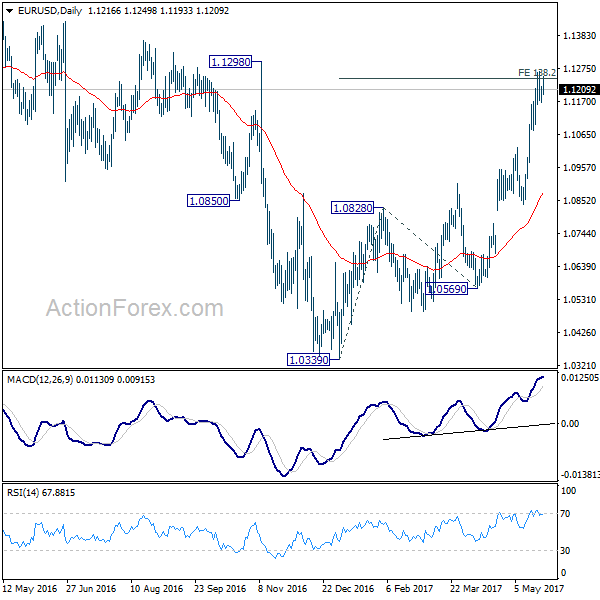
EUR/USD failed to take out 1.1267 with today's rebound and weakens again. The pair is staying in tight range below 1.1267 and intraday bias remains neutral first. Overall, we'd stay cautious on strong resistance from 1.1245/98 (138.2% projection of 1.0339 to 1.0828 from 1.0569 at 1.1245) resistance zone to limit upside and bring reversal. But decisive break of 1.1298 will carry larger bullish implication and target 1.1615 resistance next. On the downside, though, break of 1.1020 resistance turned support will indicate rejection from 1.1245/98 and turn bias to the downside for 1.0838 support first.
In the bigger picture, the case for medium term reversal continues to build up with EUR/USD now far above 55 week EMA. Also, bullish convergence condition is seen in weekly MACD. Focus will now be on 1.1298 key resistance. Rejection from there will maintain medium term bearishness and would extend the whole down trend from 1.6039 (2008 high). However, firm break of 1.1298 will indicate reversal. In such case, further rally would be seen back to 1.2042 support turned resistance next.
Dollar Recovers after Jobless Claims, Oil Pares Gains on Profit Taking
Dollar recovers in early US session after solid job data. Initial jobless claims rose 1k to 2.34k in the week ended May 20, below expectation of 238k. The four week moving averaged dropped to 235k, down from 241k. The average stands at the lowest level since 1973. Continuing claims rose 24k to 1.923m in the week ended May 13. Also from US, trade deficit widened to USD -68.0b in April. Wholesale inventories dropped -0.3% in April. Released earlier today, UK GDP growth was revised lower to 0.2% qoq in Q1, index of services rose 0.2% 3mo3m in March, BBA mortgage approvals dropped to 40.8k in April.
Markets disappointed with FOMC minutes
The market was somewhat disappointed over the FOMC minutes for the May meeting released yesterday. While the minutes should be considered as a confirmation of a rate hike in June, it raised the uncertainty over the future rate hike path. The members appeared divided over the inflation outlook. While one camp was concerned over the impact of falling unemployment on inflation, another camp remained focused on the downside risk to inflation. Meanwhile, it is getting more likely that the balance sheet reduction might begin 'this year'. More in Fed 'Confirmed' Rate Hike In June, Signaled Balance Sheet Reduction To Come Later This Year.
OPEC agreed on production cut extension
OPEC agreed to extend production cut for nine months through next March. Formal announcement will be made later today. Saudi Oil Minister Khalid Al-Falih said at the opening session of the group's meeting in Vienna that the decision is a "very safe and almost certain option to do the trick". And, production surplus will be "balanced earlier than later". Nigerian Oil Minister Emmanuel Kachikwu said the extension would bring price stability and suggests a "USD 50 floor" for oil. WTI oil dips back to 50.65 after hitting 52.0 earlier today as the news should be priced in.
EU Tusk: No common position with Trump on Russia, climate and trade
EU President Donald Tusk met US President Donald Trump today. After the meeting, Tusk said that they discussed topics on foreign policy, security, climate and trade relationship. Tusk noted that "we agreed on many areas, first and foremost on counter-terrorism". However, "some issues remain open like climate and trade". And, Tusk is "not 100% sure" he can say that Trump and himself have a common position, common opinion about Russia". Tusk emphasized values of freedom, human rights and dignity, and "the greatest task today is the consolidation of the whole free world around those values."
BoJ Sakurai: Crucial to patiently maintain easing
BoJ board member Makoto Sakurai said that "the economy is in good shape and the government's fiscal spending plans are being implemented now." Hence, "maintaining the current fiscal and monetary stimulus measures would be enough." Meanwhile, Sakurai also noted that "there were some views in the market that the BOJ would consider raising its long-term interest rate target in the near future." But he warned that "underlying price growth remains moderate and uncertainties on overseas economies persist." Therefore, "it is therefore crucial to patiently maintain our monetary easing." And for the moment, he believed that BoJ should keep the JPY 80T bond purchase target.
EUR/USD Mid-Day Outlook
Daily Pivots: (S1) 1.1184; (P) 1.1202 (R1) 1.1235; More....
EUR/USD failed to take out 1.1267 with today's rebound and weakens again. The pair is staying in tight range below 1.1267 and intraday bias remains neutral first. Overall, we'd stay cautious on strong resistance from 1.1245/98 (138.2% projection of 1.0339 to 1.0828 from 1.0569 at 1.1245) resistance zone to limit upside and bring reversal. But decisive break of 1.1298 will carry larger bullish implication and target 1.1615 resistance next. On the downside, though, break of 1.1020 resistance turned support will indicate rejection from 1.1245/98 and turn bias to the downside for 1.0838 support first.
In the bigger picture, the case for medium term reversal continues to build up with EUR/USD now far above 55 week EMA. Also, bullish convergence condition is seen in weekly MACD. Focus will now be on 1.1298 key resistance. Rejection from there will maintain medium term bearishness and would extend the whole down trend from 1.6039 (2008 high). However, firm break of 1.1298 will indicate reversal. In such case, further rally would be seen back to 1.2042 support turned resistance next.
Economic Indicators Update
| GMT | Ccy | Events | Actual | Forecast | Previous | Revised |
|---|---|---|---|---|---|---|
| 08:30 | GBP | BBA Mortgage Approvals Apr | 40.8K | 40.8K | 41.1K | |
| 08:30 | GBP | GDP Q/Q Q1 P | 0.20% | 0.30% | 0.30% | |
| 08:30 | GBP | Index of Services 3M/3M Mar | 0.20% | 0.30% | 0.50% | |
| 12:30 | USD | Advance Goods Trade Balance Apr | -68.0B | -64.6B | -64.8B | -65.0B |
| 12:30 | USD | Wholesale Inventories Apr P | -0.30% | 0.20% | 0.20% | 0.10% |
| 12:30 | USD | Initial Jobless Claims (20 MAY) | 234K | 238k | 232k | 233K |
| 14:30 | USD | Natural Gas Storage | 72B | 68B |
Trade Idea Update: USD/CHF – Hold long entered at 0.9700
USD/CHF - 0.9721
Original strategy :
Bought at 0.9700, Target: 0.9800, Stop: 0.9700
Position : - Long at 0.9700
Target : - 0.9800
Stop : - 0.9700
New strategy :
Hold long entered at 0.9700, Target: 0.9800, Stop: 0.9700
Position : - Long at 0.9700
Target : - 0.9800
Stop : - 0.9700
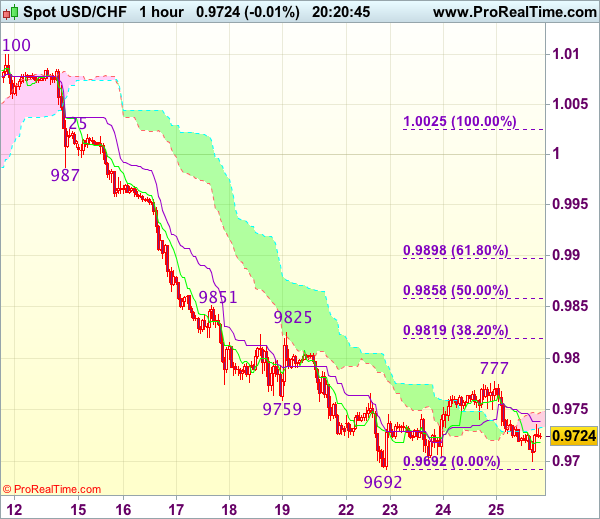
As the greenback has retreated after meeting resistance at 0.9777 yesterday, as long as support at 0.9692 holds, further consolidation would take place and prospect of another rebound remains, above said resistance at 0.9777 would add credence to our view that temporary low is formed, bring retracement of recent decline to 0.9800, then 0.9819-25 (38.2% Fibonacci retracement of 1.0025-0.9692 and previous resistance) but price should falter below resistance at 0.9851 (also just below 50% Fibonacci retracement at 0.9858), bring another decline later.
In view of this, we are holding on to our long position entered at 0.9700. Below said support at 0.9692 would signal recent decline has resumed and extend weakness to 0.9670-75 but reckon downside would be limited to 0.9650 and 0.9620-25 should hold, bring another rebound later.
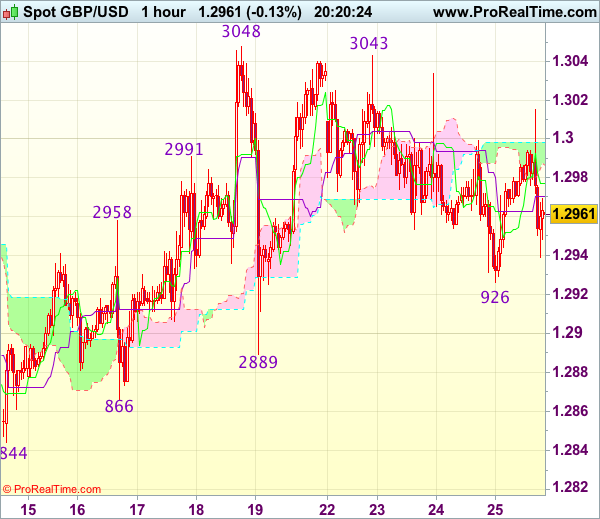
Trade Idea Update: GBP/USD – Hold long entered at 1.2960
GBP/USD - 1.2952
Original strategy :
Bought at 1.2960, Target: 1.3060, Stop: 1.2925
Position : - Long at 1.2960
Target : - 1.3060
Stop : - 1.2925
New strategy :
Hold long entered at 1.2960, Target: 1.3060, Stop: 1.2925
Position : - Long at 1.2960
Target : - 1.3060
Stop : - 1.2925
Failure to extend intra-day rebound and current retreat from 1.3015 suggest caution on our long position entered at 1.2960 but as long as yesterday’s low at 1.2926 holds, prospect of another rebound remains, above said intra-day high would bring test of strong resistance at 1.3043-48, however, break there is needed to confirm early upmove has resumed and extend headway to 1.3075-80 and possibly towards 1.3100-10 later.
In view of this, we are holding on to our long position entered at 1.2960. Below said support at 1.2926 would abort and risk weakness to 1.2900 but break of indicated support at 1.2889 is needed to signal top has been formed at 1.3048 earlier, bring retracement of recent upmove to 1.2850-55 first.
Trade Idea Update: EUR/USD – Stand aside
EUR/USD - 1.1207
New strategy :
Stand aside
Position : -
Target : -
Stop : -
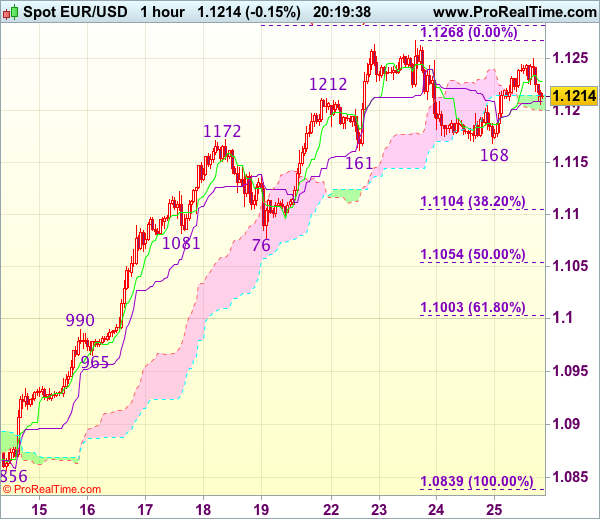
Although the single currency has rebounded after holding above previous support at 1.1161 and retest of this week’s high at 1.1268 cannot be ruled out, break there is needed to signal recent upmove has resumed and extend further gain to 1.1280-85 (61.8% projection of 1.0839-1.1172 measuring from 1.1076) and possibly towards 1.1300-10. If said resistance continues to hold, then further consolidation would take place.
On the downside, below 1.1195-00 would bring another corrective fall to 1.1161-68 support but break there is needed to signal top has been formed at 1.1268, bring retracement of recent upmove to 1.1130 but reckon downside would be limited to 1.1100-05 (38.2% Fibonacci retracement of 1.0839-1.1268) and price should stay well above support at 1.1076, bring rebound later.