
Sample Category Title
GBP/USD Analysis: Risks Ending Consolidation
'There is still scope for further upside in the near term. The long-term downtrend currently stands at approximately 1.35 and it is still possible that we could see that tested before the dollar begins to reassert itself.' – Charles Stanley (based on PoundSterlingLive)
Pair's Outlook
Even though the Cable failed to behave in accordance with expectations yesterday, the consolidation trend still remained intact. Overall, the situation did not change since Wednesday, as the Pound is still required to experience another leg down in order for the trend to continue its existence. The same supports and resistance are in play and technical indicators keep suggesting the GBP/USD pair is to appreciate, meaning that a bullish development is also more than possible, which would, this time, fully break the consolidation trend. However, solid gains beyond 1.3030 are also doubtful due to the absence of a strong market mover.
Traders' Sentiment
There are 52% of traders being short the Sterling against the US Dollar today, while the portion of buy orders inched down from 56 to 52% in the last 24 hours.
USD/JPY Analysis: Stuck Between 110.50 And 112.00
'The rise in Treasury yields is supporting the dollar. It appears that speculative buying of Treasuries has run its course, with Trump concerns and geopolitical risks no longer fresh news.' – Daiwa Securities (based on Reuters)
Pair's Outlook
The US Dollar weakened against the Yen on Wednesday, but managed to avoid serious losses by closing at 111.50. However, further bullish potential is now under question, as the 55-day SMA and the weekly pivot point are once again acting as an immediate supply area. A drop back under 111.00 is always possible, due to lack of supports around that area, leaving the monthly PP at 110.48 as the only possible turnaround point unless losses exceed 150 pips. Technical indicators are unable to confirm the possibility of either the negative or the positive outcome, thus, we should not rule out the chance of another leg up and the potential retake of the 112.00 mark.
Traders' Sentiment
Traders' sentiment remains bearish, with 57% of all open positions being short. Meanwhile, 52% of all pending orders are to buy the Buck.
Gold Analysis: Remains Below 1,260 Level
'I do not think the market's view for two more rate hikes has changed following the release of the Fed meeting minutes.' – Helen Lau, Argonaut Securities (based on Reuters)
Pair's Outlook
As the FOMC Meeting Minutes did not change the opinion of the market participants in regards to US rate hikes this year, the bullion began to regain previously lost ground. However, somewhere around midnight the situation has slightly changed. During the early hours of Thursday's trading session the commodity price had slightly declined, as it must have encountered a smaller timeframe chart's resistance, which keeps the metal form jumping. However, it is most likely that the surge will resume and the 1,270 mark will be reached.
Traders' Sentiment
SWFX traders remain almost neutral, as 51% of open positions are short. However, 68% of trader set up orders are to buy.
EUR/GBP Candlesticks and Ichimoku Analysis
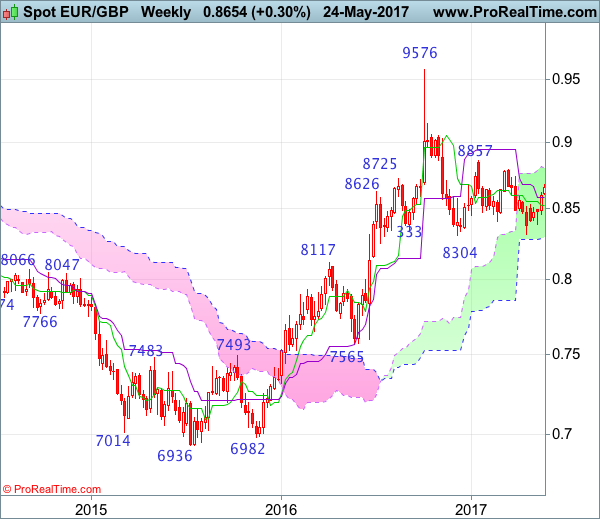
Weekly
• Last Candlesticks pattern: N/A
• ime of formation: N/A
• Trend bias: Near term up
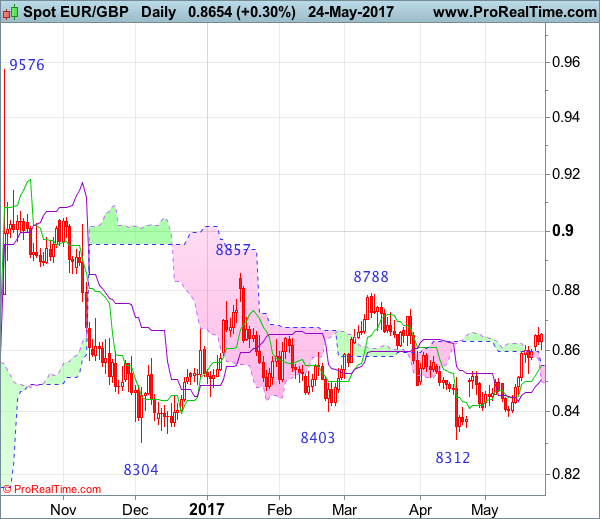
Daily
• Last Candlesticks pattern: Hammer
• Time of formation: 3 Feb 2016
• Trend bias: Up
EURGBP – 0.8583
The single currency only retreated to 0.8524 (just missed our long entry at 0.8520) before finding renewed buying interest there and the subsequent rally adds credence to our view that the rise from 0.8312 low is still in progress, hence bullishness remains for this move to extend gain to 0.8735 resistance, however, break there is needed to confirm early fall from 0.8788 has ended at 0.8312, bring retest of this level which is likely to hold on first testing due to near term overbought condition, bring retreat later.
On the downside, whilst initial pullback to 0.8600-05 cannot be ruled out, reckon the Tenkan-Sen (now at 0.8566) would limit downside and bring another rise later to aforesaid upside targets. Below said support at 0.8524 would risk test of the Kijun-Sen (now at 0.8513) but only a daily close below there would signal top is formed, bring further fall towards support at 0.8457. Looking ahead, a drop below this level would signal the rise from 0.8312 has ended, bring subsequent decline to 0.8400-10 and then test of indicated support at 0.8384.
Recommendation: Buy again at 0.8580 for 0.8730 with stop below 0.8500.
On the weekly chart, as the single currency has maintained a firm undertone after recent rally above previous resistance at 0.8531, retaining our bullish view for the rebound from 0.8312 to bring further gain to 0.8700-10, however, as broad outlook remains consolidative, reckon upside would be limited to 0.8750 and 0.8788 resistance should remain intact, bring retreat later. A break of 0.8788 would bring test of previous chart resistance at 0.8857 but only a weekly close above there would signal an upside break of early established broad range has occurred.
On the downside, although initial pullback to 0.8600-05 cannot be ruled out, reckon the Kijun-Sen (now at 0.8581) would limit downside and bring another rise later. A weekly close below the Tenkan-Sen (now at 0.8524) would defer and suggest top is possibly formed, risk weakness to 0.8495-00 but a drop below last week’s low at 0.8457 is needed to add credence to this view, bring further fall to 0.8400-10, however, only a break of said support at 0.8384 would suggest the rebound from 0.8312 has ended instead, extend weakness to 0.8350-55 and eventually retest of 0.8312.
Forex Technical Analysis: EUR/USD, USD/JPY, GBP/USD
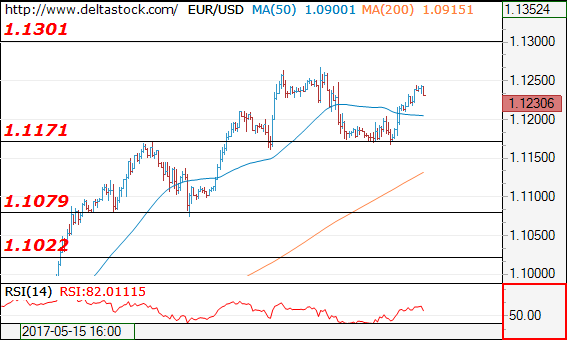
EUR/USD
Current level - 1.1230
The overall outlook remains bearish below 1.1300 hurdle, for a corrective pullback towards 1.1020 zone. Crucial on the downside is 1.1160.
| Resistance | Support | ||
| intraday | intraweek | intraday | intraweek |
| 1.1300 | 1.1300 | 1.1160 | 1.1022 |
| 1.1300 | 1.1300 | 1.1080 | 1.0838 |
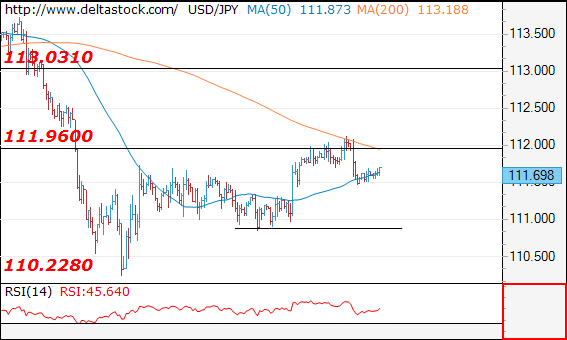
USD/JPY
Current level - 111.69
The bias is positive above 111.30 minor support, for a rise towards 113.00 area. Crucial on the downside is 110.85.
| Resistance | Support | ||
| intraday | intraweek | intraday | intraweek |
| 111.90 | 114.30 | 111.30 | 109.40 |
| 113.00 | 115.60 | 110.80 | 108.12 |
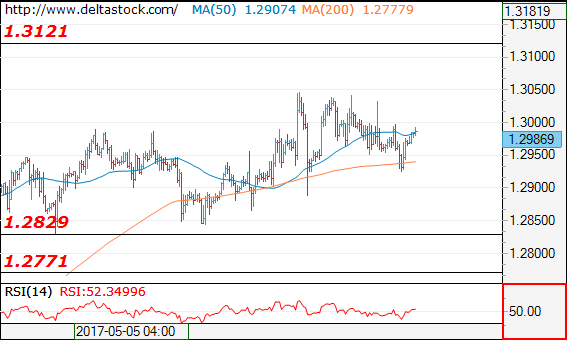
GBP/USD
Current level - 1.2986
break through the latter will challenge 1.3120.
| Resistance | Support | ||
| intraday | intraweek | intraday | intraweek |
| 1.3050 | 1.3120 | 1.2900 | 1.2770 |
| 1.3120 | 1.3500 | 1.2830 | 1.2610 |
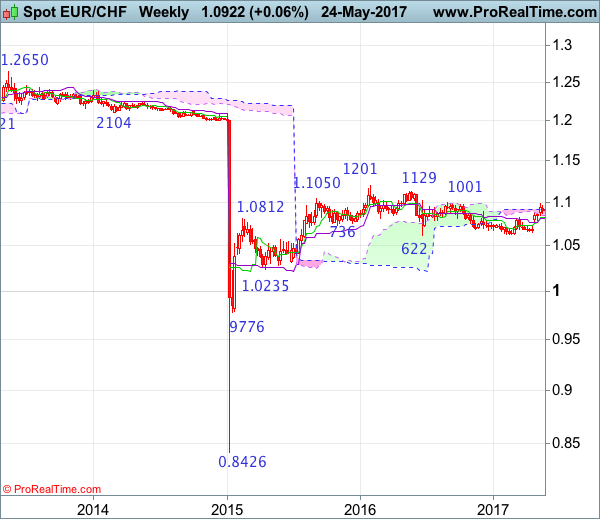
EUR/CHF Candlesticks and Ichimoku Analysis
Weekly
• Last Candlesticks pattern: Doji
• Time of formation: 20 Feb 2017
• Trend bias: Up
Daily
• Last Candlesticks pattern: Doji
• Time of formation: 1 Sep 2016
• Trend bias: Near term down
EUR/CHF – 1.0973
The single currency did find renewed buying interest at 1.0865 last week and staged the anticipated rebound, however, as the pair met resistance at 1.0949 earlier this week and has retreated, suggesting further consolidation would be seen but said support at 1.0865 should limit downside and bring another rise later, above 1.0949 would signal the pullback from 1.0988 has ended, bring test of 1.0960, break there would suggest upmove has resumed for retest of 1.0988, then towards previous resistance at 1.1001. Looking ahead, only a break there would retain bullishness and encourage for headway to 1.1050-60, then 1.1100, having said that, price should falter below another previous resistance at 1.1201.
On the downside, expect pullback to be limited to 1.0900 and said support at 1.0865 should hold, bring another rise later to aforesaid upside targets. Below 1.0845-50 would defer and suggest top is possibly formed at 1.0988, bring test of support at 1.0792 which is likely to limit downside, bring rebound later. A daily close below this support at 1.0792 would abort and signal top is formed, bring subsequent fall to the upper Kumo (now at 1.0726) but support at 1.0671 should remain intact, the single currency shall stage another rebound from there.
Recommendation: Hold long entered at at 1.0865 for 1.1065 with stop below 1.0765.
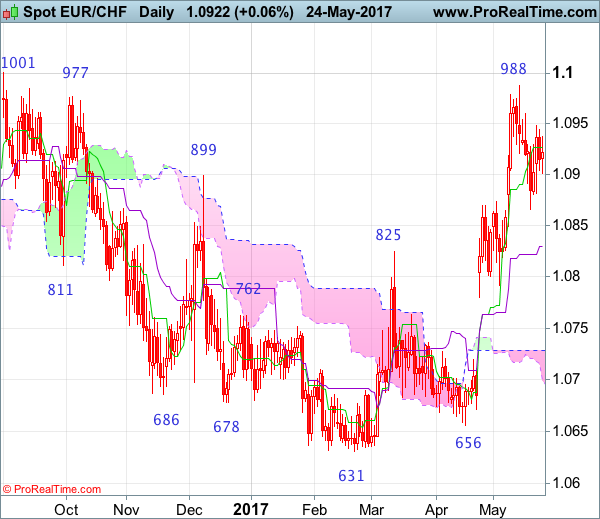
On the weekly chart, although euro rebounded from 1.0865 to 1.0949 last week, the subsequent retreat after faltering below last week’s high at 1.0960, suggesting minor consolidation would take place, however, reckon said support at 1.0865 would limit downside and bring another rise later, above 1.0960 would signal pullback from 1.0988 has ended, bring retest of this level, break there would extend recent upmove from 1.0631 to previous resistance at 1.1001, a sustained breach above this level would signal the fall from 1.1201 has ended, bring further gain to 1.1100 and possibly test of resistance at 1.1129 but price should falter below said recent high at 1.1201, bring retreat later.
On the downside, expect pullback to be limited to 1.0880-82 and said support at 1.0865 should hold, bring another rise. Below the lower Kumo (now at 1.0848) would risk test of the Tenkan-Sen (now at 1.0822) but break of the Kijun-Sen (now at 1.0810) is needed to suggest top is possibly formed, bring further fall to 1.0792 support, once this level is penetrated, this would add credence to this view, bring subsequent weakness towards 1.0725-30 but support at 1.0656 should remain intact, bring another rally next month.
Technical Outlook: Sterling Supported After Cautiouos FOMC, Eyes UK GDP Data
Cable stood on the front foot in Asia on Thursday and extended recovery from Wednesday's low at 1.2926, hitting session highs near 1.3000 barrier.
Sterling was supported by rather dovish tone from Wednesday's FOMC minutes that kept the greenback in defensive. Despite strong expectations for firmer signals about rate hike in June, Fed showed more cautious approach, although supporting gradual rate hikes, but looking for more evidence that recent economic slowdown was temporary.
Overall, the dollar may stay under pressure which was initiated by recent political turmoil in the US and softer than expected tone from Fed.
Sterling is showing signs of recovery after correction from repeated rejections above 1.3000 barrier found footstep above strong supports and first triggers at 1.2954/38, provided by rising 10/20SMA's that started to diverge.
Bullish setup of studies on daily chart is supportive but the price is still struggling to clearly penetrate thick weekly cloud that acts as strong barrier and weighs on near-term action.
However, pound is still showing negative impact from Manchester terrorist attack on Monday that may, along with politics in pre-election period, extend hesitation of broader recovery phase from 1.1950 zone.
Today's focus turns on UK Q1GDP and Business investment data which may provide fresh signals.
Forecasts for GDP are unchanged (0.3% q/q and 2.1% y/y) while Business investment is expected to rise by 0.2% in Q1, compared to -0.9% in Q4 2016.
The pair needs firm break through either of 1.2900/1.3000 boundaries for firmer direction signal.
Res: 1.3000, 1.3033, 1.3046, 1.3087
Sup: 1.2964, 1.2955, 1.2938, 1.2901
Technical Outlook: EURUSD Is Bullishly Aligned After Fed, Eyes 1.1268 Pivot For Further Upside
The Euro extended post-Fed recovery on Thursday and bounced to 1.1250 zone, after correction from fresh high at 1.1268 was contained by 4-hr Kijun-sen at 1.1167. Dovish tone from Fed kept the dollar pressured that boosted the single currency, offsetting so far negative signals on overbought daily studies and bearish outside day on Tuesday. Lack of economic indicators from the Eurozone today suggests that the pair will be depending on US data and technicals. Break above multi month high at 1.1268 is needed to signal fresh upside, with such scenario being favored as the dollar stands at the back foot. Hhowever, extension above 1.1299 (09 Nov post-US election high) is needed to confirm bullish resumption. Initial support lies at 1.1210 (session low, followed by 1.1167 (correction low / Fibo 23.6% of 1.0839/1.1268 upleg) and rising 10SMA at 1.1133. Reversal of slow stochastic from strongly overbought zone requires caution as fresh weakness below 1.1167/33 pivots would signal stronger pullback.
Res: 1.1268, 1.1299, 1.1322, 1.1370
Sup: 1.1210, 1.1167, 1.1133, 1.1104
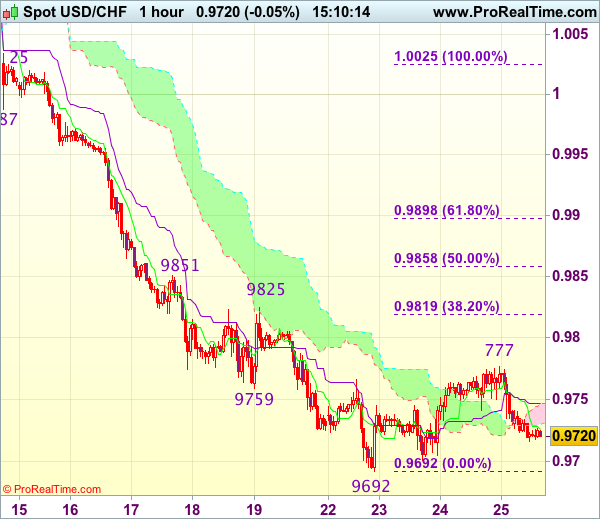
Trade Idea : USD/CHF – Hold long entered at 0.9700
USD/CHF - 0.9717
Most recent candlesticks pattern : N/A
Trend : Near term down
Tenkan-Sen level : 0.9724
Kijun-Sen level : 0.9745
Ichimoku cloud top : 0.9747
Ichimoku cloud bottom : 0.9730
Original strategy :
Bought at 0.9700, Target: 0.9800, Stop: 0.9700
Position : - Long at 0.9700
Target : - 0.9800
Stop : - 0.9700
New strategy :
Hold long entered at 0.9700, Target: 0.9800, Stop: 0.9700
Position : - Long at 0.9700
Target : - 0.9800
Stop : - 0.9700
As the greenback has retreated after meeting resistance at 0.9777 yesterday, as long as support at 0.9692 holds, further consolidation would take place and prospect of another rebound remains, above said resistance at 0.9777 would add credence to our view that temporary low is formed, bring retracement of recent decline to 0.9800, then 0.9819-25 (38.2% Fibonacci retracement of 1.0025-0.9692 and previous resistance) but price should falter below resistance at 0.9851 (also just below 50% Fibonacci retracement at 0.9858), bring another decline later.
In view of this, we are holding on to our long position entered at 0.9700. Below said support at 0.9692 would signal recent decline has resumed and extend weakness to 0.9670-75 but reckon downside would be limited to 0.9650 and 0.9620-25 should hold, bring another rebound later.
Market Update – Asian Session: New Zealand Budget Boosts Funding And Reduces Taxes For Families
Asia Mid-Session Market Update: BOK on hold with an upbeat view of economy; New Zealand budget boosts funding and reduces taxes for families
US Session Highlights
(US) FDIC Q1 Quarterly Banking Profile: US banks on problem list 112 v 123 q/q (9-year low)
(US) Mar FHFA House Price Index M/M: 0.6% v 0.5%e; Q/Q: 1.4% v 1.5% prior
(CA) BANK OF CANADA (BOC) LEAVES INTEREST RATES UNCHANGED AT 0.50%; AS EXPECTED; adjustment to lower oil prices largely over, CPI pressures appear to be temporary
(US) APR EXISTING HOME SALES: 5.57M V 5.65ME; low supply continues to push up prices
(US) DOE CRUDE: -4.4M V -2ME; GASOLINE: -0.8M V -1ME; DISTILLATE: -0.5M V -0.5ME
Equity markets continued to gain ground, taking the Fed minutes release in stride. The minutes sent oil and US dollar prices slightly lower, but that also failed to deter investors, as the S&P rose to close at a new all-time high at 2404.39. Best performing sectors for S&P were Materials, gaining 0.7%, and Real Estate & Utilities both rising 0.6%
US markets on close: Dow +0.4%, S&P500 +0.3%, Nasdaq +0.4%
Best Sector in S&P500: Materials
Worst Sector in S&P500: Telecom
Biggest gainers: INTU +6.7%; FSLR +6.7%; NRG +5.5%
Biggest losers: TIF -8.7%; SIG -6.6%; AAP -5.6%
At the close: VIX 10.0 (-0.7pts); Treasuries: 2-yr 1.29% (-3bps), 10-yr 2.27% (-2bps), 30-yr 2.94% (-1bps)
US movers afterhours
AERI Reports positive Roclatan (netarsudil/latanoprost ophthalmic solution) 0.02%/0.005% Phase 3 Topline efficacy results; +27.5% afterhours
GES Reports Q1 -$0.24 v -$0.31e, R$458.6M v $447Me; Guides Q2 $0.08-0.11 v $0.15e, Rev +2-4% (+3.5-5.5% cc), op margin 2.2-3.0%; +16.7% afterhours
PSTG Reports Q1 -$0.14 v -$0.23e, R$182.6M v $178Me; Guides Q2 R$214-222M v $217Me; Gross margin 63.5-66.5%; Operating margin -16% to -12%; +11.5% afterhours
WSM Reports Q1 $0.51 v $0.48e, R$1.11B v $1.11Be- Guides Q2 $0.55-0.61 v $0.59e, R$1.20-1.23B v $1.19Be, comparable brand rev 2% to 5%; +9.4% afterhours
PVH Reports Q1 $1.65 v $1.61e, R$1.99B v $1.96Be; Raises FY17 $7.40-7.50 v $7.41e; +3.6% afterhours
HPQ Reports Q2 $0.40 v $0.39e, R$12.4B v $11.9B; +3.0% afterhours
Key economic data
(KR) BANK OF KOREA (BOK) LEAVES REPO RATE UNCHANGED AT 1.25%; AS EXPECTED
(SG) SINGAPORE Q1 FINAL GDP Q/Q: -1.3% V -0.9%E; Y/Y: 2.7% V 2.7%E
Asia Session Notable Observations, Speakers and Press
Asian equity markets are notably higher, tracking 5th straight session of gains on Wall St where cash indices have now erased all of last Wednesday's steep declines. US markets ended on the highs, as investors took note of increased caution about lower inflation data in the latest Fed minutes, and while the case for June rate hike remained above 80% (prior 83%), Fed funds probability of 2 more rate hikes this year slid below 50%. USD was also slightly lower in the wake of Minutes release and then consolidated against the majors and fell against EM currencies in the Asia session - USD/JPY fell some 50pips below 111.50, AUD/USD rose 40pips to 0.75, and NZD/USD rose 30pips to 0.7050.
Korea's Kospi was the best performing regional index, hitting record high above 2,340. Bank of Korea left rates on hold in a unanimous decision, but signalled a bullish view, stating growth was now seen above the April forecast as household debt increase subsided. BOK Gov Lee also said monetary policy would remain accommodative as inflation stabilizes around 2%.
New Zealand budget saw Fin Min unveil Family Incomes Package through more spending and lower taxes designed to help lower-middle income families burdened by rising rent prices in urban areas. On the spending side, outlays will average NZ$1.8B per year over forecast period vs NZ$1.5B prior forecast. New Zealand also forecast GDP to pick up slightly this year, supported by migration inflows, investment and a recovery in export, and then reach a peak in 2019 as Family Incomes Package provisions are felt in consumption.
In other economic data, Singapore Q1 final GDP was in line y/y and slightly worse than expected sequentially, though MAS kept 2017 GDP target of 1-3% with a view the actual figure will be above the midpoint. Singapore MAS economist also noted the assessment of GDP growth and CPI inflation is essentially unchanged from the April statement.
Among key corporates, Lenovo rose over 5% in the afternoon session following Q4 results. Net profit of $107M beat consensus $98Me and gross margins also topped forecasts, even as the company noted constraints in supply chain and higher component prices as key challenges in the industry.
China
(CN) US Navy destroyer conducted navigation operation in the South China Sea, within 12 nautical miles of Mischief Reef, which is claimed by China – financial press
(CN) China said to raise gasoline prices by CNY140/ton and diesel by CNY135/ton; effective tomorrow - press
(CN) China Banking Association economist Ba Shusong: Need more efforts to reduce leverage
(CN) China Commerce Ministry (MOFCOM): Will continue to relax foreign investment rules for auto industry - press
(CN) China said to consider expanding energy imports from US - press
(CN) China Securities Regulatory Commission (CSRC): Considering allowing foreign investors into futures market; Will not allow innovation in futures to bupass regulation - press
Japan
(JP) BOJ's Deputy Gov Iwata: BOJ Rev from holdings bonds could rise at exit - speaking at parliament
(JP) Bank of Japan (BOJ) Sakurai: Given moderate inflation, uncertainty over overseas economies it is crucial to maintain monetary easing
Australia/New Zealand
(AU) Moody's: Australia auto ABS delinquencies rose in Q1 - press
(NZ) New Zealand press speculates today's budget will be a "catch-up affair", shifting income tax threshold that will benefit lower and middle-income earners
Korea
(KR) South Korea to set up a strategic command to effectively respond to North Korea’s nuclear and missiles threats - Korean press
(KR) South Korea National Pension Fund: To raise overseas investment allocation to 40% by 2022 v 27% in 2016
Asian Equity Indices/Futures (01:00ET)
Nikkei +0.4%, Hang Seng +0.6%, Shanghai Composite +0.4%, ASX200 +0.2%, Kospi +0.9%
Equity Futures: S&P500 +0.3%; Nasdaq +0.3%, Dax +0.2%, FTSE100 +0.1%
FX ranges/Commodities/Fixed Income (01:00ET)
EUR 1.1210-1.1245; JPY 111.50-111.70; AUD 0.7490-0.7515; NZD 0.7030-0.7050
June Gold +0.5% at 1,259/oz; July Crude Oil +0.8% at $51.76/brl; July Copper -0.3% at $2.58/lb
iShares Silver Trust ETF daily holdings fall to 10,635 tonnes from 10,693 tonnes prior; first decline since May 3rd
(CN) China Apr Swift Global Payments (CNY): 1.6% v 1.8% prior (yuan share lowest level since 2014)
(CN) PBOC SETS YUAN MID POINT AT 6.8695 V 6.8758 PRIOR
(CN) PBOC to inject combined CNY70B v CNY90B prior
(JP) Japan MoF sells ¥500B in 0.9% (0.4% prior) 40-year JGB bonds, bid to cover: 2.87x v 2.95x prior
Asia equities notable movers
Australia
Annsell (ANN) +4.0%; Sells sexual wellness business for $600M
Aristocrat Leisure (ALL) +3.7%; Reports H1
Mesoblast (MSB) -4.8%; Reports Q3
Hong Kong
Lenovo (992) +5.5%; Reports Q4
CSPC (1093) +2.3%; Reports Q1
China Railway (1186) +0.9%; Nigeria contract