
Sample Category Title
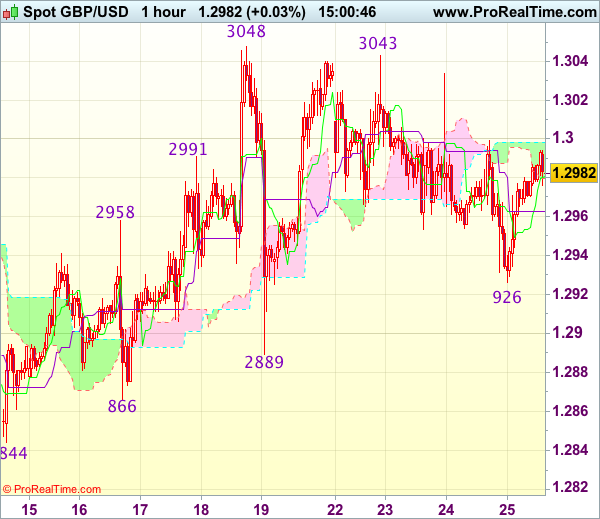
Trade Idea : GBP/USD – Buy at 1.2960
GBP/USD - 1.2990
Most recent candlesticks pattern : N/A
Trend : Near term up
Tenkan-Sen level : 1.2961
Kijun-Sen level : 1.2963
Ichimoku cloud top : 1.2998
Ichimoku cloud bottom : 1.2980
New strategy :
Buy at 1.2960, Target: 1.3060, Stop: 1.2925
Position : -
Target : -
Stop : -
As cable found good support at 1.2926 yesterday and has staged a rebound, suggesting the retreat from 1.3043 has ended there and consolidation with upside bias is seen for gain towards resistance at 1.3043-48, however, break there is needed to confirm early upmove has resumed and extend headway to 1.3075-80 and possibly towards 1.3100-10 later.
In view of this, we are looking to buy cable on dips. Below said support at 1.2926 would abort and risk weakness to 1.2900 but break of indicated support at 1.2889 is needed to signal top has been formed at 1.3048 earlier, bring retracement of recent upmove to 1.2850-55 first.
Dollar Slips On Fed Minutes. Oil Look To OPEC Meeting Today
The US dollar closed on a bearish note yesterday after the FOMC meeting minutes failed to support the greenback. The Fed minutes showed that members supported the view to tighten monetary policy and felt that it was appropriate to cut back on the Fed's $4.5 trillion securities holdings this year.
FOMC officials also expressed concerns on the weak patch of numbers in the first quarter as the US GDP slowed. The weaker US dollar sent gold and euro making up for the declines from earlier this week.
The euro managed to hold on to the gains although ECB officials speaking at various events said that there wouldn't be any shift in the ECB's monetary policies despite mounting pressure. ECB officials who spoke included the president, Mario Draghi, and other members including Vitor Constancio and Peter Praet.
Looking ahead, the economic data today will focus on the UK's second estimates for the first quarter GDP which is expected to show no changes, confirming that growth expanded at a pace of 0.3% on the quarter.
OPEC leaders will be holding their meeting in Vienna today with a focus on an extension to the production cuts that was agreed upon in last November.
EURUSD intraday analysis
EURUSD (1.1238): The EURUSD managed to reclaim the $1.1200 handle after briefly slipping below the level. Price action is currently bullish as the common currency is seen testing this week's 6-month highs that were posted earlier in the week. Price action remains neutral for the moment, with price gains coming on a break out above 1.1262, while a failure to push higher could potentially keep the downside bias intact towards 1.1100 support level. A break down below 1.1100 will trigger further downside in price.
GBPUSD intraday analysis
GBPUSD (1.2983): GBPUSD continues to stay flat near 1.3000 with price action caught within the tight range established from last Thursday. A breakout from the highs or lows at 1.3047 or 1.2888 will trigger further continuation in price. The overall bias remains to the downside, however, for a test towards 1.2800, where support needs to be more firmly tested. For the near term, the price is likely to continue to push higher and test 1.3000 resistance, following which we could expect to see some downside in the British pound.
EURCAD intraday analysis
EURCAD (1.5056): The EURCAD closed bearish yesterday following the minor consolidation that was formed at 1.5147 and 1.5102. The breakout from the rising wedge pattern signals a continuation to the downside, although EURCAD is looking to test the breakout level. Yesterday, the Bank of Canada (BoC) left interest rates unchanged with some viewing the BoC's statement as being neutral despite positive developments in the economy. However, the BoC's statement was quite upbeat compared to the previous meeting.
Trade Idea : EUR/USD – Stand aside
EUR/USD - 1.1239
Most recent candlesticks pattern : N/A
Trend : Up
Tenkan-Sen level : 1.1231
Kijun-Sen level : 1.1207
Ichimoku cloud top : 1.1214
Ichimoku cloud bottom : 1.1202
New strategy :
Stand aside
Position : -
Target : -
Stop : -
Although the single currency has rebounded after holding above previous support at 1.1161 and retest of this week’s high at 1.1268 cannot be ruled out, break there is needed to signal recent upmove has resumed and extend further gain to 1.1280-85 (61.8% projection of 1.0839-1.1172 measuring from 1.1076) and possibly towards 1.1300-10. If said resistance continues to hold, then further consolidation would take place.
On the downside, below 1.1200 would bring another corrective fall to 1.1161-68 support but break there is needed to signal top has been formed at 1.1268, bring retracement of recent upmove to 1.1130 but reckon downside would be limited to 1.1100-05 (38.2% Fibonacci retracement of 1.0839-1.1268) and price should stay well above support at 1.1076, bring rebound later.

Trade Idea : USD/JPY – Hold long entered at 111.50
USD/JPY - 111.75
Most recent candlesticks pattern : N/A
Trend : Near term down
Tenkan-Sen level : 111.65
Kijun-Sen level : 111.81
Ichimoku cloud top : 111.68
Ichimoku cloud bottom : 111.45
Original strategy :
Bought at 111.50, Target: 112.50, Stop: 111.15
Position : - Long at 111.50
Target : - 112.50
Stop : - 111.15
New strategy :
Hold long entered at 111.50, Target: 112.50, Stop: 111.15
Position : - Long at 111.50
Target : - 112.50
Stop : - 111.15
Although the greenback retreated after meeting resistance at 112.13 yesterday, reckon the lower Kumo (now at 111.45) would limit downside and bring another rebound, above said resistance would extend the erratic rise from 110.24 low to 112.36 (100% projection of 110.4-11174 measuring from 110.86) and then 112.45-50 (61.8% Fibonacci retracement), however, reckon 112.75-80 would limit upside.
In view of this, we are holding on to our long position entered at 111.50. Below the lower Kumo (now at 111.45) would risk weakness to 111.25-30 but break of indicated support at 110.86 is needed to signal top is formed and suggest the rise from 110.24 has ended, then further fall to 110.50-55 would follow.

Dollar Under Pressure After Fed Minutes
The Greenback found itself under noticeable selling pressure during early trading on Thursday after May's Federal Reserve meeting minutes wereneatly packaged with a dovish undertone. Although expectations of a rate hike in June were realisedwhen Federal Reserve officials said it would “soon be appropriate” to raise rates again, the longer-term hiking path remains clouded.
With Fed policymakers more than likely to hold off hiking interest rates further until there is solid evidence that the recent economic deceleration is transitionary, hard economic data from the U.S will come under heavy scrutiny moving forward. The prospect of a third U.S rate increase by the Federal Reserve in 2017 still remains under threat, especially when considering how Trump uncertainty still remains a major theme.
OPEC meeting in focus
Oil prices were heavily supported this week by the growing optimism over major oil-producing countries working together to eliminateoversupply woes. With markets widely expecting OPEC and Non-OPEC members to extend the current output cut deal by another nine months, compliance is likely to be the main focus of today's meeting. With compliance still a grey area, it will be interesting to see if OPEC enacts penalties in the new deal to prevent other members from cheating or going against the agreement.
While WTI Crude may venture higher after OPEC officially confirm to extend production cuts, the upside could face some headwinds as investors ponder over how U.S Shale reacts. Although OPEC and Non-OPEC members have strived to re-balance the saturated markets by trimming production, this has offered an opportunity for U.S Shale to snatch market share from other OPEC members.
Sterling on standby ahead of GDP report
Sterling was passive this week with prices hovering around 1.3000 as investors redirected their focus elsewhere. A vulnerable Dollar did little to elevate prices higher and, assuch, continues to highlight how the upside remains limited by Brexit anxieties. Participants will direct their attention towards the second estimate for the first quarter GDP report this morning which could be a non-event if estimates are unchanged. With uncertainty over Brexit still gripping Sterling, downside risks remain present. From a technical standpoint, the GBPUSD could be displaying early signs of exhaustion with weakness below 1.2900 opening a path to 1.2775.
Euro back in fashion
The EURUSD has staged an incredible rebound this month with prices finding comfort around a six-month high at 1.1235 as of writing. With political risk in Europe a theme of the past and the macro-fundamentals in the European economy quite encouraging, the Euro is back in fashion. Sentiment towards the Euro is turning increasingly bullish with a further upside expected if ECB hawks make a return. From a technical standpoint, the EURUSD fulfils the prerequisites of a bullish trend as there hasbeen consistently higher highs and higher lows. Prices remain above the 20-day Simple Moving averages while the MACD trades to the upside. A breakout above 1.1250 should open a path towards 1.1350.
Daily Technical Analysis: EUR/USD Approaches Break Or Bounce Zone At 1.1250
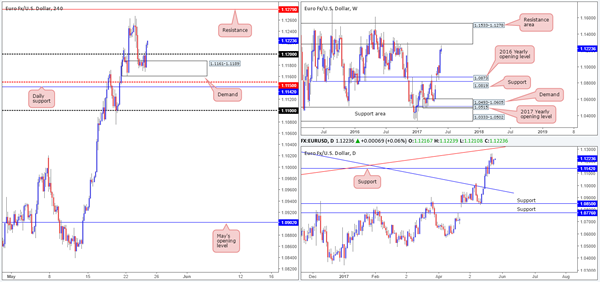
Currency pair EUR/USD
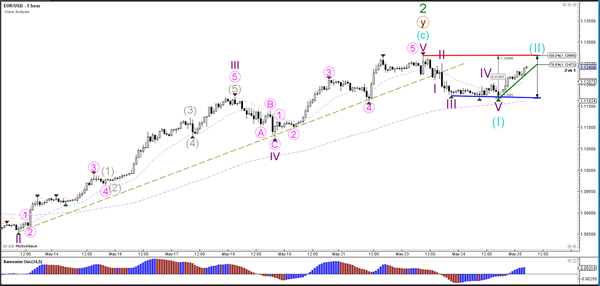
The EUR/USD is challenging the previous top near 1.1250 which is a major decision zone for either a bullish breakout or a bearish reversal. The critical level is the 100% Fibonacci at 1.1268: a break above this resistance top invalidates wave 2 (blue) whereas a break above 1.13 invalidates another bearish wave 2 (green). A bearish reversal, however, could see price break below support (blue).
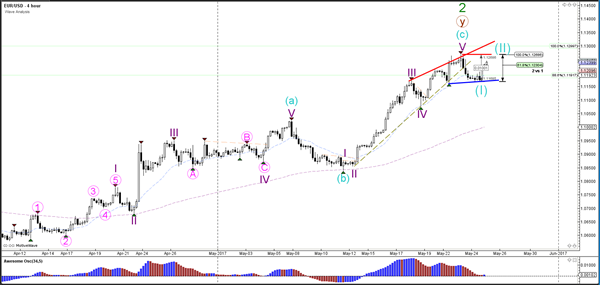
The EUR/USD has arrived at a key 78.6% Fibonacci resistance which is bearish bounce (reversal) or bullish breakout zone.
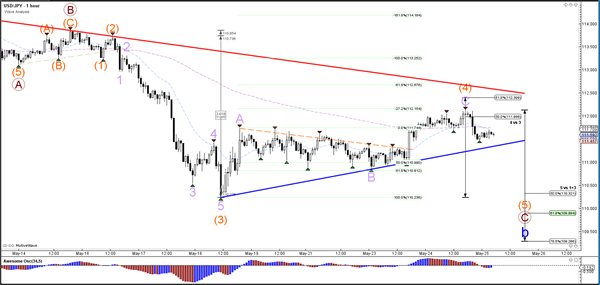
Currency pair USD/JPY
The USD/JPY break above 112-112.50 would indicate that the wave C (brown) of wave B (blue) is completed at the recent low and could see an uptrend continuation. A break below support (blue) could price complete wave B (blue) at a lower low.
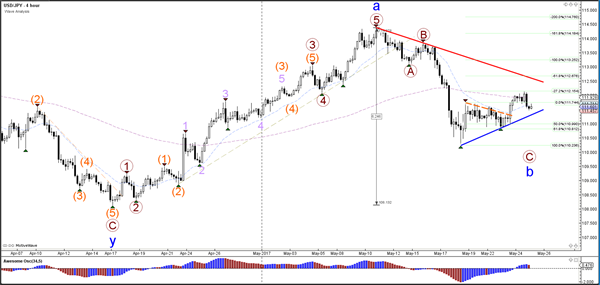
The USD/JPY is building a potential wave 4 (orange) correction and a wave 5 (orange) continuation before completing wave C (brown). However if price breaks above the 61.8% Fibonacci level of wave 4 (orange), then a different wave structure seems likely.
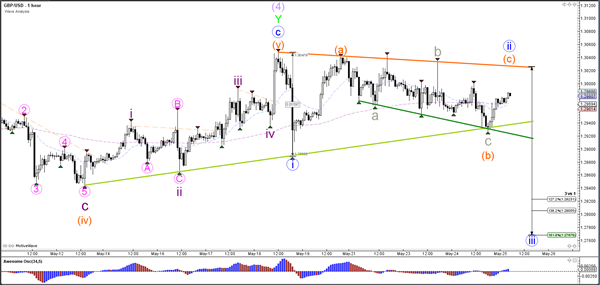
Currency pair GBP/USD
The GBP/USD break above the orange trend line indicates the invalidation of wave 2 and the potential for an uptrend continuation whereas but a break below the channel support (green/blue) could see a reversal take place.
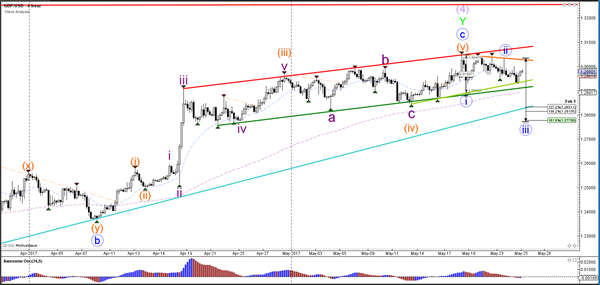
The GBP/USD is moving sideways in a correction which could be an ABC (orange) within wave 2 (blue).
Daily Technical Outlook And Review: EUR/USD, GBP/USD, AUD/USD, USD/JPY, USD/CAD, USD/CHF, DOW 30, GOLD
A note on lower timeframe confirming price action...
Waiting for lower timeframe confirmation is our main tool to confirm strength within higher timeframe zones, and has really been the key to our trading success. It takes a little time to understand the subtle nuances, however, as each trade is never the same, but once you master the rhythm so to speak, you will be saved from countless unnecessary losing trades. The following is a list of what we look for:
- A break/retest of supply or demand dependent on which way you're trading.
- A trendline break/retest.
- Buying/selling tails ... essentially we look for a cluster of very obvious spikes off of lower timeframe support and resistance levels within the higher timeframe zone.
- Candlestick patterns. We tend to only stick with pin bars and engulfing bars as these have proven to be the most effective.
We typically search for lower-timeframe confirmation between the M15 and H1 timeframes, since most of our higher-timeframe areas begin with the H4. Stops are usually placed 1-3 pips beyond confirming structures.
EUR/USD
Following an unsuccessful attempt to breach the 1.12 handle going into the early hours of yesterday's US segment, the pair eventually managed to gather enough momentum to conquer this barrier after the release of the FOMC meeting minutes. As of writing, pricing for a June rate hike is now pegged just below 80%.
With the 1.12 resistance now out of the picture, we're left with Tuesday's high at 1.1267, followed closely by H4 resistance at 1.1279, and then the 1.13 handle. Over on the higher timeframes, weekly price is seen trading within striking distance of a formidable resistance area coming in at 1.1533-1.1278. Down on the daily timeframe, price is currently loitering between a support level drawn from 1.1142 and a trendline resistance etched from the low 1.0711.
Our suggestions: Assuming that the bulls continue to punch higher today, we'll be watching the 1.13/1.1279 neighborhood for potential shorting opportunities. Why this area? Well, apart from the fact that this zone is made up of a H4 resistance and a round number, it's also bolstered by the underside of the said weekly resistance area at 1.1278, and the daily trendline resistance is currently seen intersecting with the 1.13 number.
Ultimately, we're going to be waiting for a reasonably sized H4 bearish candle to form around 1.13/1.1279, preferably a full-bodied candle, before pulling the trigger. This will help avoid getting stopped on a fakeout and inform us that seller interest exists here.
Data points to consider: US unemployment claims at 1.30pm, FOMC member Brainard speaks at 3pm GMT+1.
Levels to watch/live orders:
- Buys: Flat (stop loss: N/A).
- Sells: 1.13/1.1279 ([waiting for a reasonably sized H4 bear candle – preferably a full-bodied candle – to form before pulling the trigger is advised] stop loss: ideally beyond the candle's wick).
GBP/USD
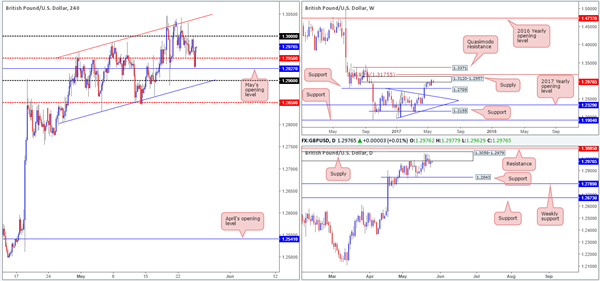
In recent trading, H4 price clipped the underside of the large psychological number 1.30, consequently forcing the pair to surpass the H4 mid-level barrier at 1.2950 and cross swords with May's opening level at 1.2927. As we write, price is trading back around the 1.2976 mark, looking poised to attack 1.30 once again. Also noteworthy is the overall H4 picture still remains trading within an ascending H4 channel (1.2804/1.2965) that's been in motion since early May.
Bouncing over to the bigger picture, however, we can see that weekly price remains trading within the walls of a supply base drawn from 1.3120-1.2957, and daily action continues to trade around supply seen within the said weekly supply at 1.3058-1.2979.
Our suggestions: While we still believe that the bears will eventually push the market lower, it's very difficult to get excited about this knowing that we have multiple H4 supports lurking just below: the H4 mid-level number 1.2950, May's opening level at 1.2927 and then the 1.29 handle that fuses with the channel support line etched from the low 1.2804.
Given the strong response seen from May's opening level a few hours ago, we do not see anything immediate to trade. With that, our team's position will remain flat going into today's sessions.
Data points to consider: UK Second estimate GDP at 9.30am. US unemployment claims at 1.30pm, FOMC member Brainard speaks at 3pm GMT+1.
Levels to watch/live orders:
- Buys: Flat (stop loss: N/A).
- Sells: Flat (stop loss: N/A).
AUD/USD
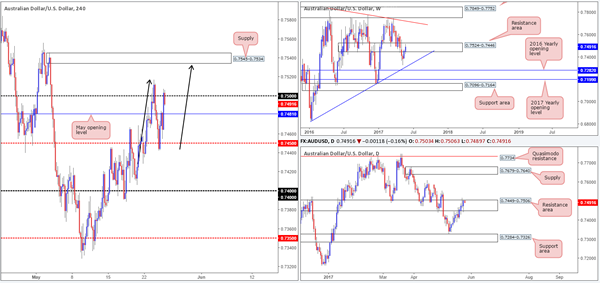
Looking at this market from the top this morning, we can see that the buyers and sellers remain battling for position within the weekly resistance area seen at 0.7524-0.7446. At the moment, the bulls appear to have the upper hand and could end with price closing above this area by the week's end. Down on the daily timeframe, nonetheless, price is seen trading around the upper edge of a resistance zone seen housed within the said weekly area at 0.7449-0.7506.
Influenced by yesterday's FOMC meeting, H4 price closed above both May's opening level at 0.7481 and the 0.75 handle. As you can see though, the bulls have struggled to maintain this bullish tone above 0.75 and price looks as though it will reconnect with May's opening level once again.
Our suggestions: The only interesting thing to jump out at us this morning is the potential H4 AB=CD bearish pattern (see black arrows) taken from the low 0.7428 that terminates just ahead of a H4 supply base 0.7545-0.7534. The only downside to this of course is the fact that the H4 supply is located above the two aforementioned higher-timeframe resistance areas! Therefore, shorting from here could end in tears given that higher-timeframe breakout buyers may very well be in play then.
Data points to consider: RBA Assist Gov. Debelle speaks at 9am. US unemployment claims at 1.30pm, FOMC member Brainard speaks at 3pm GMT+1.
Levels to watch/live orders:
- Buys: Flat (stop loss: N/A).
- Sells: Flat (stop loss: N/A).
USD/JPY
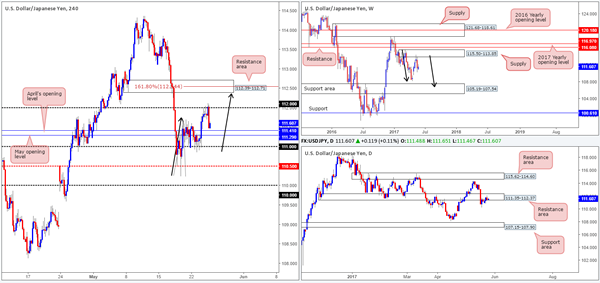
After spending the best part of a day clinging to the underside of the 112 handle, the bears finally stepped in and drove the unit lower. The move was seen following the release of the FOMC meeting minutes, and has, as you can see, placed the H4 candles within touching distance of May/April's opening levels at 111.29/111.41. For those who follow us on a regular basis you'll already know that we absolutely love monthly opening levels. In this case, however, it's a little bit tricky. Over on the daily timeframe, the pair is seen trading within the confines of a resistance area penciled in at 111.35-112.37. What's more, we also see weekly action showing room for the unit to trade as low as 105.19-107.54: a support area stretched all the way back to early 2014!
Our suggestions: As much as we'd like to buy from 111.29/111.41, it would just be too chancy in light of the higher-timeframe structure. There is, however, a chance that H4 price could still complete a H4 AB=CD pattern (black arrows) that terminates just ahead of a H4 resistance area coming in at 112.39-112.71.While this is worthy of attention, it might be worth noting that this H4 area sits a few pips above the current daily resistance area! So, breakout buyers could potentially make a short from the H4 supply zone rather messy. So, trade carefully here guys!
We have removed our pending sell order from 112.63, as we've now decided to watch how H4 price action behaves around the said supply before committing to a position.
Data points to consider: US unemployment claims at 1.30pm, FOMC member Brainard speaks at 3pm GMT+1.
Levels to watch/live orders:
- Buys: Flat (stop loss: N/A).
- Sells: 112.39-112.71 ([waiting for a reasonably sized H4 bear candle – preferably a full-bodied candle – to form before pulling the trigger is advised] stop loss: ideally beyond the candle's wick).
USD/CAD
(Trade update: closed the remainder of our long position from 1.3458 at 1.3494).
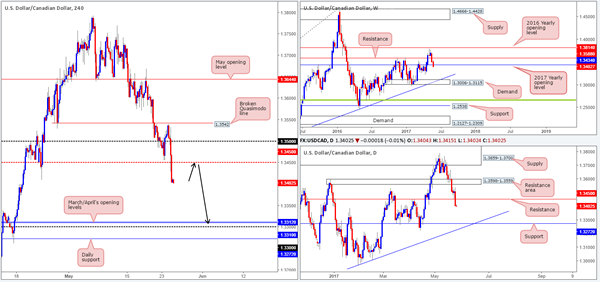
The USD/CAD weakened following the BoC meeting as policy makers were less cautious than expected. The move saw the 1.35 handle and eventually the H4 mid-level support at 1.3450 wiped out. Selling was fueled further after the release of the FOMC meeting minutes, potentially opening up the path south down to 1.3310/1.3312: March/April's opening levels which sits nearby the 1.33 handle.
What's also notable from a technical perspective is the 2017 yearly opening level seen plotted on the weekly chart at 1.3434 was recently breached. Alongside this, daily support at 1.3450 was also taken out with the market now looking poised to challenge support drawn from 1.3272, which happens to converge nicely with a trendline support taken from the low 1.2968.
Our suggestions: With the above notes suggesting that further downside could be on the cards, our team has their eye on 1.3450. A retest of this number followed by a H4 bearish candle (preferably a full-bodied candle) would, in our humble opinion, be enough to sell, targeting the 1.33 region.
It may also be worth noting that 1.33 is not only a nice take-profit zone; it's also an area we would also consider buying from. Not only are the monthly levels bolstered by the 1.33 handle, there's also the daily support mentioned above lurking just a few pips below it!
Data points to consider: US unemployment claims at 1.30pm, FOMC member Brainard speaks at 3pm GMT+1.
Levels to watch/live orders:
- Buys: Flat (stop loss: N/A).
- Sells: 1.3450 region ([waiting for a reasonably sized H4 bear candle – preferably a full-bodied candle – to form before pulling the trigger is advised] stop loss: ideally beyond the candle's wick).
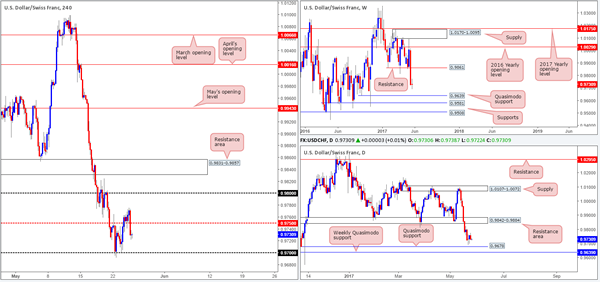
USD/CHF
During the course of yesterday's sessions, we saw the USD/CHF find a footing on the retest of a H4 mid-level support at 0.9750. Price, as you can see, managed to reach a high of 0.9776 before crashing lower following the release of the FOMC meeting minutes. This has positioned the H4 candles between 0.9750 and the 0.97 handle. Sitting directly below the 0.97 handle is a daily Quasimodo support at 0.9678. And a few pips below this level sits a weekly Quasimodo support barrier coming in at 0.9639.
As of current price, we believe 0.97 will be tested again in the near future. Only this time we expect to see more of an aggressive test: a fakeout through this number down to the daily Quasimodo support.
Our suggestions: Should price whipsaw through 0.97, test 0.9678, and close back above 0.97, we will look to enter long, targeting the 0.9750 region as an initial take-profit target.
Data points to consider: US unemployment claims at 1.30pm, FOMC member Brainard speaks at 3pm GMT+1
Levels to watch/live orders:
- Buys: 0.97 region ([wait for price to fakeout beyond the 0.97 handle and touch 0.9678 and then close back above 0.97, before looking to commit to a position] stop loss: ideally beyond the candle's tail).
- Sells: Flat (stop loss: N/A).
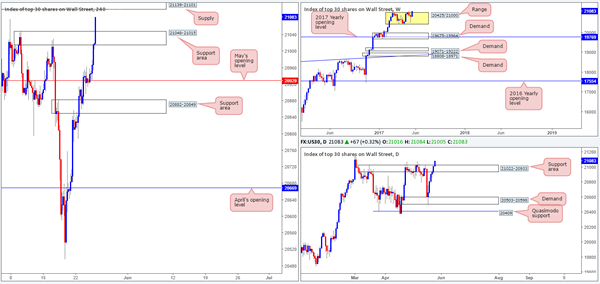
DOW 30
As can be seen from the weekly chart this morning, price is marginally trading above the range fixed between 20425/21000. In the event that this bullish momentum continues to be seen, it's highly likely that fresh record highs will be achieved before the week's end. Climbing down to the daily candles, however, the resistance area at 21022-20933 was also recently taken out. Assuming that the bulls remain above this zone today, we would expect this base to offer support to the market.
Looking over to the H4 action, the supply zone at 21048-21015 was recently breached, which has opened up the runway north for price to challenge the last remaining H4 supply at 21139-21101. Should this zone be consumed then, technically speaking, there's very little standing in the way of this index achieving fresh record highs.
Our suggestions: Although the bulls look incredibly determined at this time, entering long expecting price to reach new highs would still be a risk, in our opinion. Waiting for the H4 supply mentioned above at 21139-21101 to be taken out would be the safer route, before hunting for longs. Therefore, until we see a decisive close above this area, our desk will be patiently waiting on the sidelines.
Data points to consider: US unemployment claims at 1.30pm, FOMC member Brainard speaks at 3pm GMT+1.
Levels to watch/live orders:
- Buys: Watching for H4 price to close above H4 supply at 21139-21101 before looking to enter long this market.
- Sells: Flat (stop loss: N/A).
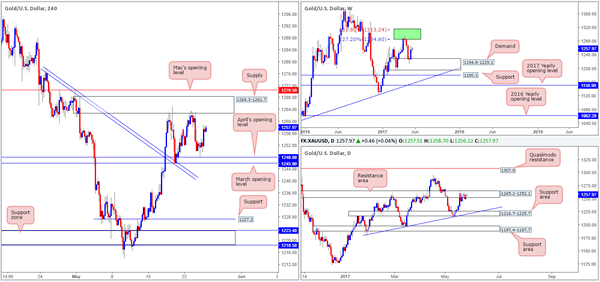
GOLD
The price of gold was once again bid from 1245.9/1248.0 (March/April's opening levels) and managed to reach a high of 1258.8 going into the closing bell. Yesterday's recovery has, in our opinion, seen the H4 candles enter into a phase of consolidation between the said monthly levels and a H4 supply zone coming in at 1268.3-1262.7. Positioned just below May's opening level at 1270.5 and also located around the top edge of a daily resistance area currently in play at 1265.2-1252.1, the bulls will likely struggle to get beyond this wall. With that being said, we feel that price will eventually break to the downside and look to target the daily support area drawn from 1216.7-1225.7, which happens to converge with a trendline support taken from the low 1180.4. Also notice here that the H4 support level marked at 1227.2 is positioned directly above this daily zone.
Our suggestions: For the time being, our desk has agreed that remaining on the sidelines until we see a decisive H4 close form beyond the current H4 range is the better/safer route to take. A decisive H4 close lower coupled with a retest to the underside of the range, and a reasonably sized H4 bearish candle (full-bodied if possible) would be enough evidence to suggest a short is valid down to 1227.2.
Levels to watch/live orders:
- Buys: Flat (stop loss: N/A).
- Sells: Watching for a H4 close to form below 1245.9/1248.0 before we consider shorts in this market.
European Open Briefing: The US Dollar Came Under Pressure
Global Markets:
- Asian stock markets: Nikkei up 0.35 %, Shanghai Composite rose 0.40 %, Hang Seng rallied 0.60 %, ASX 200 gained 0.05 %
- Commodities: Gold at $1258 (+0.45 %), Silver at $17.20 (+0.50 %), WTI Oil at $51.75 (+0.75 %), Brent Oil at $54.40 (+0.80 %)
- Rates: US 10-year yield at 2.26, UK 10-year yield at 0.40, German 10-year yield at 0.40
News & Data:
- Asian shares hit two-year high after Fed signals gradual tightening – RTRS
- Fed ties rate hike to economic rebound, sees balance sheet cuts in 2017 – RTRS
- Fed's Evans sees serious policy miss on U.S. inflation – RTRS
- Oil prices rise in anticipation of extended OPEC-led production cut – RTRS
Markets Update:
The US Dollar came under pressure after the release of the FOMC meeting minutes. While a June rate hike still seems likely, the central bank was a bit cautious, and the outlook beyond is slightly more uncertain.
EUR/USD rose back above 1.12 and reached a high of 1.1245 in Asia. The pair is likely to retest resistance at 1.12700 soon. Stronger selling interest is noted ahead of 1.13.
USD/JPY rose along with equities, but reversed gains post-FOMC. The pair ran into solid demand below 111.50, and overall, the short-term outlook remains positive if the risk-on sentiment persists.
Commodity currencies strengthened in Asia. AUD/USD is back above 0.75, although it ran out of momentum again. Meanwhile, NZD/USD cleared a key resistance level at 0.7040, and USD/CAD fell below 1.34, supported by a rising oil price.
The main event today will be the OPEC meeting. It is expected that the organization will agree to extend their output cut by 9 months. Anything less would be a disappointment for the market and bring Oil prices under pressure.
Upcoming Events:
- 09:00 BST – RBA Assistant Governor Debelle speaks
- 09:30 BST – UK GDP
- 13:30 BST – US Initial Jobless Claims
- 15:00 BST – FOMC Member Brainard speaks
- 18:00 BST – ECB Member Constancio speaks
Australian Dollar Extends Its Gains In The Morning Session
For the 24 hours to 23:00 GMT, the AUD rose 0.25% against the USD and closed at 0.7500.
LME Copper prices marginally rose or $2.0/MT to $5662.5/MT. Aluminium prices rose 0.93% or $18.0/MT to $1944.0/MT.
Meanwhile, ratings agency, Moody's downgraded China's long-term credit rating to A1 from Aa3 due to its rising debt levels and possible slowdown in the economy, renewing concerns about the economic strength of Australia's largest trading partner.
In the Asian session, at GMT0300, the pair is trading at 0.7514, with the AUD trading 0.19% higher against the USD from yesterday's close.
The pair is expected to find support at 0.7466, and a fall through could take it to the next support level of 0.7418. The pair is expected to find its first resistance at 0.7539, and a rise through could take it to the next resistance level of 0.7564.
The currency pair is trading above its 20 Hr and 50 Hr moving averages.

German Consumer Confidence Rose For A Consecutive Second Month For June
For the 24 hours to 23:00 GMT, the EUR rose 0.32% against the USD and closed at 1.1222, after Germany’s GfK consumer confidence index unexpectedly climbed to a level of 10.4 for June, on the back of further improvement in expectations on income and economy, following a reading of 10.2 in the previous month. Investors had expected the index to remain unchanged.
Meanwhile, the European Central Bank (ECB) President, Mario Draghi, hinted that there would be no changes to monetary policy at its upcoming meeting on 8 June 2017. He further stated that monetary policy would stay very supportive of borrowing and investment for some time. Moreover, the central bank ruled out the possibility that Brexit could pose a major risk to the Eurozone economy.
Separately, in its semi-annual Financial Stability Review, the central bank stated that recent increase in yields and political uncertainty in some nations have raised fresh concerns over debt-sustainability in the last six months.
In the US, the latest FOMC minutes signalled that policymakers could raise interest rates “soon” and supported a plan to gradually shrink the Federal Reserve’s (Fed) $4.5 trillion balance sheet. However, the central bankers added that it would be prudent to wait for additional data to check whether recent slowdown in economic growth is temporary or not.
In other data, the US existing home sales declined 2.3% in April to an annual rate of 5.57 million units, against market expectations for a 1.1% drop. In the prior month, existing homes sales had risen 4.2% to an annual rate of 5.70 million. Moreover, the US mortgage applications rose 4.4% on a monthly basis during the week ended 19 May, from a 4.1% drop reported in the previous week. Additionally, the nation’s housing price index rose more than expected by 0.6% in March, compared to an advance of 0.8% in the prior month. Market expectation was for the housing price index to climb 0.5%.
In the Asian session, at GMT0300, the pair is trading at 1.1240, with the EUR trading 0.16% higher against the USD from yesterday’s close.
The pair is expected to find support at 1.1193, and a fall through could take it to the next support level of 1.1145. The pair is expected to find its first resistance at 1.1264, and a rise through could take it to the next resistance level of 1.1287.
Ahead in the day, market participants would keenly await the release of the US advance goods trade balance for April and initial jobless claims for the week ended 20 May, for further direction in the currency pair.
The currency pair is trading above its 20 Hr and 50 Hr moving averages.
