
Sample Category Title
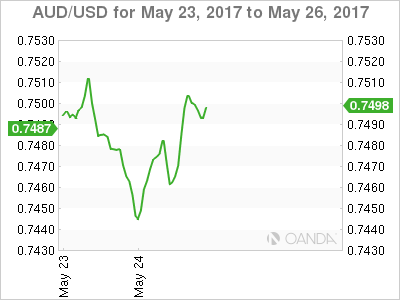
Dollar Stays Weak after FOMC Minutes, Canadian Dollar Jumps after BoC
Dollar stays generally soft as FOMC minutes delivered little surprise overnight. Fed is generally still expected to hike interest rate again in June. The plan for shrinking the balance sheet was outlined too. US equities were firm with DOW, S&P 500 and NASDAQ heading back to record highs. But treasury yields and Dollar didn't follow. The Dollar index is trading soft at around 96.9 at the time of writing as renewed strength in seen in EUR/USD in Asian session. The Dollar index is still on course for medium term fibonacci level at 96.46. Meanwhile, Canadian dollar jumps overnight as markets responded positively to BoC statement and strength in oil price.
Fed outlined balance sheet normalization plan
In the minutes of May FOMC meeting, Fed noted most officials agreed that it's appropriate to raise interest rate again "soon". This is in line with markets expectation of a June hike with fed fund futures pricing in 83.1% odds of that. Fed also outlined the plan to normalize its USD 4.5T balance sheet. "Most participants judged that if economic information came in about in line with their expectations, it would soon be appropriate for the committee to take another step in removing some policy accommodation." According to the plan, the process will be similar to Fed's tapering. At the very beginning, a small amount of securities would be allowed to roll off without reinvesting. Meanwhile, the amount would increase in regular increments. Such a plan could be set on auto-pilot unless there was a major deterioration in the economic outlook. And the minutes noted that "nearly all policymakers expressed a favorable view of this general approach."
Canadian Dollar strengthens on BoC and Oil
Bank of Canada left overnight rate target unchanged at 0.50% as widely expected yesterday. The bank rate was held correspondingly at 0.75% and the deposit rate at 0.25%.
Canadian Dollar responded positively as the statement noted that "the Canadian economy's adjustment to lower oil prices is largely complete and recent economic data have been encouraging, including indicators of business investment." Also, "consumer spending and the housing sector continue to be robust on the back of an improving labour market, and these are becoming more broadly based across regions." Nonetheless, the statement also noted subdued export growth due to competitive challenges and growth in Q2 will moderate from the "very strong growth in Q1". Globally, BoC acknowledged that global economy "continues to gain traction" and growth will "gradually strengthen and broaden". It talked down the weakness in US in Q1 and believed that they were due to "mostly temporary factors".
Overall, BoC judged that "the current degree of monetary stimulus is appropriate at present". That was a change from April's statement with "the current stance of monetary policy is still appropriate " The addition of "stimulus" and a time element of "at present" argues that BoC could be starting to tweak its language to open the door for a rate hike later in the year.
Development in oil price also supports the Canadian Dollar. WTI crude edges higher to 51.93 today and recent rally is still on course to 53.76/55.24 resistance zone. The Joint OPEC-NON-OPEC Ministerial Monitoring Committee recommended a nine-month extensions of production cut to ministers of member countries, who are meeting in Austria today. Oil Ministers of Iraq and Iran expressed their support with the extension. Iranian Oil Minister said " it's a unanimous idea to continue the cut we decided in December." Nonetheless, while there were some speculations of the possibility of a deeper cut, Iraqi Oil Minister Jabbar al-Luaibi said that "it's only the freeze we are talking about. We will continue with the current cuts."
ECB acknowledged positive developments but warned of downside risks
In the financial stability review released yesterday, ECB acknowledged positive development at regional and global level. The central bank noted that "most measures of euro area systemic stress remained at low levels over the past six months. Growing optimism about economic growth prospects in the United States and Europe boosted global market sentiment in the early part of the review period." Nonetheless, it cautioned that "recent developments do, however, cast some doubt on the materialisation of a significant reflation in the United States." Also, "financial market sentiment improved over the review period, but risks of further repricing in bond markets remain."
ECB also noted in the report that "in some countries where political support for pursuing fiscal and structural reforms was viewed by the markets as waning, investors required additional risk premia on sovereign bonds." And, "overall, risks to financial stability stemming from financial markets remain significant, mainly owing to the possibility of a further rapid repricing in global fixed income markets."
Regarding the banking sector, ECB said that "interest rates still remain at low levels and continue to challenge banks' ability to generate sustainable profits. Furthermore, in some regions, banks' profitability prospects continue to be dampened by the large stocks of non-performing loans." Also, "a number of structural challenges also weigh on banks' longer-term profitability prospects, including overcapacity in certain banking markets, a limited degree of income diversification and cost-inefficiencies in several banking sectors."
On the data front...
UK will release Q1 GDP revision, index of services and BBA mortgage approvals in European session. US will release trade balance, whole sales inventories and jobless claim.
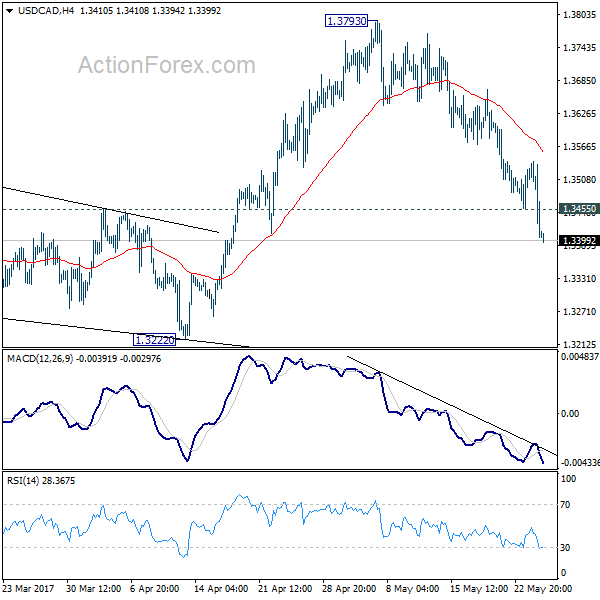
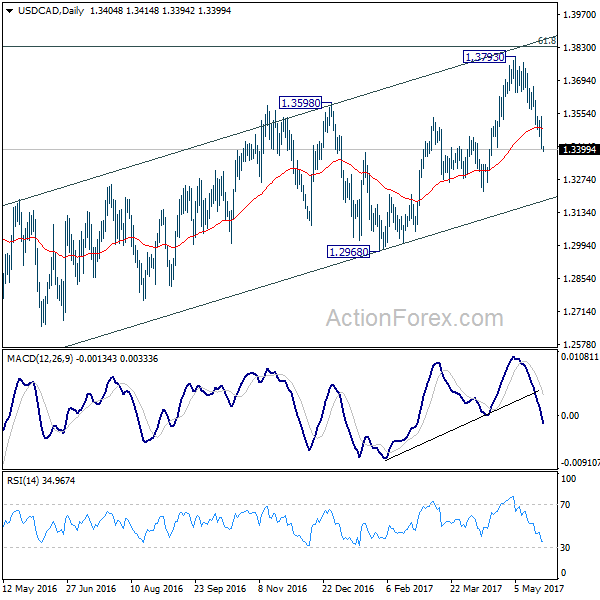
USD/CAD Daily Outlook
Daily Pivots: (S1) 1.3361; (P) 1.3450; (R1) 1.3495; More....
USD/CAD's decline continues today and reaches as low as 1.3394 so far today. Intraday bias remains on the downside as the fall from 1.3793 is targeting 1.3222 support next. As noted before, corrective rally from 1.2460 could have finished ahead of 1.3838 fibonacci level. Break of 1.3222 will affirm this case and target 1.2968 key support level for confirmation. On the upside, above 1.3455 minor resistance will turn bias neutral and bring another recovery first.
In the bigger picture, price actions from 1.4689 medium term top are seen as a correction pattern. The first leg has completed at 1.2460. Rise from 1.2460 is seen as the second leg and would end at around 61.8% retracement of 1.4689 to 1.2460 at 1.3838. Break of 1.3222 should indicate the start of the third leg while further break of 1.2968 should confirm. Nonetheless, sustained trading above 1.3838 would pave the way to retest 1.4689 high.
Economic Indicators Update
| GMT | Ccy | Events | Actual | Forecast | Previous | Revised |
|---|---|---|---|---|---|---|
| 08:30 | GBP | BBA Mortgage Approvals Apr | 40.8K | 41.1K | ||
| 08:30 | GBP | GDP Q/Q Q1 P | 0.30% | 0.30% | ||
| 08:30 | GBP | Index of Services 3M/3M Mar | 0.30% | 0.50% | ||
| 12:30 | USD | Advance Goods Trade Balance Apr | -64.6B | -64.8B | ||
| 12:30 | USD | Wholesale Inventories Apr P | 0.20% | 0.20% | ||
| 12:30 | USD | Initial Jobless Claims (20 MAY) | 238k | 232k | ||
| 14:30 | USD | Natural Gas Storage | 68B |
BOC Stayed Pat. Subdued Inflation Offset Strong Growth Prospect
Bank of Canada left the policy rate unchanged at 0.5% in May. Canadian dollar rallied to a 1-month higher against the US dollar after the announcement. Although the decision had been widely anticipated, traders were thrilled as policymakers acknowledged the strength in both global and domestic growth developments. The central bank also noted its expectations of 'very strong growth in the first quarter'. Yet, the abovementioned hawkishness was offset by concerns over subdued wage and price growth, leaving the overall statement neutral.
In the short post-meeting statement, policymakers indicated that the global economy continued to 'gain traction' and recent developments reinforced the view that 'growth will gradually strengthen and broaden over the projection horizon'. Acknowledging the slowdown in the US, Canada's biggest trading partner, in the first quarter, BOC attributed it to 'temporary factors' and remained confident over 'a rebound in the second quarter'.
Domestically, policymakers noted that the 'adjustment to lower oil prices is largely complete' and acknowledged the 'encouraging' economic data released of late. The central bank pointed to the improvement in the indicators of business investment, consumer spending, the housing sector, as well as the employment market. The BOC remained concerned over the strong property price, indicating that the macro-prudential and other policy measures have not yet contributed to a substantial cooling effect on housing markets. Meanwhile, the central bank suggested that the very strong export growth in the first quarter would be followed by some moderation in the second quarter.
On inflation, BOC noted that the continuous decline in food prices was mainly driven by 'intense retail competition'. Policymakers also pointed that the central bank's three measures of core inflation remained below +2% whilst the subdued wage growth was consistent 'with ongoing excess capacity in the economy'.
We expect the central bank leave the policy rate unchanged or the rest of the year. Yet, should the strong growth in recent quarters translate into inflationary pressures, the BOC would be more motivated to begin hiking interest rates.
(FED) Minutes of the Federal Open Market Committee May 2-3, 2017
A joint meeting of the Federal Open Market Committee and the Board of Governors was held in the offices of the Board of Governors of the Federal Reserve System in Washington, D.C., on Tuesday, May 2, 2017, at 1:00 p.m. and continued on Wednesday, May 3, 2017, at 9:00 a.m.
PRESENT:
Janet L. Yellen, Chair
William C. Dudley, Vice Chairman
Lael Brainard
Charles L. Evans
Stanley Fischer
Patrick Harker
Robert S. Kaplan
Neel Kashkari
Jerome H. Powell
Marie Gooding, Loretta J. Mester, Mark L. Mullinix, Michael Strine, and John C. Williams, Alternate Members of the Federal Open Market Committee
James Bullard, Esther L. George, and Eric Rosengren, Presidents of the Federal Reserve Banks of St. Louis, Kansas City, and Boston, respectively
Brian F. Madigan, Secretary
Matthew M. Luecke, Deputy Secretary
David W. Skidmore, Assistant Secretary
Michelle A. Smith, Assistant Secretary
Scott G. Alvarez, General Counsel
Michael Held, Deputy General Counsel
Steven B. Kamin, Economist
Thomas Laubach, Economist
David W. Wilcox, Economist
James A. Clouse, Thomas A. Connors, Michael Dotsey, Evan F. Koenig, Daniel G. Sullivan, William Wascher, and Beth Anne Wilson, Associate Economists
Simon Potter, Manager, System Open Market Account
Lorie K. Logan, Deputy Manager, System Open Market Account
Ann E. Misback, Secretary, Office of the Secretary, Board of Governors
Matthew J. Eichner, Director, Division of Reserve Bank Operations and Payment Systems, Board of Governors; Michael S. Gibson, Director, Division of Supervision and Regulation, Board of Governors; Andreas Lehnert, Director, Division of Financial Stability, Board of Governors
Stephen A. Meyer, Deputy Director, Division of Monetary Affairs, Board of Governors
Trevor A. Reeve, Senior Special Adviser to the Chair, Office of Board Members, Board of Governors
Joseph W. Gruber, David Reifschneider, and John M. Roberts, Special Advisers to the Board, Office of Board Members, Board of Governors
Linda Robertson, Assistant to the Board, Office of Board Members, Board of Governors
Christopher J. Erceg, Senior Associate Director, Division of International Finance, Board of Governors; Diana Hancock and David E. Lebow, Senior Associate Directors, Division of Research and Statistics, Board of Governors; Gretchen C. Weinbach, Senior Associate Director, Division of Monetary Affairs, Board of Governors
Antulio N. Bomfim, Ellen E. Meade, Edward Nelson, and Joyce K. Zickler, Senior Advisers, Division of Monetary Affairs, Board of Governors
Rochelle M. Edge, Associate Director, Division of Financial Stability, Board of Governors; Jane E. Ihrig and David López-Salido, Associate Directors, Division of Monetary Affairs, Board of Governors; John J. Stevens, Associate Director, Division of Research and Statistics, Board of Governors
Glenn Follette, Assistant Director, Division of Research and Statistics, Board of Governors
Patrick E. McCabe, Adviser, Division of Research and Statistics, Board of Governors
Penelope A. Beattie,2 Assistant to the Secretary, Office of the Secretary, Board of Governors
Dana L. Burnett, Michele Cavallo, and Dan Li, Section Chiefs, Division of Monetary Affairs, Board of Governors
Benjamin K. Johannsen, Senior Economist, Division of Monetary Affairs, Board of Governors
Arsenios Skaperdas,5 Economist, Division of Monetary Affairs, Board of Governors
Ellen J. Bromagen, First Vice President, Federal Reserve Bank of Chicago
David Altig, Kartik B. Athreya, Geoffrey Tootell, and Christopher J. Waller, Executive Vice Presidents, Federal Reserve Banks of Atlanta, Richmond, Boston, and St. Louis, respectively
Troy Davig, Julie Ann Remache,4 and Nathaniel Wuerffel,5 Senior Vice Presidents, Federal Reserve Banks of Kansas City, New York, and New York, respectively
Todd E. Clark, Terry Fitzgerald, and Òscar Jordà, Vice Presidents, Federal Reserve Banks of Cleveland, Minneapolis, and San Francisco, respectively
Rania Perry,5 Assistant Vice President, Federal Reserve Bank of New York
David Lucca, Research Officer, Federal Reserve Bank of New York
Developments in Financial Markets and Open Market Operations
The manager of the System Open Market Account (SOMA) reported on developments in domestic and foreign financial markets over the period since the March FOMC meeting. Yields on U.S. Treasury securities declined, and the broad index of the foreign exchange value of the dollar fell modestly. These changes reportedly reflected revisions to investors' expectations for fiscal and other economic policies; some increase in geopolitical tensions; economic and inflation indicators that, on balance, were weaker than anticipated; and monetary policy communications. In response to political developments abroad, spreads on some European sovereign debt securities narrowed noticeably. Measures of implied volatility in equity markets declined, on net, to levels that were historically very low. Market pricing and survey evidence indicated that investors anticipated no change in the target range for the federal funds rate at this meeting but saw a substantial probability of an increase at the June FOMC meeting; market expectations for the path of the federal funds rate further ahead fell somewhat. Federal funds continued to trade well within the FOMC's target range. Reinvestment of principal payments from Treasury and mortgage-backed securities held in the SOMA proceeded smoothly. The manager updated the Committee on various small-value tests of System operations.
The manager also briefed the Committee on developments regarding certain reference interest rates. Changes in the practices of some domestic and foreign banks for booking certain types of liabilities, as well as the effects of recent changes in the regulation of money market funds, had resulted in a reduction in the volume of Eurodollar transactions reported on the Federal Reserve's Report of Selected Money Market Rates (FR 2420). The staff was in the process of analyzing possible revisions to the report that would guard against a further erosion of reported transactions and support the robustness of the overnight bank funding rate calculated by the Federal Reserve Bank of New York. Such revisions might be implemented in conjunction with the periodic renewal of authorization for the report, which is expected to be completed by the third quarter of 2018. The manager also noted that aspects of plans to publish reference interest rates for market repurchase agreements (repos) were being modified to incorporate a newly available source of data on cleared bilateral repo transactions; the modifications were expected to extend the time frame for publication of the new rates by several months.
The Committee voted unanimously to renew the reciprocal currency arrangements with the Bank of Canada and the Bank of Mexico; these arrangements are associated with the Federal Reserve's participation in the North American Framework Agreement of 1994. In addition, the Committee voted unanimously to renew the dollar and foreign currency liquidity swap arrangements with the Bank of Canada, the Bank of England, the Bank of Japan, the European Central Bank, and the Swiss National Bank. The votes to renew the Federal Reserve's participation in these standing arrangements are taken annually at the April or May FOMC meeting.
By unanimous vote, the Committee ratified the Desk's domestic transactions over the intermeeting period. There were no intervention operations in foreign currencies for the System's account during the intermeeting period.
Staff Review of the Economic Situation
The information reviewed for the May 2-3 meeting indicated that the labor market strengthened further in March but that growth of real gross domestic product (GDP) slowed in the first quarter, with the slowing likely reflecting transitory factors. The 12-month change in overall consumer prices was close to the Committee's longer-run objective of 2 percent in recent months; excluding food and energy, consumer prices declined in March, and the 12-month change in core consumer prices remained somewhat below 2 percent. Survey-based measures of inflation expectations were little changed on balance.
Total nonfarm payroll employment rose in March, but the gain was smaller than in recent months, likely reflecting both warmer-than-usual temperatures in February that probably caused some hiring to be moved forward and a major winter storm in the Northeast in March that probably held down hiring somewhat; nevertheless, the increase in employment for the first quarter as a whole was solid. The unemployment rate decreased to 4.5 percent in March, and the labor force participation rate was unchanged. The share of workers employed part time for economic reasons declined. The rates of private- sector job openings, hiring, and quits were all little changed in January and February. The four-week moving average of initial claims for unemployment insurance benefits remained at a very low level through mid-April. Measures of labor compensation accelerated modestly. The employment cost index for private workers increased 2-1/4 percent over the 12 months ending in March, and average hourly earnings for all employees increased 2-3/4 percent over the same period; both increases were somewhat larger than those over the 12 months ending in March 2016.
The average unemployment rate for whites in the first quarter of this year was 1/2 percentage point lower than its annual average for 2015, while the unemployment rates for Hispanics and for African Americans were about 1 percentage point and 1-3/4 percentage points lower, respectively. The larger improvements in the rates for Hispanics and for African Americans mirrored the larger increases in those rates during the most recent recession. As of the first quarter, the unemployment rates for African Americans and for Hispanics remained above the rate for whites both overall and for people with similar educational backgrounds. Unemployment rates for Asians remained below those for whites.
Total industrial production rose in February and March, primarily reflecting a further expansion of mining output as well as a net increase in the output of utilities. Manufacturing production declined in March after advancing in each of the previous six months; about half of the decline in March was due to a decrease in the output of motor vehicles and parts. Automakers' assembly schedules suggested that motor vehicle production would increase in the second quarter despite somewhat elevated levels of vehicle inventories. Broader indicators of manufacturing production, such as the new orders indexes from national and regional manufacturing surveys, pointed to modest gains in factory output over the near term.
Real personal consumption expenditures (PCE) rose only modestly in the first quarter, although monthly data indicated some improvement late in the quarter. Indeed, after declining in January and February, real PCE increased in March, partly reflecting a rebound in spending on energy services, which had been held down by unseasonably warm weather through February, as well as an increase in outlays for a variety of consumer goods. Motor vehicle sales picked up in April after declining in March, although sales remained somewhat below their average pace in the first quarter and noticeably below the high levels seen in the fourth quarter. Recent readings on key factors that influence consumer spending pointed to solid growth in real PCE in coming quarters, including further gains in employment, real disposable personal income, and households' net worth. Moreover, consumer sentiment, as measured by the University of Michigan Surveys of Consumers, remained upbeat in March and April.
Residential investment increased at a brisk pace in the first quarter. Starts for both new single-family homes and multifamily units moved up, and issuance of building permits for new single-family homes--which tends to be a reliable indicator of the underlying trend in residential construction--also rose. Sales of both new and existing homes in the first quarter were above their levels in the previous quarter.
Real private expenditures for business equipment and intellectual property increased at a solid pace in the first quarter after a moderate gain in the fourth quarter. Nominal shipments and new orders of nondefense capital goods excluding aircraft both rose over the three months ending in March, and the level of new orders remained higher than that of shipments, pointing to further near-term gains in shipments. In addition, indicators of business sentiment were upbeat in recent months. Real business expenditures for nonresidential structures increased briskly in the first quarter, and the number of oil and gas rigs in operation, an indicator of spending for structures in the drilling and mining sector, continued to rise through mid-April. Business inventory investment slowed sharply last quarter and held down real GDP growth significantly.
Real federal purchases declined in the first quarter, as defense expenditures decreased and nondefense spending rose at a slower pace than in the final quarter of 2016. Real state and local government purchases also declined in the first quarter, with a sharp decrease in real construction spending by these governments more than offsetting a modest expansion in state and local government payrolls.
The U.S. international trade deficit narrowed in February. Exports rose and imports fell sharply, with imports of automotive products and consumer goods declining after robust increases in January. Preliminary data on trade in goods suggested that the trade deficit was about unchanged in March. The Bureau of Economic Analysis estimated that real net exports added slightly to growth of real GDP in the first quarter.
Total U.S. consumer prices, as measured by the PCE price index, increased 1-3/4 percent over the 12 months ending in March. Core PCE price inflation, which excludes changes in food and energy prices, was about 1-1/2 percent over those same 12 months. Over the 12 months ending in March, total consumer prices as measured by the consumer price index (CPI) rose 2-1/2 percent, while core CPI inflation was 2 percent. On a month-over-month basis, both the PCE price index and the CPI decreased in March, partly reflecting declines in some categories of prices that appeared unlikely to be repeated. The median of longer-run inflation expectations from the Michigan survey edged down a bit, on balance, in recent months, while the medians from the Desk's Survey of Primary Dealers and Survey of Market Participants were little changed.
Foreign real GDP growth appeared to have strengthened in the first quarter after slowing somewhat in the fourth quarter. In the advanced foreign economies (AFEs), indicators for the first quarter pointed to faster economic growth in Canada and solid growth in the euro area and Japan. By contrast, real GDP growth in the United Kingdom slowed significantly. More recent indicators were consistent with moderate economic growth in most AFEs. In the emerging market economies (EMEs), growth picked up in China and some Asian economies in the first quarter but slowed moderately in Mexico. Recent data also suggested that economic activity improved in parts of South America, most notably in Brazil where positive growth likely resumed in the first quarter. Inflation in the AFEs continued to rise, largely because of the pass-through of earlier increases in crude oil prices into retail energy prices. In the EMEs, inflation fell in China in the first quarter, reflecting a sharp drop in food prices, but was pushed up in Mexico by fuel price hikes and pass-through from past currency depreciation.
Staff Review of the Financial Situation
Domestic financial market conditions remained generally accommodative over the intermeeting period. Prices of risky assets increased a bit on net, Treasury yields declined, and the dollar depreciated. The decline in Treasury yields reportedly was driven in part by investor expectations of a somewhat slower pace of policy rate increases following FOMC communications after the March meeting and some waning of investor optimism about prospects for more expansionary fiscal policies.
FOMC communications over the intermeeting period reportedly were interpreted as indicating a somewhat slower pace of policy rate increases than previously expected but an earlier change to the Committee's reinvestment policy. Although the Committee's decision to raise the target range for the federal funds rate at the March meeting was widely anticipated, some of the accompanying communications were viewed as more accommodative than expected. Investors reportedly also took note of the discussion in the March FOMC minutes of the Committee's reinvestment policy as well as statements from some FOMC participants and appeared to pull forward their expectations for when the FOMC will either announce or start to implement a change to that policy. Overall, however, the market reaction to news related to potential changes in reinvestment policy appeared to be fairly limited. Quotes on overnight index swap (OIS) rates pointed to a flattening of the expected path of the federal funds rate through 2020, but a staff model suggested that a reduction in term premiums accounted for about half the decline in OIS rates.
Yields on intermediate- and longer-term nominal Treasury securities decreased 20 to 35 basis points over the intermeeting period. Investors' interpretations of FOMC communications, market perceptions of a reduced likelihood of domestic fiscal and regulatory policy changes, weaker-than-expected domestic economic data releases, and geopolitical factors and foreign political developments all reportedly placed downward pressure on yields. A staff term structure model attributed about one-third of the decline in the 10-year Treasury yield to a decrease in the average expected future short-term rate and the remaining two-thirds to a lower term premium. While inflation compensation based on Treasury Inflation-Protected Securities decreased at near-term horizons, partly reflecting the lower-than-expected March CPI release, far-term inflation compensation was little changed on net.
Broad U.S. equity price indexes increased slightly, on net, since the March FOMC meeting. One-month-ahead option-implied volatility on the S&P 500 index--the VIX--rose appreciably in mid-April, reflecting in part increased investor concerns about geopolitical factors and foreign political developments, but ended the period slightly lower, as investor concerns appeared to ease after the first round of the French presidential election. Over the intermeeting period, spreads of yields on investment- and speculative-grade nonfinancial corporate bonds over comparable-maturity Treasury securities narrowed a bit on net. Private-sector analysts continued to project robust profit growth for S&P 500 firms over 2017 even as first-quarter earnings, on a seasonally adjusted basis, were estimated to be a bit lower than in the fourth quarter.
Conditions in short-term funding markets were stable over the intermeeting period. Reflecting the FOMC's policy action in March, yields on a broad set of money market instruments moved higher. Treasury bills outstanding, which had declined before the reimposition of the federal debt ceiling on March 15, moved higher thereafter, partly in connection with the Treasury's steps to rebuild its cash balance. Take-up at the System's overnight reverse repurchase agreement facility, which had risen ahead of the debt ceiling date, remained high through March and then fell to relatively low levels after quarter-end.
Financing conditions for large nonfinancial firms stayed accommodative. Gross issuance of corporate bonds and leveraged loans remained strong in March, with a large share of lower-rated debt issued for refinancing purposes. Net debt financing by nonfinancial businesses increased in the first quarter but remained noticeably below the pace of the same time last year. According to the April Senior Loan Officer Opinion Survey on Bank Lending Practices (SLOOS), a modest share of domestic banks reported weaker demand for commercial and industrial (C&I) loans, on net, in the first quarter, mainly citing several factors that pertained to customers' reduced needs for financing. C&I lending continued to be soft early in the second quarter.
Financing conditions for commercial real estate (CRE) were broadly unchanged on net. Spreads on commercial mortgage-backed securities (CMBS) widened slightly over the period since the March FOMC meeting but remained near the lower end of the range seen since the financial crisis. CMBS issuance picked up in March, reportedly reflecting a return to a more normal pace after the adoption of a credit risk retention rule in late December caused some issuance to be shifted from January and February into the fourth quarter. Growth of CRE loans on banks' books slowed in the first quarter but continued to be robust overall. Domestic respondents to the April SLOOS generally reported tightening their lending standards and experiencing weaker loan demand across all major CRE loan categories during the first quarter.
Financing conditions in the residential mortgage market were little changed over the intermeeting period. Credit availability continued to be relatively tight for households with low credit scores or harder-to-document incomes but relatively accommodative for other households. Mortgage rates declined in line with yields on longer-term Treasury securities and mortgage-backed securities, but they remained elevated compared with the very low levels of the third quarter of 2016. Consistent with these developments, refinance originations slowed considerably since the third quarter. In the April SLOOS, banks reported roughly unchanged standards on residential real estate (RRE) loans on average. Banks also reported that demand for some categories of RRE loans weakened during the first quarter, including those insured or guaranteed by government agencies. In line with lower reported demand, growth in RRE loans on banks' balance sheets declined.
Financing conditions in consumer credit markets remained accommodative, on balance, in early 2017. Consumer credit appeared to be broadly available even as interest rates charged on credit card balances and new auto loans drifted up in line with their benchmark shorter-term interest rates. Growth in consumer loan balances moderated a bit further from the relatively strong pace seen during the past few years, although year-over-year growth in credit card balances, student loans, and auto loans stayed in the 6 to 7 percent range through February. In the April SLOOS, banks reported tightening standards on auto loans and easing standards on credit card loans; banks also reported facing weaker demand for both auto and credit card loans.
Over the intermeeting period, movements in foreign financial markets were driven by central bank communications in the United States and abroad, geopolitical risks, and changes in investors' perceptions about future U.S. fiscal and other government policies. Concerns about the outcome of the French presidential election and tensions in the Korean peninsula pushed down 10‑year sovereign yields in the advanced economies for several weeks. Sentiment improved following the outcome of the first round of the French presidential election on April 23, which led to a partial retracement in yields. At their meetings on April 27, the European Central Bank and the Bank of Japan each left their policy stance unchanged. On net, foreign yields declined somewhat less than U.S. yields, contributing to a modest depreciation of the dollar against both the AFE and EME currencies. Equity indexes in most advanced and emerging economies rose. Flows to emerging market mutual funds remained strong, and spreads on emerging market debt were little changed.
The staff provided its latest report on the potential risks to financial stability; it continued to characterize the financial vulnerabilities of the U.S. financial system as moderate on balance. This overall assessment reflected the staff's judgment that leverage as well as vulnerabilities from maturity and liquidity transformation in the financial sector were low, that leverage in the nonfinancial sector was moderate, and that asset valuation pressures in some markets were notable. Although these assessments were unchanged from January's assessment, vulnerabilities appeared to have increased for asset valuation pressures, though not by enough to warrant raising the assessment of these vulnerabilities to elevated.
Staff Economic Outlook
In the U.S. economic forecast prepared by the staff for the May FOMC meeting, real GDP growth was projected to bounce back in the second quarter from its weak first-quarter reading. The staff judged that the weakness in first-quarter real GDP was probably not attributable to residual seasonality and that it instead reflected transitorily soft consumer expenditures and inventory investment. Importantly, PCE growth was expected to pick up to a stronger pace in the spring, which would be more consistent with ongoing gains in employment, real disposable personal income, and households' net worth. In addition, the sharp decrease in the contribution to GDP growth from the change in inventory investment in the first quarter was not expected to be repeated. Beyond the near term, the forecast for real GDP growth was a little stronger, on net, than in the previous projection, mostly due to the effect of a somewhat lower assumed path for the exchange value of the dollar. The staff continued to project that real GDP would expand at a modestly faster pace than potential output in 2017 through 2019, supported in part by the staff's maintained assumption that fiscal policy would become more expansionary in the coming years. The unemployment rate was projected to decline gradually over the next couple of years and to run somewhat below the staff's estimate of its longer-run natural rate over this period; the staff's estimate of the natural rate was revised down slightly in this forecast.
The staff's forecast for consumer price inflation, as measured by changes in the PCE price index, was revised down marginally for 2017 as a whole after incorporating the soft data on consumer prices for March, but it was essentially unrevised thereafter. Inflation was still expected to be somewhat higher this year than last year, reflecting an upturn in the prices for food and non-energy imports as well as a slightly faster increase in energy prices. The staff continued to project that inflation would increase gradually in 2018 and 2019 and that it would be marginally below the Committee's longer-run objective of 2 percent in 2019.
The staff viewed the uncertainty around its projections for real GDP growth, the unemployment rate, and inflation as similar to the average of the past 20 years. The risks to the forecast for real GDP were seen as tilted to the downside, primarily reflecting the staff's assessment that monetary policy appeared to be better positioned to respond to large positive shocks to the economic outlook than to substantial adverse ones. However, the staff viewed the risks to the forecast as less pronounced than late last year, with both somewhat diminished risks to the foreign outlook and an increase in U.S. consumer and business confidence. Consistent with the downside risks to aggregate demand, the staff viewed the risks to its outlook for the unemployment rate as tilted to the upside. The risks to the projection for inflation were judged to be roughly balanced. The downside risks from the possibility that longer-term inflation expectations may have edged down or that the dollar could appreciate substantially were seen as roughly counterbalanced by the upside risk that inflation could increase more than expected in an economy that was projected to continue operating above its longer-run potential.
Participants' Views on Current Conditions and the Economic Outlook
In their discussion of the economic situation and the outlook, meeting participants agreed that the information received over the intermeeting period indicated that the labor market had continued to strengthen even as growth in economic activity slowed in the first quarter. Job gains remained solid, on average, in recent months, and the unemployment rate declined. Household spending rose only modestly, but the fundamentals underpinning the continued growth of consumption remained solid. Business fixed investment firmed in the first quarter after increasing only slowly over the previous two years. Inflation measured on a 12-month basis recently had been running close to the Committee's 2 percent longer-run objective; consumer prices, both including and excluding prices of energy and food items, declined in March, and core inflation continued to run somewhat below 2 percent. Market-based measures of inflation compensation remained low; survey-based measures of longer-term inflation expectations were little changed on balance.
Although the incoming data showed that aggregate spending in the first quarter had been weaker than participants had expected, they viewed the slowing as likely to be transitory. They continued to expect that, with further gradual adjustments in the stance of monetary policy, economic activity would expand at a moderate pace, labor market conditions would strengthen somewhat further, and inflation would stabilize around 2 percent over the medium term.
Participants generally indicated that their assessments of the medium-term economic outlook had changed little since the March meeting, and they discussed various reasons why the softness in consumer spending in the first quarter was likely to be transitory. Some participants judged that the low reading on GDP growth also could partly reflect residual seasonality and so would likely be followed by stronger GDP growth in subsequent quarters, repeating a pattern evidenced in recent years. A few emphasized the uncertainty with regard to the reasons for the unexpected weakness in consumer spending but considered it too early to judge the implications for the outlook. Many pointed to the recent firming of the housing market and business fixed investment as welcome developments.
Overall, participants continued to see the near-term risks to the economic outlook as roughly balanced. Many participants saw the risks stemming from global economic and financial developments as having receded further over the intermeeting period. They pointed to the encouraging tone of recent data on economic growth abroad, which suggested some upside risks to foreign economic activity. However, several noted that downside risks to the global outlook remained, either because of geopolitical developments and foreign political factors or because monetary policy normalization in the United States could lead to financial strains in EMEs. Many participants continued to view the possibility of expansionary fiscal policy changes in the United States as posing upside risks to their forecasts for U.S. economic growth, although they also noted that prospects for enactment of a more expansionary fiscal program, as well as its size, composition, and timing, remained highly uncertain. Regarding the outlook for inflation, a couple of participants expressed concern that a substantial undershooting of the longer-run normal rate of unemployment could pose an appreciable upside risk to inflation. However, several others continued to see downside risks to the inflation outlook, particularly given the low readings on inflation over the intermeeting period and the still-low measures of inflation compensation and inflation expectations. Participants agreed that the Committee should continue to closely monitor inflation indicators and global economic and financial developments.
While recent data suggested a significant slowdown of growth in consumption spending early in the year, participants expected to see a rebound in consumer spending in coming months in light of the solid fundamentals underpinning household spending, including ongoing job gains, rising household income and wealth, improved household balance sheets, and buoyant consumer sentiment. It was noted that much of the recent slowing likely reflected transitory factors, such as low consumer spending for energy services induced by an unusually mild winter and a decline in motor vehicle sales from an unsustainably high fourth-quarter pace. Nevertheless, contacts expected that demand for motor vehicles would be well maintained. District reports on the service sector were generally positive, although one District's contacts in the tourism industry reported a falloff in international visitors. One participant noted that retail contacts reported upbeat projections for online sales and associated package delivery services, in part reflecting structural shifts in the retail industry.
Several participants discussed the pickup in residential investment in the first quarter. Starts and permits for single-family housing continued to post moderate increases, while sales of new homes rose strongly from their level in the fourth quarter of 2016. Business contacts in some Districts reported that residential construction activity had not kept pace with demand, resulting in shortages in housing supply and upward pressure on prices.
Business fixed investment increased at a solid pace in the first quarter, led by a rebound in drilling for oil and natural gas. Several participants noted that rising orders for capital goods suggested further gains in business equipment investment over coming quarters. Business contacts reported increases in activity in the manufacturing and energy sectors. Contacts in many Districts were said to be generally optimistic about business prospects. Several participants noted that surveys of business conditions in their Districts continued to indicate expanding activity. A few participants commented that firms engaged in international trade were benefiting from improvements in global demand conditions. Several participants reported that firms in their Districts planned to increase capital expenditures, although in another District, uncertainty about changes in trade and regulatory policies was said to be weighing on capital spending. Conditions in the agricultural sector remained weak, partly as a result of low commodity prices.
Labor market conditions strengthened further in recent months. At 4.5 percent, the unemployment rate had reached or fallen below levels that participants judged likely to be normal over the longer run. Increases in nonfarm payroll employment averaged almost 180,000 per month during the first quarter, a pace that, if maintained, would be expected to result in further increases in labor utilization over time. Labor market conditions in many Districts were reported to have continued to improve. Contacts in several Districts reported a pickup in wage increases, shortages of workers in selected occupations, or pressures to train workers for hard-to-fill jobs. Even so, several other participants suggested some margins may remain along which labor market utilization could increase further without giving rise to inflationary pressures. In that regard, they noted that the recent rise in the labor force participation rate in the face of a downward trend from demographic factors was a positive development. However, a couple of participants pointed out that uncertainty about both the longer-run normal rate of unemployment and labor force trends made it difficult to assess the scope for additional sustainable increases in labor utilization. Generally, participants continued to expect that if economic growth stayed moderate, as they projected, the unemployment rate would remain, for the next few years, below their estimates of its longer-run normal level. A few participants continued to anticipate a substantial undershooting of the longer-run normal level of the unemployment rate.
Readings on headline and core PCE price inflation in March had come in lower than expected. On a 12‑month basis, headline PCE price inflation had edged above the Committee's 2 percent objective in February, but this measure dropped back to 1.8 percent in March, in part reflecting the effects of lower energy prices on the headline index. Core PCE price inflation, which historically has been a good predictor of future headline inflation, moved down to 1.6 percent over the 12 months ending in March. However, it was noted that some of this slowing reflected idiosyncratic factors such as a large drop in the measure of quality-adjusted prices for wireless telephone services. Several participants emphasized that inflation measured on a 12-month basis had been running very close to the Committee's 2 percent target. Overall, most participants viewed the recent softer inflation data as primarily reflecting transitory factors, but a few expressed concern that progress toward the Committee's objective may have slowed. Market-based measures of longer-term inflation compensation remained low, with five-year, five-year-forward CPI inflation compensation a bit below 2 percent--unchanged from the time of the March FOMC meeting but somewhat above levels registered last year. In addition, the median measure of inflation expectations over the next 5 to 10 years in the Michigan survey edged down from 2.5 percent in February to 2.4 percent in March and April. The three-year-ahead measure of inflation expectations from the Federal Reserve Bank of New York's Survey of Consumer Expectations decreased from 3.0 percent to 2.7 percent in March and rose to 2.9 percent in April.
In light of these developments, participants generally continued to expect that inflation would stabilize around the Committee's 2 percent objective over the medium run as the effects of transitory factors waned and conditions in the labor market and the overall economy improved further. Participants noted that import prices had begun to increase, supporting their expectation that inflation would gradually rise. A few participants, however, expressed uncertainty about the reasons for the recent unexpected weakness in inflation measures and about its implications for the inflation outlook.
In their discussion of recent developments in financial markets, some participants commented on changes in financial conditions in the wake of the Committee's decision to increase the target range for the federal funds rate in March. They noted variously that the decline in longer-term interest rates and the modest depreciation of the dollar over the intermeeting period would provide some stimulus to aggregate demand, that the Committee's recent policy actions had not resulted in a tightening of financial conditions, or that some of the decline in longer-term yields reflected investors' perceptions of diminished odds of significant fiscal stimulus and an increase in some geopolitical and foreign political risks.
With regard to financial stability, several participants emphasized that higher requirements for capital and liquidity in the banking system and other prudential standards had contributed to increased resilience in the financial system since the financial crisis. However, they expressed concerns that a possible easing of regulatory standards could increase risks to financial stability. In addition, it was noted that real estate values were elevated in some sectors of the CRE market, that a sharp decline in such valuations could pose risks to financial stability, and that potential reforms in the housing finance sector could have implications for such valuations.
In their consideration of monetary policy, participants judged that it was appropriate to leave the target range for the federal funds rate unchanged at this meeting. Although the data on aggregate spending and inflation received over the intermeeting period were, on balance, weaker than participants expected, they generally saw the outlook for the economy and inflation as little changed and judged that a continued gradual removal of monetary policy accommodation remained appropriate. A couple of participants indicated that increasing the target range for the federal funds rate at the current meeting would be warranted by their economic outlook, but they also noted that maintaining the current stance of policy for now would be consistent with the Committee's gradual approach or that the Committee's recent communications had not pointed to an increase at this meeting. Most participants judged that if economic information came in about in line with their expectations, it would soon be appropriate for the Committee to take another step in removing some policy accommodation. A number of participants pointed out that clarification of prospective fiscal and other policy changes would remove one source of uncertainty for the economic outlook. Participants generally agreed that the current stance of monetary policy remained accommodative, supporting some additional strengthening in labor market conditions and a sustained return to 2 percent inflation.
Participants generally reiterated their support for a continued gradual approach to raising the federal funds rate. Some participants noted that core PCE price inflation had been running below the Committee's objective for overall inflation for the past eight years and that it was important to return inflation to 2 percent, or that the public's longer-term inflation expectations may have fallen somewhat, and that a gradual approach to tightening could help return expectations and inflation to 2 percent. One participant cited results of a District survey of businesses indicating that more than one-third of respondents saw the Federal Reserve as more likely to accept inflation below its 2 percent objective than above; that participant interpreted the survey results as suggesting that the Committee's communications about the symmetry of its inflation objective had not completely taken hold, a concern also mentioned by a couple of other participants. Another participant observed that a gradual approach was appropriate because the neutral rate of interest had declined and considerable uncertainty prevailed about its longer-run level. Several participants, however, pointed to conditions under which the Committee might need to consider a somewhat more rapid removal of monetary accommodation--for instance, if the unemployment rate fell appreciably further than currently projected, if wages increased more rapidly than expected, or if highly stimulative fiscal policy changes were to be enacted. In contrast, a couple of others judged that the Committee could withdraw monetary accommodation even more gradually than reflected in the medians of forecasts in the March Summary of Economic Projections, noting that slack might remain in the labor market or that inflation was not very sensitive to declines in the unemployment rate below its estimated longer-run normal level.
Committee Policy Action
In their discussion of monetary policy for the period ahead, members judged that information received since the Committee met in March indicated that the labor market had continued to strengthen even as growth in economic activity had slowed. Job gains had remained solid, on average, in recent months, and the unemployment rate had declined. Household spending had risen only modestly, but the fundamentals underpinning the continued growth of consumption remained solid, while business fixed investment had firmed.
Inflation, measured as the 12-month change in the headline PCE price index, had been running close to the Committee's 2 percent longer-run objective. Core inflation continued to run somewhat below 2 percent. Both headline and core consumer price indexes fell in March. Market-based measures of inflation compensation had remained low, while survey-based measures of longer-term inflation expectations had changed little on balance.
With respect to the economic outlook and its implications for monetary policy, members agreed that the slowing in growth during the first quarter was likely to be transitory and continued to expect that, with gradual adjustments in the stance of monetary policy, economic activity would expand at a moderate pace, labor market conditions would strengthen somewhat further, and inflation would stabilize around 2 percent over the medium term. Members continued to judge that there was significant uncertainty about the effects of possible changes in fiscal and other government policies but that near-term risks to the economic outlook appeared roughly balanced. A couple of members noted that the outlook for global growth appeared to have brightened and that downside risks from abroad had waned. Members agreed that they would continue to closely monitor inflation indicators and global economic and financial developments.
After assessing current conditions and the outlook for economic activity, the labor market, and inflation, members agreed to maintain the target range for the federal funds rate at 3/4 to 1 percent. They noted that the stance of monetary policy remained accommodative, thereby supporting some further strengthening in labor market conditions and a sustained return to 2 percent inflation.
Members generally judged that it would be prudent to await additional evidence indicating that the recent slowing in the pace of economic activity had been transitory before taking another step in removing accommodation. Members agreed that, in determining the timing and size of future adjustments to the target range for the federal funds rate, the Committee would assess realized and expected economic conditions relative to its objectives of maximum employment and 2 percent inflation. This assessment would take into account a wide range of information, including measures of labor market conditions, indicators of inflation pressures and inflation expectations, and readings on financial and international developments. Members also agreed to continue to carefully monitor actual and expected inflation developments relative to the Committee's symmetric inflation goal, with one member viewing further progress of inflation toward the 2 percent objective as necessary before taking another step to remove policy accommodation. Members expected that economic conditions would evolve in a manner that would warrant gradual increases in the federal funds rate. Members agreed that the federal funds rate was likely to remain, for some time, below levels that they expected to prevail in the longer run. However, they noted that the actual path of the federal funds rate would depend on the economic outlook as informed by incoming data.
The Committee also decided to maintain its existing policy of reinvesting all principal payments from its holdings of agency debt and agency mortgage-backed securities in agency mortgage-backed securities and of rolling over maturing Treasury securities at auction. Members anticipated doing so until normalization of the level of the federal funds rate was well under way, and they noted that this policy, by keeping the Committee's holdings of longer-term securities at sizable levels, should help maintain accommodative financial conditions.
At the conclusion of the discussion, the Committee voted to authorize and direct the Federal Reserve Bank of New York, until it was instructed otherwise, to execute transactions in the SOMA in accordance with the following domestic policy directive, to be released at 2:00 p.m.:
"Effective May 4, 2017, the Federal Open Market Committee directs the Desk to undertake open market operations as necessary to maintain the federal funds rate in a target range of 3/4 to 1 percent, including overnight reverse repurchase operations (and reverse repurchase operations with maturities of more than one day when necessary to accommodate weekend, holiday, or similar trading conventions) at an offering rate of 0.75 percent, in amounts limited only by the value of Treasury securities held outright in the System Open Market Account that are available for such operations and by a per-counterparty limit of $30 billion per day.
The Committee directs the Desk to continue rolling over maturing Treasury securities at auction and to continue reinvesting principal payments on all agency debt and agency mortgage-backed securities in agency mortgage-backed securities. The Committee also directs the Desk to engage in dollar roll and coupon swap transactions as necessary to facilitate settlement of the Federal Reserve's agency mortgage-backed securities transactions."
The vote also encompassed approval of the statement below to be released at 2:00 p.m.:
"Information received since the Federal Open Market Committee met in March indicates that the labor market has continued to strengthen even as growth in economic activity slowed. Job gains were solid, on average, in recent months, and the unemployment rate declined. Household spending rose only modestly, but the fundamentals underpinning the continued growth of consumption remained solid. Business fixed investment firmed. Inflation measured on a 12-month basis recently has been running close to the Committee's 2 percent longer-run objective. Excluding energy and food, consumer prices declined in March and inflation continued to run somewhat below 2 percent. Market-based measures of inflation compensation remain low; survey-based measures of longer-term inflation expectations are little changed, on balance.
Consistent with its statutory mandate, the Committee seeks to foster maximum employment and price stability. The Committee views the slowing in growth during the first quarter as likely to be transitory and continues to expect that, with gradual adjustments in the stance of monetary policy, economic activity will expand at a moderate pace, labor market conditions will strengthen somewhat further, and inflation will stabilize around 2 percent over the medium term. Near-term risks to the economic outlook appear roughly balanced. The Committee continues to closely monitor inflation indicators and global economic and financial developments.
In view of realized and expected labor market conditions and inflation, the Committee decided to maintain the target range for the federal funds rate at 3/4 to 1 percent. The stance of monetary policy remains accommodative, thereby supporting some further strengthening in labor market conditions and a sustained return to 2 percent inflation.
In determining the timing and size of future adjustments to the target range for the federal funds rate, the Committee will assess realized and expected economic conditions relative to its objectives of maximum employment and 2 percent inflation. This assessment will take into account a wide range of information, including measures of labor market conditions, indicators of inflation pressures and inflation expectations, and readings on financial and international developments. The Committee will carefully monitor actual and expected inflation developments relative to its symmetric inflation goal. The Committee expects that economic conditions will evolve in a manner that will warrant gradual increases in the federal funds rate; the federal funds rate is likely to remain, for some time, below levels that are expected to prevail in the longer run. However, the actual path of the federal funds rate will depend on the economic outlook as informed by incoming data.
The Committee is maintaining its existing policy of reinvesting principal payments from its holdings of agency debt and agency mortgage-backed securities in agency mortgage-backed securities and of rolling over maturing Treasury securities at auction, and it anticipates doing so until normalization of the level of the federal funds rate is well under way. This policy, by keeping the Committee's holdings of longer-term securities at sizable levels, should help maintain accommodative financial conditions."
Voting for this action: Janet L. Yellen, William C. Dudley, Lael Brainard, Charles L. Evans, Stanley Fischer, Patrick Harker, Robert S. Kaplan, Neel Kashkari, and Jerome H. Powell.
Voting against this action: None.
Consistent with the Committee's decision to leave the target range for the federal funds rate unchanged, the Board of Governors voted unanimously to leave the interest rates on required and excess reserve balances unchanged at 1 percent and voted unanimously to approve establishment of the primary credit rate (discount rate) at the existing level of 1-1/2 percent.
System Open Market Account Reinvestment Policy
Participants continued their discussion of issues related to potential changes to the Committee's policy of reinvesting principal payments from securities held in the SOMA. The staff provided a briefing that summarized a possible operational approach to reducing the System's securities holdings in a gradual and predictable manner. Under the proposed approach, the Committee would announce a set of gradually increasing caps, or limits, on the dollar amounts of Treasury and agency securities that would be allowed to run off each month, and only the amounts of securities repayments that exceeded the caps would be reinvested each month. As the caps increased, reinvestments would decline, and the monthly reductions in the Federal Reserve's securities holdings would become larger. The caps would initially be set at low levels and then be raised every three months, over a set period of time, to their fully phased-in levels. The final values of the caps would then be maintained until the size of the balance sheet was normalized.
Nearly all policymakers expressed a favorable view of this general approach. Policymakers noted that preannouncing a schedule of gradually increasing caps to limit the amounts of securities that could run off in any given month was consistent with the Committee's intention to reduce the Federal Reserve's securities holdings in a gradual and predictable manner as stated in the Committee's Policy Normalization Principles and Plans. Limiting the magnitude of the monthly reductions in the Federal Reserve's securities holdings on an ongoing basis could help mitigate the risk of adverse effects on market functioning or outsized effects on interest rates. The approach would also likely be fairly straightforward to communicate. Moreover, under this approach, the process of reducing the Federal Reserve's securities holdings, once begun, could likely proceed without a need for the Committee to make adjustments as long as there was no material deterioration in the economic outlook.
Policymakers agreed that the Committee's Policy Normalization Principles and Plans should be augmented soon to provide additional details about the operational plan to reduce the Federal Reserve's securities holdings over time. Nearly all policymakers indicated that as long as the economy and the path of the federal funds rate evolved as currently expected, it likely would be appropriate to begin reducing the Federal Reserve's securities holdings this year. Policymakers agreed to continue in June their discussion of plans for a change to the Committee's reinvestment policy.
It was agreed that the next meeting of the Committee would be held on Tuesday-Wednesday, June 13-14, 2017. The meeting adjourned at 11:45 a.m. on May 3, 2017.
Notation Vote
By notation vote completed on April 4, 2017, the Committee unanimously approved the minutes of the Committee meeting held on March 14-15, 2017.
FOMC Minutes Give the Go ahead to June Hike
The minutes from the Federal Open Market Committee's meeting in May showed continued confidence in the labor market recovery among participants and suggested the Committee is comfortable to continue on its path of gradual increases in the federal funds rate.
Of note, "most participants judged that if economic information came in about in line with their expectations, it would soon be appropriate for the Committee to take another step in removing some policy accommodation."
The apparent weakness in economic growth and consumer spending early in the year was noted, but the general sense was that it would prove temporary. Weakness in consumer spending was contrasted with the improvement in both residential and non-residential investment – which were deemed as an encouraging sign.
The Committee's risk assessment remained balanced, with little change in longer-term outlook. However, participants noted financial stability concerns regarding valuations in CRE and that "reforms in the housing finance sector could have implications for such valuations."
The debate around the two sides of the Federal Reserve's mandate continued, with doves emphasizing inflation's current low readings and expressing concern over expectations, while more hawkish members noted the undershooting of the unemployment rate and the potential for this to lead to an eventual overshooting of inflation.
The minutes provided some additional detail on reinvestment policy, suggesting that it will soon formally outline its policy and potentially begin shrinking its balance sheet later this year. The outlined approach would set dollar limits on the amount of securities that would be allowed to run off. The pace of runoff would be small initially, but rise over time. Limits would be raised every three months until fully phased-in, at which point they would be maintained until the Fed's balance sheet was normalized.
Key Implications
As long as the labor market continues to generate above-trend job growth (minutes noted 180k monthly in the first quarter), the Fed's bias will be to gradually raise the federal funds rate.
The one thing that may slow their hand is a continued deceleration in inflation. Ongoing weakness in price growth would support those on the FOMC who see the unemployment rate as either under-reporting the level of economic slack or as not having the explanatory power in predicting inflation that it once did. The Fed, while not giving up on the Phillip's curve, is at least willing to take a wait and see approach.
The other potential fly in the ointment for ongoing normalization in short-term rates is the desire to also begin normalizing the balance sheet. The Fed's hope is that if telegraphed clearly and far enough in advance, and if done in a gradual and predictable manner, balance sheet normalization will have minimal deleterious effect on financial conditions and can work in tandem with short-term rate increases in gradually removing monetary accommodation.
Where Are The Hawks?
Where are the hawks?
With few hawkish surprises in the FOMC minutes, other than some more extensive than expected discussion around the balance sheet, the US dollar sold off as pre-event USD supportive positioning unwound
The Fed continued to downplay the listless Q1 US economic activity and softer inflation metrics as transitory which now accentuates the importance of next week's economic calendar.While, the market continues to view the Federal Reserve on track for a June lift off, but this decision may come down to the wire, with next Friday's payrolls, and specifically the wages growth component, providing a gentle nudge one way or another. While we maintain our base case for a June hike, the picture is a bit murky down the road and could continue to weigh negatively on the Greenback. There's still much ground to be covered, and despite the increased chance of a September balance sheet broadcast, but if the Feds can't convincingly guide us to an interest rate hike one month before the market event, one can only imagine the indecisions and market gyrations leading up to a possible taper.
In the meantime, price action remains 'passive' and 'stable' amidst growing ' uncertainty', words we seldom use in the same sentence when describing the market, but such is the reality of the current market conditions.
The China downgrade has had a minimal initial impact on the markets, as it wasn't too unexpected given the burdening debt load and in reality, China has negligible vulnerability or exposure to foreign investors, so the market quickly shrugged off the downgrade.
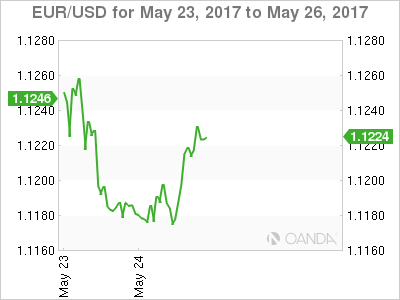
Euro
The Euro moved higher despite passive comments from ECB' members this week, which brings into question the recent build-up of short-term Euro longs to post the French election. However, it's more likely the market views the solid performance in Eurozone economic activity as speaking louder than words at this stage, and the EUR tone remains guardedly confident on expectations of shifting ECB language. While we're seeing an early buy into the Euro this morning, if the ECB headlines continue to reinforce a dovish stance, long positioning could evaporate quickly.
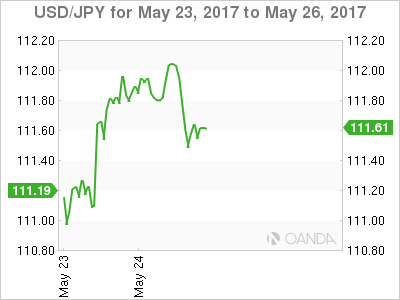
Japanese Yen
Dollar-yen movements are suggestive of position overhang from the near term short dollar view on the back of US political uncertainty and geopolitical risk in the Korean peninsula. The market may be stretched long JPY as a guard against a potential escalation of event risk, and now dealers find themselves reluctant to add to those positions and at the same time remain pessimistic on the USD.
With few catalysts to buy dollars from the Fed minutes, dealers remain in a state of limbo, eyeing headline risk on one screen while tracking US bond yields on the other.
While USDJPY has recovered well from the 111.00 level as US yields continue to provide surprising motivation as US yields rose following a soft Treasury Bill auction, but without the needed kick from the Feds or a rebound in sagging US economic data, the pair will continue to struggle above 112.00
Australian dollar
Aussie came temporarily unhinged on the China downgrade as G10 dealers use AUD as a proxy for China risk, but the move was really all about the drop in Iron ore prices. Iron ore futures are struggling amidst report that mainland steelmakers are retooling to make better use of Scrap and when combined with iron ore inventories rising at 45 Chinese ports the current view for iron ore prices doesn't present a rosy picture.
Aussie has rebounded on less hawkish Fed minutes and a bounce in WTI as we approach the OPEC meeting.But will likely struggle, as it has so often of late, to gain any momentum above the .7500 handle more so as the iron or glut remains in focus.
Asia FX
Following up on relatively quiet Asia session yesterday when outside the PHP which broke the 50.00 level in the NDF markets on aggressive buying after the martial law declaration, trading was dead. However, overnight activity saw decent dollar selling interest on USDKRW and USDTWD, in part driven by exporter flow but magnified by a less hawkish Fed retort.
The Ringgit broke through the critical 4.29 level as oil prices continue to move higher ahead of the OPEC meeting. The bullish momentum keeps the MYR in favour for a catch-up play to regional currencies.
FOMC Minutes: Fed Outlines QT Principles And Expects To Hike ‘Soon’
On the rate hike outlook, 'most participants' (both covering voting and non-voting FOMC members) think a rate hike will be appropriate 'soon'. As mentioned in the statement, the FOMC members were not worried about the weak GDP growth in Q1, which they think is transitory and partly reflecting negative residual seasonality. The members also noted that the unemployment rate had dropped further below the Fed's NAIRU estimate of 4.7%. That said, 'a few participants' think it is a 'concern' that the progress on the inflation goal has slowed (and remember the meeting took place before the CPI data for April). Overall, the Fed admits it is in a difficult position. On the one hand the Fed should likely hike rates as it has met its employment objective; on the other, the Fed should be more cautious as it has missed its inflation target for eight years (except for a few months). Since the meeting, the problem has only worsened for the Fed. The jobs report for April showed the unemployment rate dipped to 4.4% (the lowest in a decade) while the CPI data for April surprised on the downside, as CPI core inflation dipped to 1.9% .
While consensus is that the Fed will hike at the June meeting, we are still more sceptical, because of both the weaker economic data and still too low inflation. However, we just think the Fed will wait until July, so it is not a given it should lead to a major reaction in the financial markets. Thus, it will not be a major surprise for us if the Fed decides to hike in June anyway, also given the current market pricing. By waiting until July, the Fed gets some more data points to ensure that inflation does not continue to surprise on the downside and that growth has rebounded in Q2 after the weak Q1. The reason why we think the Fed will still hike relatively soon is that it puts more weight on labour market data than inflation rates. Also, if the Fed hikes in June, it would indicate a hiking pace of four hikes per year (every other meeting), which is more than the Fed projected both in December and March (3 hikes per year). We expect the third hike this year to be in December.
Next year we now expect the Fed to hike three times (previously 3-4 times) due to a combination of the Fed's desire to shrink its balance sheet soon (see section below and the next page) and Trump's inability to deliver on Trumponomics (see analysis here).
Looking at the market pricing, we still think it is too the soft side. While the June hike is priced in by 80%, the markets have priced one and half hikes for the rest of the year and a total of 2.7 hikes from now until year-end 2018.
Fed outlines quantitative tightening principles
Before the release, we said we would look for any comments on the Fed's desire to reduce the size of its balance sheet (quantitative tightening) and we were not left disappointed. 'Nearly all' FOMC members think it would be appropriate to begin quantitative tightening later this year (most have indicated in speech end-2017 is most likely).
The minutes state that quantitative tightening will be conducted 'in a gradual and predictable manner'. The staff proposes that the FOMC announces a set of gradually increasing caps/limits on the dollar amounts of bonds that will be allowed to run off each month and only reinvest the amounts that exceeded the caps each month. The caps will be set at low levels and then raised every three months (corresponding to every other meeting, although the Fed will likely not vote on this every month, as many FOMC members have argued it should run in the background). When the final values of the caps are reached, the caps will be maintained and the balance sheet will continue to shrink until the target is reached.
The minutes also say that the FOMC members agreed to amend Committee's Policy Normalization Principles and Plans “soon”. We are still missing the triggers for actually starting quantitative tightening (based on the minutes from the March meeting, 'several participants' prefer a quantitative threshold, which could be either a certain Fed funds target range or an economic variable (unemployment rate or inflation) like the previous Evans's rule), caps sizes and increases and target for the future level of the balance sheet. The FOMC members agreed to continue the discussions at the June meeting.
We think this supports our view that the Fed will come with the big announcement of the triggers for starting quantitative tightening in connection with the June meeting. Although the Fed strongly signals the beginning of quantitative tightening this year, we hold onto our long-held view that it will actually start in Q1 18 for now. We expect the Fed to begin very gradually by a smaller amount than what the Fed bought per month under the QE1 programme (USD30bn per month) but with the idea of increasing caps the amount may rise above this threshold during the reduction phase. In an optimistic scenario the Fed can reduce its balance sheet by USD1,700bn, in our view.
We have written extensively about the QT theme this year: Fed's Quantitative Tightening: Fixed Income Implications (6 April), FOMC Minutes: Quantitative tightening is moving closer (5 April) and Research US: Fed's regulatory hurdle for starting quantitative tightening (13 March).
Recent US research
- Research US: Trump's budget dead on arrival in Congress – do not expect too much of Trumponomics (24 May)
- FOMC review: Fed thinks weak GDP growth in Q1 was transitory (3 May)
- Fed's Quantitative Tightening: Fixed Income Implications (6 April)
- FOMC Minutes: Quantitative tightening is moving closer (5 April)
- Research US: Fed's regulatory hurdle for starting quantitative tightening (13 March)
USD/CAD Canadian Dollar Higher After Central Bank Holds Rate
The Bank of Canada kept rates unchanged but statement was not all dovish
The Canadian dollar is higher against the US dollar after the Bank of Canada (BoC) kept rates unchanged at 0.50 percent. The release of minutes from the Fed’s May meeting was full of surprises, but still felt short of the market expectations which are pricing in a rate hike in the upcoming June 13/14 Federal Open Market Committee (FOMC) meeting.
The BoC managed to balance its dovish assessment of the economy with the potential opportunity as there is still excess capacity. The housing market remains a concern as it is too early to tell if the latest moves by the provincial government in Ontario after following the lead of British Columbia and the problems at Home Capital Trust have had a real impact on prices. The central bank has put rate cuts off the table since earlier this year, but there are no real possibilities of a rate hike until 2018. Trade will remain a challenge as the US has begun the 90 day period before holding a renegotiation meeting with Canada and Mexico.
The Fed Minutes released today brought insights about the central bank’s next steps on rate policy and its balance sheet reduction plans. Fed members discussed that a rate hike would be appropriate soon. The market agrees, already pricing in a 83.1 percent probability of a rate hike in the upcoming June FOMC meeting, although through to its cautious nature the Fed did add that it would have to be dependant on strong economic data. Central bank officials are calling the slowdown in the first quarter as transitory and expect the US economy to recover. The Fed surprised with a lot of details on their plans to shrinks their balance sheet. A three month increasing cap seems to be the plan going forward until reaching normalization.
Oil prices had initially risen with the combination of the bigger than expected drawdown in US weekly inventories and the upcoming meeting between Organization of the Petroleum Exporting Countries (OPEC) and other major producers in Vienna to discuss the extension to the production cut agreement put in place in January of this year. The agreement has stabilized prices but rising US production has kept crude at around current levels which is why an extension and a possible further decrease in supply might be needed.
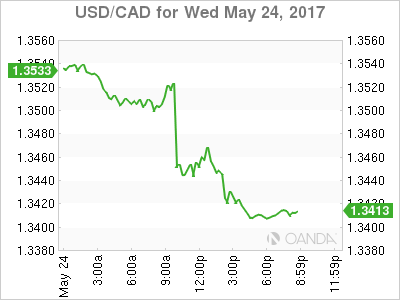
The USD/CAD lost 0.436 percent in the last 24 hours. The currency pair is trading at 1.3437 after the decision from the Bank of Canada (BoC) to leave benchmark rates untouched at record low 0.50 percent. The price of oil also boosted the loonie against the US dollar with the bigger than expected drawdown of 4.4 million barrels. The minutes form the U.S. Federal Reserve meeting in May were also released today, but although they kept the June rate hike on the table did not sway the market who has already priced in that decision by the central bank.
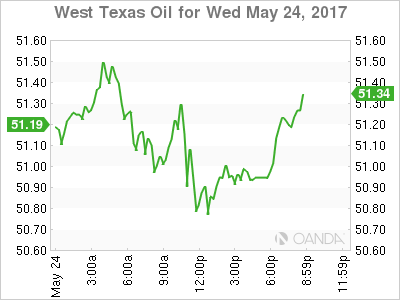
The price of oil lost 0.227 percent on Wednesday. The West Texas Intermediate is trading at $50.97 after the US weekly inventories were even lower than expected ahead of the Organization of the Petroleum Exporting Countries (OPEC) meeting on Thursday. The producers appear to be ready to extend by 6 to 9 months their historic deal to cut 1.8 million barrels per day but deeper cuts are still not ruled out as the final decision is yet to reached according to reports from Vienna.
Market events to watch this week:
Thursday, May 25
- 4:30 am GBP Second Estimate GDP q/q
- All Day ALL OPEC Meetings
- 8:30 am USD Unemployment Claims
Friday, May 26
- 8:30 am USD Core Durable Goods Orders m/m
- 8:30 am USD Prelim GDP q/q
Gold Flat as Federal Reserve Minutes Loom
Gold is showing little movement in the Wednesday session. In North American trade, spot gold is trading at $1251.36 an ounce. On the economic front, Existing Home Sales dropped sharply to 5.57 million, short of the forecast of 5.65 million. Later in the day, the Federal Reserve will release the minutes of its May policy meeting. On Thursday, the US will publish unemployment claims.
All eyes are on the Fed minutes, with the markets hoping to glean some clues about the timing of future rate moves. The Federal Reserve raised rates back in March, and the markets expect the Fed to press the rate trigger at the June policy meeting. The odds of a rate hike have increased to 83%, according to the CME Group. Just last week, the likelihood of a rate increase stood at 73%. Despite the market speculation, Fed policymakers are keeping their cards close to their chest, at least in their public appearances. On Tuesday, Philadelphia Fed President Patrick Harker said that a June move was a "distinct possibility", but cautioned that a weak inflation report could delay a rate hike. Earlier in the week, Robert Kaplan, President of the Dallas Fed, stated that three interest increases in 2017 was "appropriate". The Fed minutes are expected to underscore support for a June move, but may not shed much light on what happens after that. Still any clues about the Fed's rate plans could shake up the currency markets.
The markets are keeping a close eye on the Federal Reserve, which will release the minutes of the May policy meeting. June has been circled as the next rate move, although Fed policymakers have kept their cards close to their vests. On Tuesday, Philadelphia Fed President Patrick Harker said that a June move was a "distinct possibility", but cautioned that a weak inflation report could delay a rate hike. Earlier in the week, Robert Kaplan, President of the Dallas Fed, stated that three interest increases in 2017 was "appropriate". The minutes are unlikely to contain any major surprises, but could underscore support for a June move. Gold prices move inversely to interest rate moves, so any clues about further rate hikes this year could send gold to lower levels.
On Tuesday, the White House presented President Trump's 2018 budget proposal to Congress. Trump has promised to slash government spending, and the budget proposes major cuts to the Medicaid health program, disability benefits and food stamps. Trump has outlined an ambitious program to cut government spending by $3.6 trillion in the next 10 years and achieving a balanced budget by 2020. The budget also includes $25 billion for paid leave after childbirth and some $200 billion for infrastructure programs. It's a safe bet that Trump's budget will face tough opposition on Capitol Hill, with both Democrats and Republicans unlikely to go along with such deep cuts to social assistance programs. Still, with the Trump administration beset by Congressional investigations, the White House can point to the budget as a step forward in his agenda to cut government spending.
Pound Stays Close to 1.30, Markets Eye British GDP
GBP/USD has inched lower in the Wednesday session. In the North American session, the pair is trading at 1.2950. On the release front, there are no British events on the schedule. In the US, Existing Home Sales dropped sharply to 5.57 million, short of the forecast of 5.65 million. Later on, the Federal Reserve will release the minutes of its May policy meeting. On Thursday, the UK releases Second Estimate GDP, while the US will publish unemployment claims.
The British pound is having an uneventful week, but the situation in the UK is anything but quiet. The country is badly shaken after a horrific bombing at a Manchester rock concert killed 22 and injured 120 people. It was the worst terrorist attack on British soil since a bombing in London in 2005. The British government raised the terror threat level to "critical", the highest level. This move has raised speculation that another terror attack could be imminent on British soil. The attack has led to the suspension of the election campaign, with just 15 days to go before the vote. Prime Minister Theresa May is expected to win the election, but further attacks could rattle confidence in the government and shrink May's lead in the polls.
All eyes are on the Fed minutes, with the markets hoping to glean some clues about the timing of future rate moves. The Federal Reserve raised rates back in March, and the markets expect the Fed to press the rate trigger at the June policy meeting. The odds of a rate hike have increased to 83%, according to the CME Group. Just last week, the likelihood of a rate increase stood at 73%. Despite the market speculation, Fed policymakers are keeping their cards close to their chest, at least in their public appearances. On Tuesday, Philadelphia Fed President Patrick Harker said that a June move was a "distinct possibility", but cautioned that a weak inflation report could delay a rate hike. Earlier in the week, Robert Kaplan, President of the Dallas Fed, stated that three interest increases in 2017 was "appropriate". The Fed minutes are expected to underscore support for a June move, but may not shed much light on what happens after that. Still any clues about the Fed's rate plans could shake up the currency markets.
With President Trump still overseas on his first presidential trip, the White House presented Trump's 2018 budget proposal to Congress on Tuesday. Trump has promised to slash government spending, and the budget proposes major cuts to the Medicaid health program, disability benefits and food stamps. Trump has outlined an ambitious program to cut government spending by $3.6 trillion in the next 10 years and achieving a balanced budget by 2020. The budget also includes $25 billion for paid leave after childbirth and some $200 billion for infrastructure programs. It's a safe bet that Trump's budget will face tough opposition on Capitol Hill, with both Democrats and Republicans unlikely to go along with such deep cuts to social assistance programs. Still, with the Trump administration beset by Congressional investigations, the White House can point to the budget as a step forward in his agenda to cut government spending.
Bank of Canada: Policy Appropriate “At Present”
Our Take
The Bank made a subtle change in today's statement having maintained the overnight rate at 0.5% but stipulating that the degree of policy support remains appropriate "at present".
The tone of the Bank's assessment appears to be more upbeat as policymakers gave a nod to both global and domestic conditions having improved with the Bank anticipating "very strong growth in the first quarter". Moderating this enthusiasm was the persistence of subdued wage growth and core infla- tion measures remaining below 2%.
There have signs that the economy built a good head of steam over recent quarters and that the hand off to the second quarter was solid. Hours worked recovered in April and an alternative measure of wag- es showed growth averaged closer to 2% in recent months. Our monitoring of the data points to growth in the economy having strengthened with real GDP growth topping 4% in the first quarter driven by on- going household spending strength and a recovery in business investment.
While current conditions were viewed more positively, the Bank continues to be concerned about the uncertainties associated with US economic policy and specifically cited competitiveness challenges faced by Canadian exporters. The Bank said recent regulatory changes have not yet resulted in a "substantial cooling" in housing market activity. We expect that the rule changes to be sufficient to slow housing market activity but as long as expectations for rates to remain low persist, the risks is that hot markets will stay on a slow burn and do not expect consumer spending growth to weaken significantly. With business investment picking up in the first quarter, the opportunity for the Bank to shift the drivers of growth away from the financially extended consumer may be in the offing. The Bank acknowledged that the current degree of monetary policy support is needed today, however should the economy continue along this stronger growth path, we think it likely the Bank will shift away from its neutral stance and maintain our view that the Bank will be in position to raise the overnight rate in the first half of next year.