Sample Category Title
Weekly Focus: US and Euro Area Inflation Set to Decline
Market movers ahead
- In the US, the FOMC minutes from the May meeting may give more insight into what the members think about the timing of the next Fed hike and quantitative tightening. The week after, both PCE inflation and the jobs report for May are due for release.
- In the euro area, focus is on whether the PMI figures and ifo expectations will follow the weakness observed in the US and Chinese PMIs. May inflation figures are also due to be released.
- In the UK, focus remains on politics ahead of the general election on 8 June.
- In Scandinavia, there are a number of data releases including GDP growth figures for Q1 in Denmark and Sweden, Danish FX reserves and the Norwegian oil investment survey.
- OPEC meets on Thursday to decide on an extension of oil supply cuts. We expect cuts to be extended by six to nine months.
Global macro and market themes
- Volatility in markets is set to increase as the cycle turns lower.
- The USD's fall and EUR's strength is as expected given the divergence in economic performance. We remain medium-term EUR/USD bullish.
- We expect fixed income markets to range-trade with a possible slight bullish bias near term on the lower cycle and falling inflation expectations.
- We have turned near-term bearish on equities, as we are in the interim period between two reflation periods.
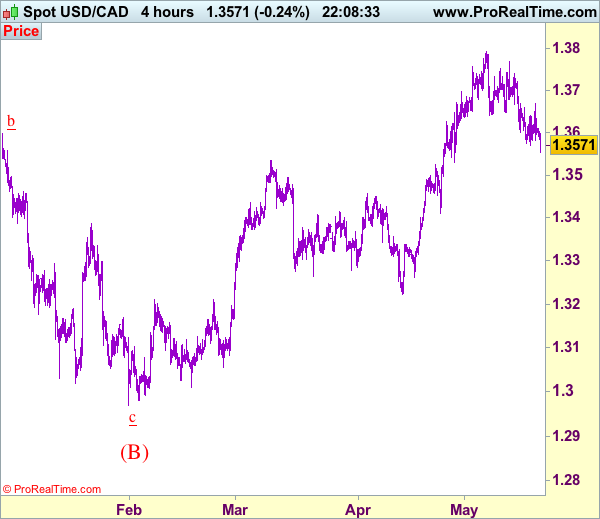
Trade Idea: USD/CAD – Buy at 1.3530
USD/CAD - 1.3563
Recent wave: Only wave v of c has ended at 0.9407 and wave C of major A-B-C correction is underway for headway to 1.4700
Trend: Near term up
Original strategy :
Buy at 1.3535, Target: 1.3735, Stop: 1.3475
Position: -
Target: -
Stop: -
New strategy :
Buy at 1.3530, Target: 1.3730, Stop: 1.3470
Position: -
Target: -
Stop:-
As the greenback has slipped again after meeting resistance at 1.3670, retaining our view that further sideways trading would be seen and near term downside risk remains for the fall from 1.3794 top to bring retracement of recent rise, hence weakness towards support at 1.3530 is likely, however, reckon downside would be limited and bring rebound later, above 1.3670 would bring another bounce to 1.3700 but break of 1.3740-45 is needed to signal the pullback from recent high at 1.3794 has ended, bring test of 1.3770 resistance first, then towards 1.3794. Looking ahead, only a break above there would confirm recent upmove has resumed and extend further gain to 1.3840-50, then towards 1.3900.
In view of this, we are inclined to buy again on further corrective fall as 1.3530 support should limit downside and bring another rise later. A firm break below 1.3530 would abort and suggest a temporary top is formed, bring retracement of recent upmove to 1.3500 and later towards 1.3450-60 but support at 1.3411 should remain intact, bring another upmove later.
To recap, wave B from 1.3066 is unfolding as an a-b-c and is sub-divided as a: 1.2192, b: 1.2716 and wave c is a 5-waver with i: 1.1983, ii: 1.2506, extended wave iii with minor iii at 1.0206, wave iv ended at 1.0781 and wave v as well as wave iii has ended at 0.9931, hence the subsequent choppy trading is the wave iv which is unfolding as (a)-(b)-(c) with (a) leg of iv ended at 1.0854, followed by (b) leg at 1.0108 and (c) leg as well as the wave iv ended at 1.0674. The wave v is sub-divided by minor wave (i): 0.9980, (ii): 1.0374, (iii): 0.9446, (iv): 0.9913 and (v) as well as v has possibly ended at 0.9407, therefore, consolidation with upside bias is seen for major correction, indicated target at 1.3700 and 1.4000 had been met and further gain to 1.4700 would be seen later.
Technical Outlook: Spot Gold Emerged above Daily Cloud
Spot Gold emerged above daily cloud and bounced to $1254 barrier (daily Kijun-sen) after Thursday's $20 pullback from fresh over two weeks high at $1265 was contained at $1245. The support is formed by broken Fibo 38.2% of $1295/$1214 and converged 200/20 and 30 SMA's. Break and close above Kijun-sen pivot would re-attract Thursday's high at $1265. Otherwise, $1245 support is expected to remain vulnerable, as bearish signals are generated on reversal of slow stochastic and double bear-cross (20/200SMA and 20/30 SMA). Sustained break below $1245 pivot would risk attack at $1240 (daily cloud base/Tenkan-sen) and $1233 (Fibo 61.8% of $1214/$1265 rally) in extension.
Res: 1254; 1261; 1265; 1270
Sup: 1249; 1245; 1240; 1233
Canada: Retail Sales Bounce Back in March
Following a slight pullback in February, Canadian retail sales bounced back, rising 0.7% in March. In real terms, volumes were up by a robust 1.2% during the month.
The gains were driven in large part by sales at motor vehicle and parts dealers (+3.2%), electronics and appliance stores (+3.1%) and general merchandise stores (+1.4%).
Providing some offset were sales at clothing and accessories stores (-2.7%), food and beverage stores (-0.7%) and at gasoline stations (-0.9%), driven largely by lower prices.
Regionally, the gains were widespread with Alberta, Quebec and Newfoundland and Labrador the only provinces to record lower retail sales during the month. Ontario (+0.9%) and B.C. (+2.3%) accounted for the bulk of the gains.
Key Implications
For the first quarter as a whole, retail sales volumes were up 1.9%, and will thus be a key contributor to overall economic growth during the quarter, which is now tracking a robust 4.0% annualized. March's strong print also provides a solid handoff for Q2.
While some cooling in the housing market may filter through to softer demand for housing-related retail items, an overall healthy domestic economy should underpin modest growth in retail volumes going forward. Indeed, we expect consumer spending to advance at a decent clip of around 2% over the remainder of the year, continuing to be a key pillar of growth in the Canadian economy.
That said, there are a number of risks that could throw the Canadian economy off course, including policy changes stateside - particularly with respect to trade - and a cooling housing market. As such, the Bank of Canada is likely to remain on the sidelines for some time still.
Canada: Little in the Way of Inflation in April, Prices Up 1.6% Year-on-Year
Consumer price inflation was unchanged at 1.6% (year-on-year) in April. Prices were up 0.5% month-on-month (seasonally adjusted), following a 0.3% decline in March.
An acceleration in energy price growth helped pull up the headline number. Energy prices are up 9.6% year-on-year, up from 8.5% in the month prior. Food prices rose 0.5% (month-on-month), but are still negative on a year-on-year basis (-1.1%, up from -1.9% in March).
Weak goods inflation (+0.8%) is the main thing holding back price growth. Services price growth is stronger at 2.5% (up from 2.2% in March).
The Bank of Canada's core measures were either flat or down, with CPI-median edging down to 1.6% (from 1.7%), CPI-trim to 1.3% (from 1.4%), and CPI-common unchanged at a feeble 1.3%.
Key Implications
This was yet another month of soft inflation in Canada. With both weak headline and core measures, there is little to get excited about in terms of price pressures. This stands in contrast to other data which point to even stronger economic growth (we're tracking 4.0% for the first quarter, with a robust handoff at the end of the quarter suggesting the second quarter will not disappoint).
The easiest way to square this circle is that Canada is operating with a fair degree of economic slack, but absorbing it quickly. Based on our outlook for economic growth, Canada will close its output gap by the end of this year. While the outlook is marked by considerable downside risks (oil, housing, trade with the U.S.), there are also upsides (namely increasing support from public infrastructure spending). As long as growth continues, it will put the Bank of Canada in a position to begin raising interest rates in the spring of next year.
Canadian Inflation Rate Steady in April; Core Rates Edged Lower
Highlights:
- The year-over-year rate of headline CPI inflation was unchanged at 1.6% in April.
- Expectations were for a modest rise to 1.7%, matching the Bank of Canada's Q2 forecast.
- Energy price inflation picked up slightly to 9.6% year-over-year as higher gasoline prices continued to put upward pressure on headline inflation.
- Food prices remained a source of downward pressure, though less so than in recent months as the most significant period of food price deflation in 25 years is gradually coming to a close.
- Prices excluding food and energy were up just 1.5% from last April, the slowest rate in nearly three years.
- The BoC's core measures averaged 1.4%, down from 1.5% in March. Both CPI-trim and CPI-median have fallen by 0.3 ppts since the start of the year while CPI-Common is little changed.
Our Take:
The expected rise in headline inflation did not materialize as a more modest pace of core inflation fully offset a further increase in energy prices and some easing in food price deflation. Underlying inflation has clearly moderated so far this year—two of the Bank of Canada's three core measures have declined, ex-food and energy inflation has slipped lower, and a diffusion index shows just 40% of CPI components are rising at 2% or faster, down from close to 50% two months ago. Softer inflation is surprising given strong economic growth in recent quarters, though a similar pattern is being seen in the labour market where robust job gains and a lower unemployment rate have been accompanied by slowing wage growth. Both inflation and wages seem to reinforce the Bank of Canada's view that the economy has more room to run before inflationary pressure builds, and if anything, the recent dip in inflation might be seen as evidence that slack is slightly greater than their current estimate. Along with concerns surrounding the outlook for trade and investment, today's inflation report will lend support to the Bank maintaining a cautious tone in their policy announcement next week, which we think will reinforce market expectations that a rate hike is unlikely this year.
Canadian Retail Sales Up Again in March
Highlights:
- Nominal retail sales rose 0.7%, led by a 3.2% increase in motor vehicle sales with partial offset from lower food sales and a price-led drop in gasoline station receipts.
- Sales volumes jumped a stronger 1.2% following an upwardly revised 0.2% gain (was a 0.1% decline) in February.
- 'E-commerce' sales, not all of which are included in the headline retail sales numbers, surged 43% from a year ago, easily outpacing the increase in retail sales.
Our Take:
The 1.2% jump in March retail sale volumes marked a third consecutive monthly increase - and eighth out of the last nine- to polish off a strong first quarter spending gain. Sale volumes in Q1/17 were up 8% from Q4 (at an annualized rate), somewhat surprisingly building on a 7.5% increase in Q4. The combined 2-quarter run is the strongest on record since the second quarter of 2004. The fundamental economic backdrop for households has generally continued to improve with strong growth in employment offsetting disappointingly modest wage growth to-date in 2017. Overall growth in the economy has also strengthened (we expect a 3.8% Q1 GDP rise) with early evidence suggesting that ongoing household spending strength was coupled with stronger business investment. The Bank of Canada, however, will likely remain concerned by ongoing uncertainty about the future of Canada's trading relationship with the U.S. and weak underlying inflation trends, including slowing growth in their preferred measures of 'core' CPI inflation in April also released this morning. The result is interest rates are likely to remain low even as labour markets and household incomes continue to improve. New regulatory measures may yet be successful at slowing housing market activity; however, absent a significant shock in labour markets, there is little reason to expect consumer spending growth trends to weaken significantly after already accounting for a record share of GDP in 2016.
USD/CHF Mid-Day Outlook
Daily Pivots: (S1) 0.9763; (P) 0.9793; (R1) 0.9828; More.....
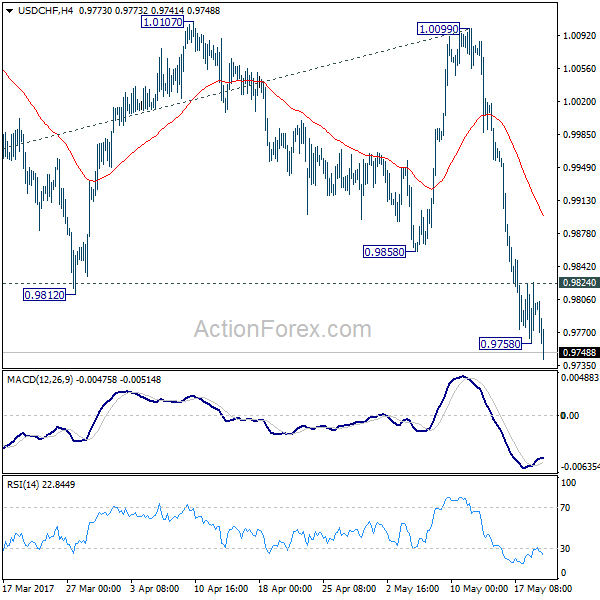
USD/CHF's fall resumed after brief consolidation and intraday bias is back on the downside. Current fall from 1.0099 is part of the pattern from 1.0342 and should target 100% projection of 1.0342 to 0.9860 from 1.0099 at 0.9617. On the upside, above 0.9824 minor resistance will turn intraday bias neutral again and bring consolidations first, before staging another fall.
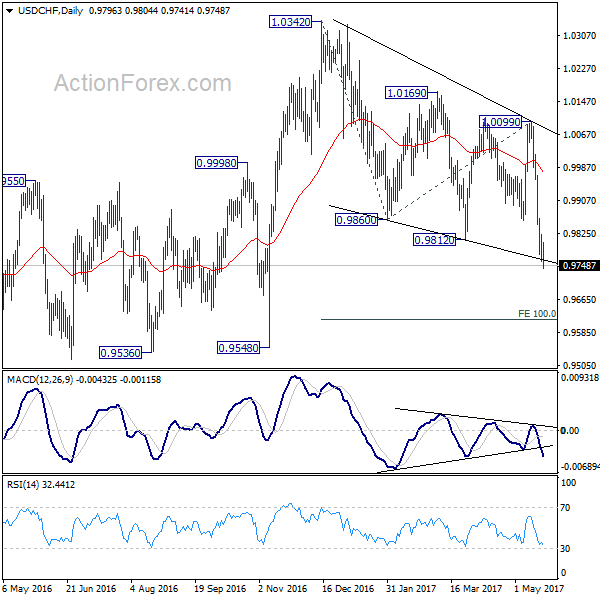
In the bigger picture, USD/CHF is bounded in medium term range of 0.9443/1.0342 for the moment. Consolidative trading would likely continue and medium term outlook remains neutral. Break of 1.0342 key resistance is needed to confirm underlying bullish momentum in the pair. Meanwhile, downside attempts should be contained by 0.9443 key support level.
USD/JPY Mid-Day Outlook
Daily Pivots: (S1) 110.56; (P) 111.14; (R1) 112.06; More...
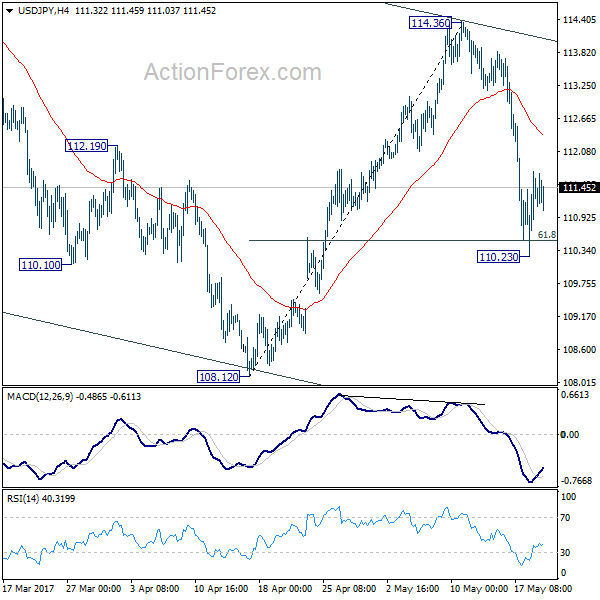
Intraday bias in USD/JPY remains neutral for consolidation above 110.23 temporary low. As recovery from 110.23 is corrective in structure, we'd favor more downside ahead. Below 110.23 will turn bias to the downside for 108.12 low. In that case, the whole decline from 118.65 would likely extend through 108.12 to 61.8% retracement of 98.97 to 118.65 at 106.48.
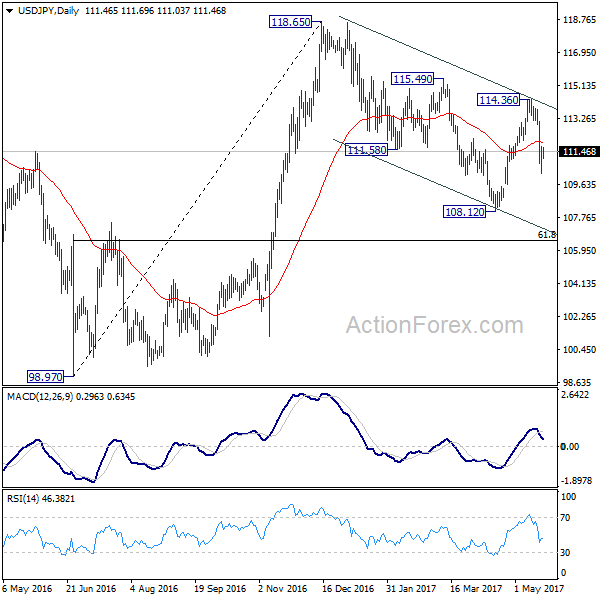
In the bigger picture, price actions from 125.85 high are seen as a corrective pattern. It's uncertain whether it's completed yet. But in case of another fall, downside should be contained by 61.8% retracement of 75.56 to 125.85 at 94.77 to bring rebound. Overall, rise from 75.56 is still expected to resume later after the correction from 125.85 completes.
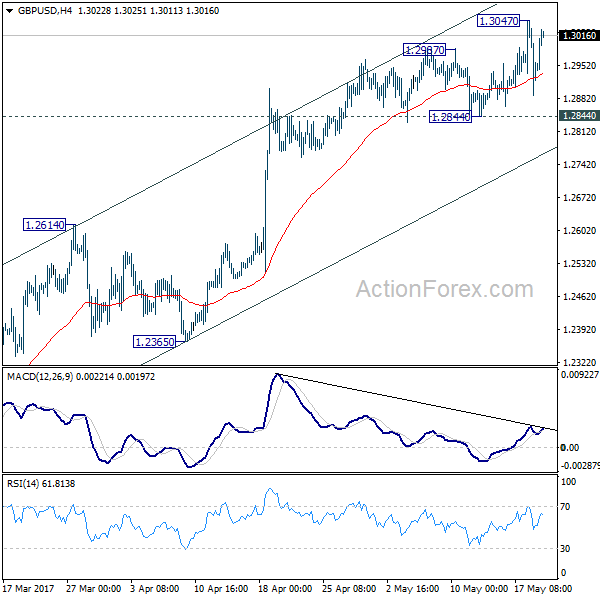
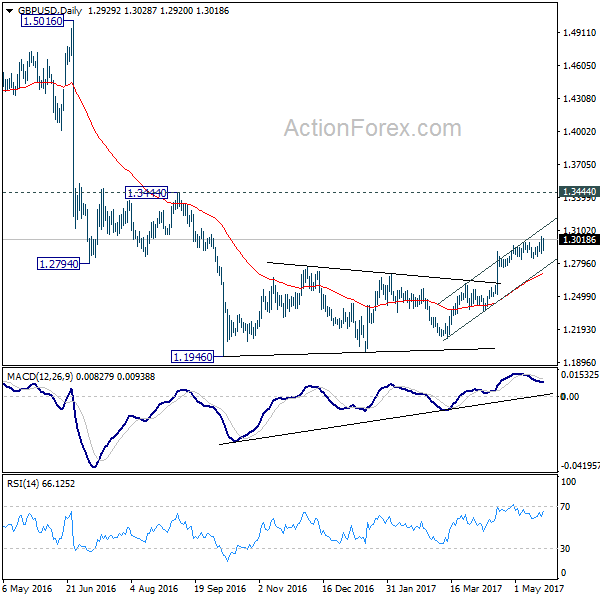
GBP/USD Mid-Day Outlook
Daily Pivots: (S1) 1.2869; (P) 1.2958; (R1) 1.3029; More...
Intraday bias in GBP/USD remains neutral for the moment. With 1.2844 support intact, further rise is still in favor in the pair. However, as price actions from 1.1946 are still viewed as a corrective pattern, we'd expect upside to be limited below 1.3444 to complete the correction. Meanwhile, break of 1.2844 will be a strong sign of near term reversal, on bearish divergence condition in 4 hour MACD. In such case intraday bias will be turned back to the downside for 1.2614 resistance turned support first.
In the bigger picture, fall from 1.7190 is seen as part of the down trend from 2.1161. There is no sign of medium term reversal yet. Sustained trading below 61.8% projection of 2.1161 to 1.3503 from 1.7190 at 1.2457 will target 100% projection at 0.9532. Overall, break of 1.3444 resistance is needed to confirm medium term bottoming. Otherwise, outlook will remain bearish.