
Sample Category Title
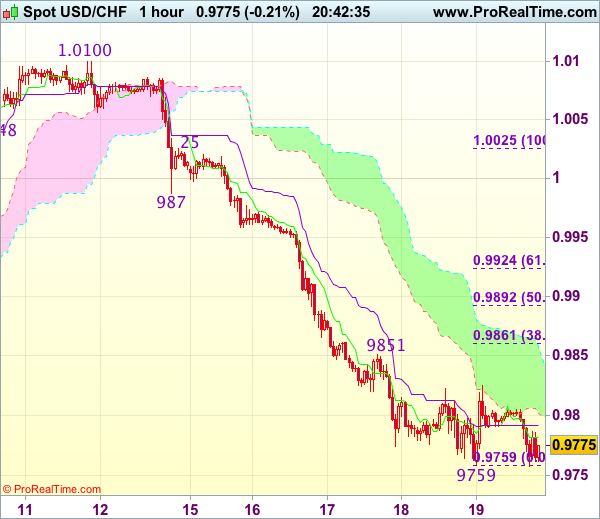
Trade Idea Update: USD/CHF – Sell at 0.9850
USD/CHF - 0.9752
Original strategy :
Sell at 0.9870, Target: 0.9770, Stop: 0.9905
Position : -
Target : -
Stop : -
New strategy :
Sell at 0.9850, Target: 0.9750, Stop: 0.9885
Position : -
Target : -
Stop : -
As dollar has fallen again after brief recovery, suggesting recent selloff from 1.0344 top is still in progress and bearishness remains for this move to extend further weakness to 0.9735-40 (76.4% retracement of 0.9550-1.0344), then towards 0.9700, however, near term oversold condition should prevent sharp fall below 0.9675-80 and reckon 0.9650 would hold from here, risk from there is seen for a rebound to take place later.
In view of this, would not chase this fall here and would be prudent to sell dollar on recovery as 0.9850-55 should limit upside. Above 0.9870-80 would defer and risk rebound to 0.9900 but upside should be limited to 0.9940-50 and price should falter well below previous support at 0.9987, bring another decline.
EUR/USD Mid-Day Outlook
Daily Pivots: (S1) 1.1061; (P) 1.1116 (R1) 1.1157; More....
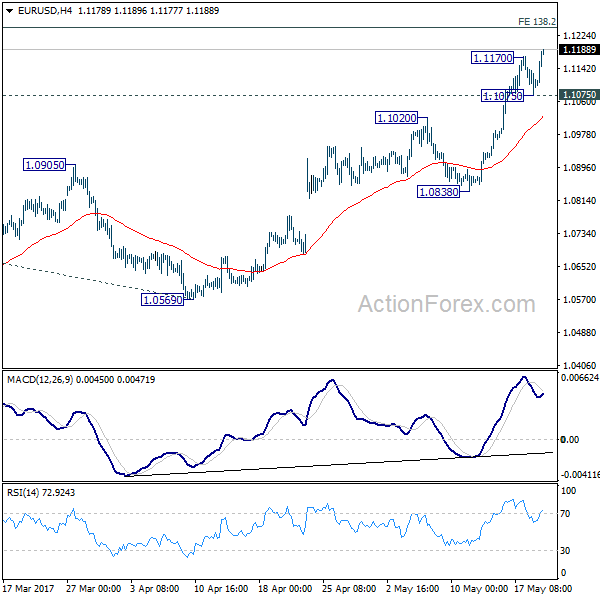
EUR/USD's rally resumed after brief consolidation and hits as high as 1.1188 so far. Intraday bias is back on the upside. Current rise from 1.0569 is seen as part of the rebound from 1.0339 and would target 138.2% projection of 1.0339 to 1.0828 from 1.0569 at 1.1245, which is close to 1.1298 key resistance. For now, we'd be cautious on strong resistance between 1.1245/1298 to limit upside and bring reversal. On the downside, below 1.1075 minor support will turn intraday bias neutral first. But break of 1.0838 support is needed to indicate reversal. Otherwise, further rally will remain in favor.
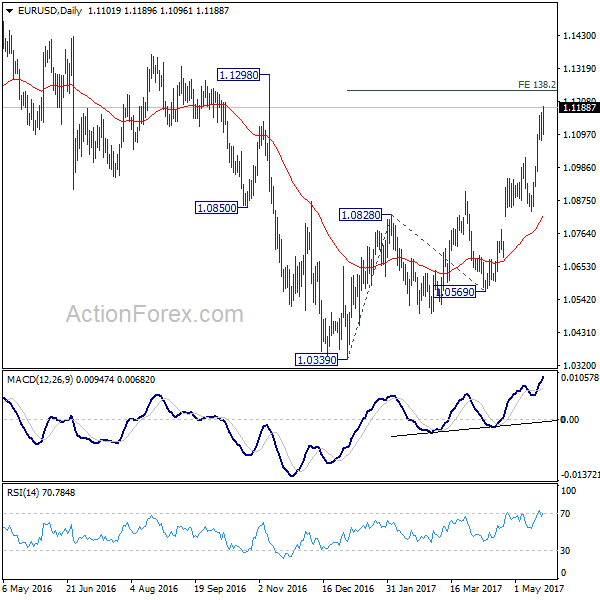
In the bigger picture, as long as 1.1298 key resistance holds, whole down trend from 1.6039 (2008 high) is still expected to continue. Break of 1.0339 low will send EUR/USD through parity. However, considering bullish convergence condition in weekly MACD, break of 1.1298 will indicate long term reversal. In such case, further rally would be seen back to 1.2042 support turned resistance next.
Euro Rally Resumes on ECB Expectations, Dollar Recovery Short Lived
Euro extends recent rally against dollar today with EUR/USD hitting as high as 1.1188 so far. The common currency continues to draw support from expectation of a hawkish twist in ECB's June meeting. Also, based on recent solid economic data, there is realistic chance of upward revisions in the central bank's staff projections to be released at that meeting. Indeed, Euro's strength is even clearer considering that fact that it now overtakes Yen as the second strongest major currency for the week, following Swiss Franc. On the other hand, Dollar's recovery was weak and short lived as it's also back under some selling pressure against Sterling.
ECB Vasiliauskas: To discuss changing forward guidance in June
ECB Governing Council member Vitas Vasiliauskas said the ECB could consider tweaking its forward guidance to reflect that it's now closer to stimulus exit. He noted that "everybody is prepared to discuss forward guidance in June". He prefers to "take a look into the hard data" and then discuss the "speed of changing of communications". Nonetheless, he also emphasized to keep the sequence of the exit. That is, ECB shouldn't raise interest rate from the current negative level before ending the asset purchase program by the end of the year. Also, Vasiliauskas said that he would "wait for maybe autumn" regarding to "possible decision". But he prefer not to wait till December as that "would probably be too late". He pointed out "then you have not enough space or room before the program ends."
Divorce bill a most difficult topic in Brexit negotiation
EU's chief Brexit negotiator Michael Barnier pointed out in a European Commission meeting that UK's "divorce bill" is doubtlessly one of the "most difficult in the negotiation". It's believed that Germany and France would refuse to pay more to EU budget to cover UK's departure. Meanwhile, member states would also object to getting less funding in projects financed under the EU framework. And, it's believed that European Commission President Juncker expressed his doubt on Barnier's target of concluding the deal by the end of the year and noted that was "over-optimistic".
The size of the "divorce bill" was first estimated to be at EUR 60b and was raised to EUR 100b then. Nonetheless, according to a report from the Institute of Chartered Accountants, the amount owed by UK to EUR could be at little as GBP 5b and won't be higher than GBP 30b. While this not the official positions of either UK or EU, the news was a clear reflection of the discrepancies in the way both sides see the matter. And as the negotiation starts after UK election on June 8, noise level will increase which could further complicate the negotiations.
On the data front...
Released from Canada, retails sales rose more than expected by 0.7% mom in March, versus consensus of 0.3% mom. Ex-auto sales dropped -0.2% mom versus expectation of 0.2% mom. Headline CPI was unchanged at 1.6% yoy, below expectation of 1.7% yoy. CPI core common was unchanged at 1.3% yoy, trim slowed to 1.3% yoy, median slowed to 1.6% yoy. Released early today, UK CBI trends total orders rose to 9 in May. Eurozone current account surplus narrowed to EUR 34.1b in March. German PPI rose 0.4% mom, 3.4% yoy in April.
EUR/USD Mid-Day Outlook
Daily Pivots: (S1) 1.1061; (P) 1.1116 (R1) 1.1157; More....
EUR/USD's rally resumed after brief consolidation and hits as high as 1.1188 so far. Intraday bias is back on the upside. Current rise from 1.0569 is seen as part of the rebound from 1.0339 and would target 138.2% projection of 1.0339 to 1.0828 from 1.0569 at 1.1245, which is close to 1.1298 key resistance. For now, we'd be cautious on strong resistance between 1.1245/1298 to limit upside and bring reversal. On the downside, below 1.1075 minor support will turn intraday bias neutral first. But break of 1.0838 support is needed to indicate reversal. Otherwise, further rally will remain in favor.
In the bigger picture, as long as 1.1298 key resistance holds, whole down trend from 1.6039 (2008 high) is still expected to continue. Break of 1.0339 low will send EUR/USD through parity. However, considering bullish convergence condition in weekly MACD, break of 1.1298 will indicate long term reversal. In such case, further rally would be seen back to 1.2042 support turned resistance next.
Economic Indicators Update
| GMT | Ccy | Events | Actual | Forecast | Previous | Revised |
|---|---|---|---|---|---|---|
| 06:00 | EUR | German PPI M/M Apr | 0.40% | 0.20% | 0.00% | |
| 06:00 | EUR | German PPI Y/Y Apr | 3.40% | 3.20% | 3.10% | |
| 08:00 | EUR | Eurozone Current Account (EUR) Mar | 34.1B | 32.3B | 37.9B | 37.8B |
| 10:00 | GBP | CBI Trends Total Orders May | 9 | 4 | 4 | |
| 12:30 | CAD | Retail Sales M/M Mar | 0.70% | 0.30% | -0.60% | -0.40% |
| 12:30 | CAD | Retail Sales Less Autos M/M Mar | -0.20% | 0.20% | -0.10% | |
| 12:30 | CAD | CPI M/M Apr | 0.40% | 0.50% | 0.20% | |
| 12:30 | CAD | CPI Y/Y Apr | 1.60% | 1.70% | 1.60% | |
| 12:30 | CAD | CPI Core - Common Y/Y Apr | 1.30% | 1.40% | 1.30% | |
| 12:30 | CAD | CPI Core - Trim Y/Y Apr | 1.30% | 1.40% | ||
| 12:30 | CAD | CPI Core - Median Y/Y Apr | 1.60% | 1.70% | ||
| 14:00 | EUR | Eurozone Consumer Confidence May A | -3 | -4 |
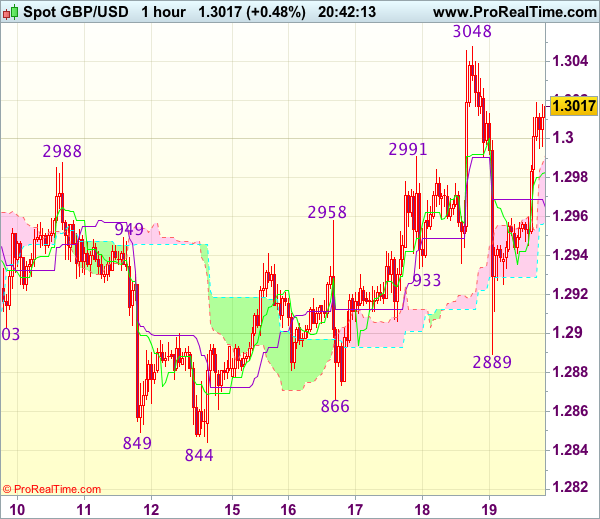
Trade Idea Update: GBP/USD – Stand aside
GBP/USD - 1.3021
Original strategy :
Sold at 1.2990, stopped at 1.3025
Position : - Short at 1.2990
Target : -
Stop : - 1.3025
New strategy :
Stand aside
Position : -
Target : -
Stop : -
Despite falling sharply from 1.3048 to 1.2889, the subsequent stronger-than-expected rebound has dampened our near term bearishness and gain to 1.3048 resistance (yesterday’s high) cannot be ruled out, however, break there is needed to signal recent upmove has resumed an extend further gain to 1.3075-80 and possibly towards 1.3100-10 later.
In view of this, would not chase this rise here and would be prudent to stand aside in the meantime. Below 1.2955-60 would prolong consolidation and risk weakness to 1.2930-40 but said support at 1.2889 should remain intact and bring another rebound later.
Trade Idea Update: EUR/USD – Stand aside
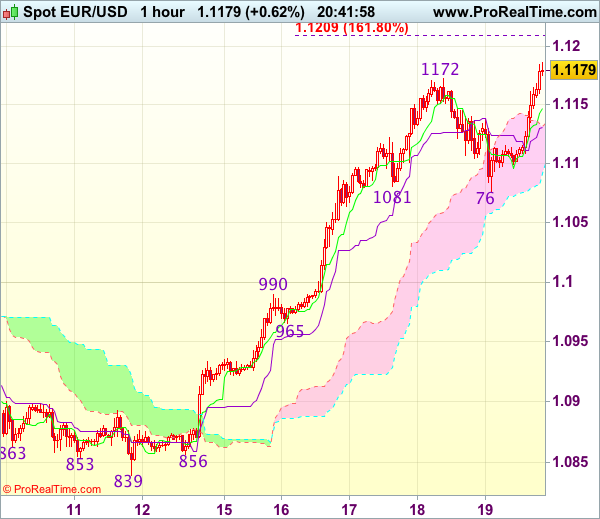
EUR/USD - 1.1178
Original strategy :
Buy at 1.1055, Target: 1.1155, Stop: 1.1020
Position : -
Target : -
Stop : -
New strategy :
Stand aside
Position : -
Target : -
Stop : -
Although current break of indicated previous resistance at 1.1172 confirms recent upmove has resumed and may extend further gain to 1.1205-10 (1.618 times projection of 1.0839-1.0990 measuring from 1.0965), loss of momentum should limit upside and reckon 1.1250 would hold from here, risk from there is seen for a retreat later.
In view of this, would not chase this rise here and would be prudent to stand aside in the meantime. Below the Tenkan-Sen (now at 1.1147) would defer and bring test of the Kijun-Sen (now at 1.1131), break there would suggest top is possibly formed, risk correction to 1.1100 but reckon support at 1.1076 (yesterday’s low) would hold from here.
Trade Idea Update: USD/JPY – Sell at 112.05
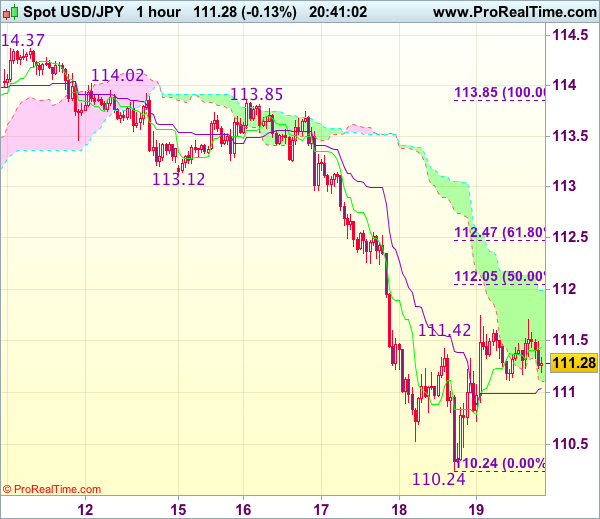
USD/JPY - 111.31
Original strategy :
Sell at 112.05, Target: 110.85, Stop: 112.40
Position : -
Target : -
Stop : -
New strategy :
Sell at 112.05, Target: 110.85, Stop: 112.40
Position : -
Target : -
Stop : -
Dollar’s rebound after falling to 110.24 suggests consolidation above this level would be seen and corrective bounce to 112.00-05 (50% Fibonacci retracement of 113.85-110.24) cannot be ruled out, however, reckon upside would be limited and bring another decline later, below 110.70-75 would suggest the rebound from 110.24 has ended, bring retest of this level first.
In view of this, would not chase this fall here and would be prudent to sell dollar on subsequent recovery as 112.05-10 should limit upside and bring another decline. Above 112.35-40 would defer and signal low is formed instead, risk a stronger rebound to 112.65-70.
GBP/CHF Could Start Correction Soon
The GBP/CHF has formed a regular bullish divergence at Daily L5 support and currently shows a potential for upside correction. The POC zone 1.2665-75 (Multiple bottom, ATR pivot, historical buyers) might spike the price towards L4 and L3 (1.2759 and 1.2828). Have in mind that L4 (1.2759) is a strong resistance and price needs to break above potential head and shoulders pattern to proceed further up. At this point the price is supported by POC zone and bullish divergence and until 1.2759 is hit we should see an upside price action.
Equities Bounce Back After Midweek Sell-Off
It's been one of the quieter days of the week so far in terms of major news flow or economic data and yet, equities are anything but flat as we near the US open, with the events of the previous days continuing to have an impact.
Trump distraction fades as markets bounce back from midweek sell-off
Wednesday's sell-off in equity markets got many people worried about whether the political circus in the US was finally starting to take its toll on investor appetite at the near-record levels. What we've seen since though would clearly suggest otherwise and instead indicate that the moves two days ago were nothing more than a combination of the usual Trump distraction combined with technical levels giving way.
The distraction is obviously undesirable, especially if it develops into anything more, but as it is investors appear relatively confident that it will pass, leaving the administration to focus on the policies that are largely responsible for markets being at these levels, tax reform and spending. The last few months has been something of a waiting game for investors as we await further news on taxes and fiscal stimulus, leaving the S&P and Dow bouncing around between 2,320 and 2,405, and 20,350 and 21,170, respectively. Only a break below here would suggest to me that investors are losing confidence.
FTSE weighed down by GBP rebound following Thursday's mini flash crash
In Europe, the FTSE's run this morning has been a little hampered by sterling's resurgence, which comes following a mini flash crash after the European session on Thursday. The stronger pound can weigh on the FTSE, due to its substantial foreign exposure, and that appears to be happening today. The pound is still currently looking a little overextended at these levels and last night's moves are another reminded of its vulnerability. Should it fail to break above 1.3048 against the dollar, it may suggest the pair has topped for now.
Oil boosted by reports that OPEC considering deepening and extending cuts
Oil is trading higher once again today, supported once again by the prospect of a nine month extension to the current output deal. Reports this morning that OPEC is considering not just extending but also deepening the cuts in a bid to bring the market back into balance is likely supporting the move, with Brent and WTI now on course for their seventh winning session in eight. Of course, just because OPEC is considering this and the Russian energy minister has suggested a willingness to support an extension, it doesn't mean it will happen, especially with regards to the deeper cuts as reported this morning.
EUR/USD Bulls Approach Major Resistance at 1.1200
EUR/USD has remained bullish and rallied notably around 2.7% since May 15, helped by the recent slump in the USD.
EUR/USD saw a correction on May 18, as a result of the rebound of USD.
Friday morning, during early European session, EUR/USD rallies again and approaches the significant psychological resistance level at 1.1200, due to the weakening of USD.
Currently, the bullish momentum remains strong, the short term moving averages still edge up.
If the resistance level at 1.1200 is broken, we can expect that the price will go further up.
Conversely, if the bulls fail to break the resistance, we will likely see a correction.
The resistance level is at 1.1170, followed by 1.1200.
The support line is at 1.1130, followed by 1.1100.
CAC Steady Ahead Of Eurozone Current Account, Consumer Confidence
The France CAC index has edged higher in the Friday session. Currently, the CAC is trading at 5370.80, up 0.50 percent. On the release front, it's a quiet day. The eurozone current account surplus came in at EUR 34.1 billion in March. This was lower than the February reading, but beat the estimate of 32.3 billion. Later in the day, we'll get a look at consumer confidence, which is expected to improve to -3 points.
Global stock markets have suffered losses this week, and the CAC index has dropped 1.9%, largely due to the political turmoil in Washington, which has made investors jittery. The Trump administration has not had much success in damage control, and there is no sign of the political firestorms letting up any time soon. President Trump has endured a rocky start to his term, but last week may have been his worst one of all. The US Justice Department, under strong pressure from Congress, has appointed a former FBI director as a special prosecutor to investigate possible Russian involvement in the US presidential election as well as any connection between Trump and the Russians during the election campaign. President Trump fired back on Thursday, angrily denouncing this move as a “witch hunt”. The media and the Democrats have had a field day with Trump's troubles, and even Republicans are expressing unease with an administration that appears rudderless and is staggering from crisis to crisis. Trump has been relentlessly dogged by accusations of being cozy with the Russians, and his meeting with the Russian foreign minister last week was a public relations disaster, as the president came under heavy criticism for releasing classified information at the meeting. The latest string of controversies has had a chilling effect on global stock markets, and the downward trend could continue if the crisis in Washington worsens.
The eurozone economy is showing stronger growth, and inflation levels have also picked up. Final CPI for April posted a strong gain of 1.9%, matching the forecast. This was considerably higher than the March gain of 1.5%. Eurozone inflation is once again closing in on the ECB's target of 2.0%, which could increase pressure on the ECB to consider tapering its ultra-loose monetary policy. However, the ECB seems content to hold course on interest rates and its quantitative easing program, and the central bank will be reluctant to make any moves with key elections coming up in France and Germany.