Sample Category Title
USD/CHF Elliott Wave Analysis
USD/CHF – 0.9778
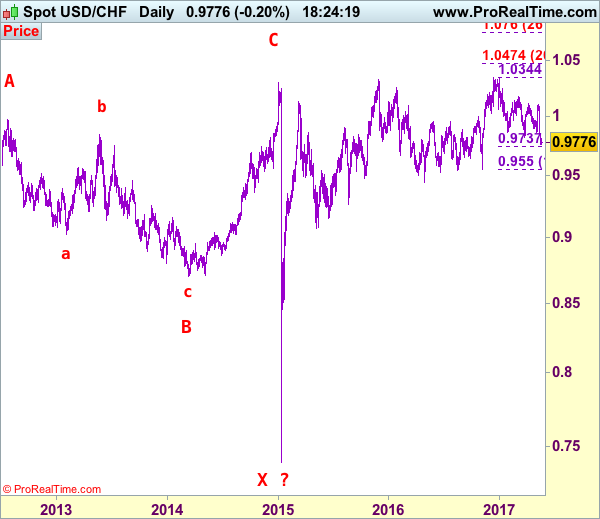
USD/CHF – Wave IV ended at 1.1730 and wave V has possibly ended at 0.7068
As the greenback dropped sharply after faltering below indicated previous resistance at 1.0108 and broke below previous support at 0.9813, confirming another leg of major decline from 1.0344 top is underway and bearishness is seen for further weakness to 0.9735-40, then 0.9675-80, however, near term oversold condition should prevent sharp fall below 0.9600-10 and price should stay well above previous support at 0.9550, risk from there is seen for a rebound to take place later.
Our preferred count on the daily chart is that early selloff to 0.9630 is an end of the larger degree wave III and major correction is unfolding from there with a leg ended at 1.2298 (Nov 2008 with (a): 1.0625, (b):1.0011 and (c):1.2298), wave b ended at 0.9910 with (a): 1.0370, (b): 1.1967, (c): 0.9910. The rise from there to 1.1730 is the wave c which also marked the end of wave IV and wave V has possibly ended at 0.7068.
On the upside, whilst initial recovery to 0.9840-50 cannot be ruled out, reckon upside would be limited to 0.9900 and bring another decline later. Above 0.9955-60 would defer and risk rebound to 1.0000 but upside should still be limited and price should falter well below resistance at 1.0100-08, bring retreat later. Only a break above this level would signal the rise from 0.9813 low has resumed and extend gain to previous resistance at 1.0171. Looking ahead, once this level is penetrated, this would signal the retreat from 1.0344 has ended, bring further gain to 1.0200-10, then test of resistance at 1.0248 resistance, only above there would add credence to this view and bring resumption of early upmove for an eventual retest of 1.0344.
Recommendation: Sell at 0.9900 for 0.9700 with stop above 1.0000
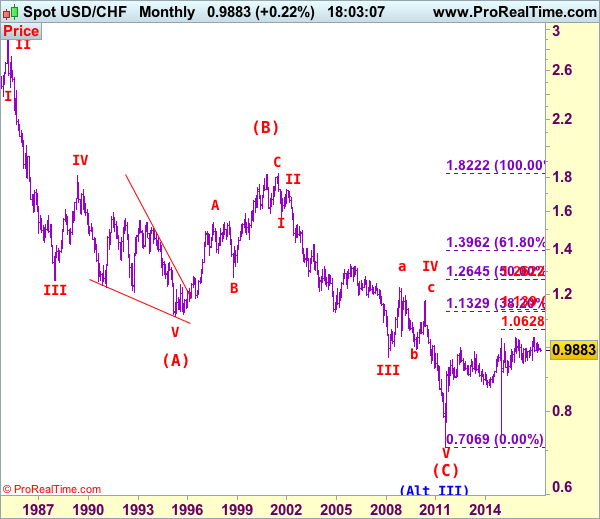
Dollar's long-term downtrend started from 2.9343 (Feb 1995) and it was unfolding as a (A)-(B)-(C) with (A): 1.1100, (B): 1.8310 (26 Oct 2000), then followed by another impulsive wave (C) with wave III ended at 0.9630 (Mar 2008). Under this count, correction in wave IV has possibly ended at 1.1730 and wave V already broke below support at 0.9630 and met indicated downside target at 0.7500 and 0.7400. The reversal from 0.7068 suggests the wave V has possibly ended and the breach of resistance at 0.9595 add credence to this view and indicated upside target at 1.0000 had been met, however, the sharp retreat from 1.0296 to 0.7401 suggests choppy trading would be seen but price should stay above said record low at 0.7068.
USD/CHF Wide-Open Towards Support At 0.9550, USD/CAD Selling Pressures Are Fading, AUD/USD Riding Symmetrical Triangle.
USD/CHF Wide-open towards support at 0.9550.
USD/CHF continues to push lower after failing to break resistance given at 1.0107 (10/04/2017 high). Support located at 0.9814 (27/03/2017 low) has been broken. Expected to continue going lower.
In the long-term, the pair is still trading in range since 2011 despite some turmoil when the SNB unpegged the CHF. Key support can be found 0.8986 (30/01/2015 low). The technical structure favours nonetheless a long term bullish bias since the unpeg in January 2015.

USD/CAD Selling pressures are fading.
USD/CAD keeps on weakening since the pair reached 1.3800. Hourly support can be found at 1.3411 (24/04/2017 high) then 1.3353 (20/01/2017 high). Expected to show continued bearish pressures.
In the longer term, there is a golden cross with the 50 dma crossing the 200 dma indicating further upside pressures. Strong resistance is given at 1.4690 (22/01/2016 high). Long-term support can be found at 1.2461 (16/03/2015 low).
AUD/USD Riding symmetrical triangle.
AUD/USD is pushing higher since the pair monitored support at 0.7329 (09/05/2017 low). As long as prices remain below the resistance at 0.7608 (17/04/2017 high), the short-term technical structure is negative. Expected to show renewed weakness.
In the long-term, we are waiting for further signs that the current downtrend is ending. Key supports stand at 0.6009 (31/10/2008 low) . A break of the key resistance at 0.8295 (15/01/2015 high) is needed to invalidate our long-term bearish view.
EUR/USD Continued Increase, GBP/USD Breaking 1.30 Mark, USD/JPY Continued Decline.
EUR/USD Continued increase.
EUR/USD is trading higher. Resistance now lies at 1.1172 (18/05/2017 high). Hourly support can be found at 1.0842 (11/05/2017 low). Strong support is now given at 1.0682 (21/04/2017 base) and key support can be found at 1.0494 (22/02/2017 low). Expected to continue growing higher.
In the longer term, the death cross late October indicated a further bearish bias. The pair has broken key support given at 1.0458 (16/03/2015 low). Key resistance holds at 1.1714 (24/08/2015 high). Expected to head towards parity.
GBP/USD Breaking 1.30 mark.
GBP/USD is trading higher. Hourly resistance is given at 1.3048 (18/05/2017 high). Hourly support are given at 1.2831 (04/05/2017 low) and1.2757 (21/04/2017 low). An unlikely break of this last support would indicate further weakness. Expected to push higher.
The long-term technical pattern is even more negative since the Brexit vote has paved the way for further decline. Long-term support given at 1.0520 (01/03/85) represents a decent target. Long-term resistance is given at 1.5018 (24/06/2015) and would indicate a long-term reversal in the negative trend. Yet, it is very unlikely at the moment.
USD/JPY Continued decline.
USD/JPY has exited the symmetrical triangle and keeps pushing lower. Hourly support is given at 110.24 (18/05/2017 low). Stronger support is located at 108.13 (17/04/2017 low). Other key supports lie at a distant 106.04 (11/11/2016 low).The road is now wide-open for further decline.
We favor a long-term bearish bias. Support is now given at 96.57 (10/08/2013 low). A gradual rise towards the major resistance at 135.15 (01/02/2002 high) seems absolutely unlikely. Expected to decline further support at 93.79 (13/06/2013 low).
Technical Outlook: AUDUSD Faces Strong Headwinds At 0.7470/0.7500 Zone
The Aussie regained traction and retested recovery high at 0.7467 after Thursday's trading ended in red on strong upside rejection.
Higher prices of metals support AUD, however, fresh rally faces strong headwinds at 0.7470 zone (Fibo 61.8% of 0.7554/0.7327 / 55SMA) and 0.7500 (Fibo 76.4% / weekly cloud top.
Risk of repeated rejection here comes from bearishly aligned daily studies, with the pair expected to spend some time in consolidation between 10SMA support (0.7397) and 0.7470 resistance.
Fresh direction will be established on break of either boundary.
Res: 0.7467, 0.7500, 0.7544, 0.7554
Sup: 0.7424, 0.7397, 0.7387, 0.7364
Technical Outlook: USDJPY – Break Above 55SMA To Trigger Stronger Recovery
The USDJPY pair is consolidating within daily cloud and holding above broken Kijun-sen (111.23) which now acts as good support.
Immediate downside risk has been sidelined after Thursday’s bounce from fresh three-week low at 110.23 that left long-tailed bullish daily candle (positive signal).
However, recovery stays capped by 55SMA (111.74) for the second day, which, together with 111.80 (Fibo 38.2% of 114.36/110.22) marks pivotal barrier.
Firm break here would trigger stronger correction of the downleg from 114.36 towards next barriers at 112.26 (20SMA) and 112.75 (100SMA / Fibo 61.8% retracement.
Daily studies are in mixed setup but slow stochastic is emerging from oversold territory and may lend fresh support to the pair for further advance.
Alternative scenario sees increased downside risk on return and close below daily Kijun-sen / cloud base (111.23/12).
Res: 110.74, 112.00, 112.26, 112.75
Sup: 111.23, 111.12, 110.50, 110.23
Brazil Rocked By Renewed Political Crisis
Brazil was thrown into a fresh political crisis yesterday after fresh corruption charges hit President Michel Temer. The President has been accused in one of the biggest Brazilian newspapers of endorsing the payment of money to the imprisoned former speaker of the lower house of Congress, Eduardo Cunha, to 'silence' him in the ongoing corruption probe. On Thursday afternoon, the paper's website posted an audiotape that purports to be of Temer discussing the alleged payoff. Yesterday, President Temer responded on Brazilian television that he vows to hold onto his power and prove his innocence. The opposition parties have called for Temer to step down and a public protest took place in several Brazilian cities.
The fresh political crisis in Brazil could not come at a worse time for the Brazilian economy. The Temer government is in the midst of carrying out extensive fiscal reforms to address the significant fiscal challenges that have been accumulating over the past decade with the Lula-Rousseff governments, with the fiscal deficit hovering close to 9% of GDP and public debt levels at 70% of GDP. Late last year, the government adopted a spending gap and extensive pension reforms are currently being discussed in parliament. On the back of the government's reform, a fragile recovery has started to take hold as business and household confidence have rebounded.
The outlook for the BRL and Brazilian assets depends on the ability of the President to fend off the allegations over the next few days. The opposition parties will certainly maintain pressure on Temer to step down or start an impeachment process against him. The problem for the Temer government is that it is struggling with low approval ratings and eight of his cabinet ministers have been forced to resign over allegations of misconduct. Investors have bought into the ability of the Temer government to push through reforms and generally hold his economic team in high regard. However, although the market is still long the Brazilian real, it is not at the same stretched positions as a few months ago. However, the latest bout of political uncertainty creates upside risk to our forecast for USD/BRL of 3.30 by end-June.
Dollar Carnage Pauses, But Is It Over?
The greenback rebounded yesterday helped by a video clip of former FBI Director Comey's testimony on the 3rd of May. Under oath, Comey suggested that there had been no obstructions to FBI investigations. Following recent reports that President Trump asked the former FBI Director to drop an investigation regarding ties between Trump's prior security advisor Michael Flynn and Russia, this video was passed around as a proof that Trump didn't pressured him. The result was a rebound in the dollar, a retreat in safe havens and a recovery in equity markets.
However, if someone listens to the clip more carefully, he should notice that Comey was asked specifically if someone at the Department of Justice or the Attorney General had ever asked him to halt an investigation. In our view, this disregards the video as an evidence of Comey not being pressured by the White House and thus, we don't expect any material change in market sentiment in the absence of any stronger evidence. Risk aversion may prevail again, at least for the next few days, supporting safe havens and bringing equity markets under renewed selling interest. The dollar could also resume its latest tumble.
USD/JPY edged north after it hit support below the 110.50 (S2) level. The pair emerged back above 111.10 (S1), but it was stopped slightly below the resistance hurdle of 111.90 (R1). Bearing in mind that the pair remains within the channel that has been in place since December, we still see the likelihood for the bears to take the reins again soon and perhaps aim for another test near 110.50 (S2).
Canada's CPIs take center stage today
The main event today will probably be the release of Canada's CPI data for April. The forecast is for both the headline and the core CPI rates to have ticked up, following notable tumbles in March. The forecast is supported by the nation's Markit manufacturing PMI for April, which showed another robust increase in factory gate prices.
A rebound in these rates would likely be an encouraging development for BoC officials as it could confirm that the softness in March was only transitory, and may thereby support CAD. Nevertheless, we doubt that it will lead to a material change in the Bank's dovish bias. The BoC made it clear that it is going to maintain a cautious stance until uncertainties around trade clear up, something we don't see happening anytime soon given the recent tariffs from the US government.
USD/CAD has been trading in a consolidative manner in the last couple of days, oscillating around the key support obstacle of 1.3600 (S1). We believe that the rate may continue to trade at those levels today, waiting for Canada's CPI data. If indeed we get a rebound in the nation's inflation rates, sellers may take the opportunity and drive the battle below the aforementioned obstacle. Something like that may initially pave the way for our next support of 1.3530 (S2).
As for the rest of today's events:
During the European day, the economic calendar is very light. The most noteworthy data we get is Germany's PPI for April and Eurozone's current account balance for March. However, neither of these indicators is usually a major market mover for EUR.
From Canada, besides the CPI data, we also get retail sales for March.
We have three speakers on the agenda: ECB Vice President Vitor Constancio, ECB Executive Board member Peter Praet and St. Louis Fed President James Bullard.
USD/JPY
Support: 111.10 (S1), 110.50 (S2), 109.70 (S3)
Resistance: 111.90 (R1), 112.35 (R2), 113.10 (R3)
USD/CAD
Support: 1.3600 (S1), 1.3530 (S2), 1.3420 (S3)
Resistance: 1.3660 (R1), 1.3750 (R2), 1.3790 (R3)
DAX Registers Slight Gains As German Inflation Report Beats Estimate
The DAX index has recorded slight gains in the Friday session, gaining 0.31%. Currently, the DAX is trading at 12,637.50. Financial stocks are broadly higher, led by Commerzbank, which has gained 0.59%. In economic news, German PPI improved to 0.4%, beating the estimate of 0.2%. Later, the eurozone releases current account and consumer confidence.
Stock markets were down this week, and the DAX index fell 1.5%, courtesy of the political chaos in Washington, which has made investors jittery. The Trump administration has not had much success in damage control, and there is no sign of the political firestorms letting up any time soon. It was a week of true political drama on Capitol Hill and in the White House. The Justice Department, under strong bilateral pressure, has appointed a former FBI director as a special prosecutor to investigate possible Russian involvement in the US presidential election as well as any connection between Trump and the Russians during the election campaign. President Trump fired back on Thursday, angrily denouncing this move as a “witch hunt”. The media and the Democrats have had a field day with Trump's troubles, and even Republicans are expressing unease with an administration that appears rudderless and is staggering from crisis to crisis. Trump has been relentlessly dogged by accusations of being cozy with the Russians, and his meeting with the Russian foreign minister last week was a public relations disaster, as the president came under heavy criticism for releasing classified information at the meeting. The latest string of controversies has had a chilling effect on global stock markets, and the downward trend could continue if the crisis in Washington worsens.
German and eurozone inflation indicators remain solid in 2017. German inflation figures were stronger in the first quarter, but inflation numbers continue to meet or exceed the forecasts in the second quarter. Producer Prices posted a gain of 0.4% in April, and the Wholesale Price Index gained 0.3% in April. The news was not as good from Final CPI, which dipped to 0.0%, marking a 3-month low. Still, this figure matched the estimate. In the eurozone, Final CPI for April matched the forecast with a strong gain of 1.9% in April, considerably higher than last month's gain of 1.5%. Eurozone inflation is once again closing in on the ECB's target of 2.0%, which could increase pressure on the ECB to consider tapering its ultra-loose monetary policy. However, the ECB seems content to hold course on interest rates and its quantitative easing program, and the central bank will be reluctant to make any moves with key elections coming up in France and Germany.
EUR/USD Analysis: Remains Above 1.11 Level
'Price action suggested stop-loss sell orders were tripped.' – Alexandria Arnold and Dennis Pettit, Bloomberg
Pair's outlook
During Thursday's trading session the currency exchange rate had retreated down to the 1.1075 mark, where it found support. After the change in the direction of the pair the currency pair had broken pass the weekly R2 at 1.1115 on Friday morning. Due to that it can be expected that the rate will surge up to the resistance of the monthly R2 at 1.1187, which is strengthened by the 61.80% Fibonacci retracement level at 1.1190.
Traders' sentiment
Traders have turned bearish on the pair, as 52% of open positions are short. However, 55% of pending orders are to buy the Pound.
GBP/USD Analysis: Recovers Yesterday’s Losses
'The reversal appears to be purely a function of a recovering US Dollar which has been under pressure all week as the US Trump administration bats allegation after allegation of wrongdoings and incompetence.' – Joaquin Monfort (based on PoundSterlingLive)
Pair's outlook
The morning session started rather calmly for GBP/USD with no strong market movers pushing the pair to either side. The Pound closed Thursday's session in the red area, thus leaving upside potential for the pair to reach the upper channel boundary today. Up to now, the rate has been appreciating gradually, suggesting that bulls may prevail to lead the currency towards the weekly R1 or even the channel boundary at 1.2970 and 1.3000, respectively. GBP/USD changing to the downside is not very likely today, taking into account bullish indicators that favour the above scenario over the Pound pushing back down to the 20-day SMA.
Traders' sentiment
Traders have turned bearish on the pair, as 52% of open positions are short. However, 55% of pending orders are to buy the Pound.