Sample Category Title
Trade Idea Wrap-up: GBP/USD – Stand aside
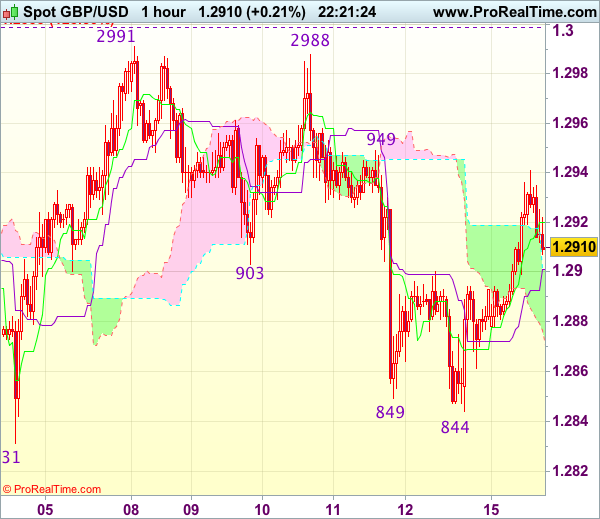
GBP/USD - 1.2913
Most recent candlesticks pattern : N/A
Trend : Near term up
Tenkan-Sen level : 1.2920
Kijun-Sen level : 1.2901
Ichimoku cloud top : 1.2901
Ichimoku cloud bottom : 1.2871
New strategy :
Stand aside
Position : -
Target : -
Stop : -
Despite falling marginally to 1.2844 on Friday, the subsequent stronger-than-expected rebound suggests the fall from 1.2991 has ended there, hence consolidation with mild upside bias is seen for test of 1.2949 resistance but break there is needed to add credence to this view, bring further gain to 1.2970 but said resistance at 1.2991 should hold from here. Only a break of 1.2999-00 (1.236 times projection of 1.2109-1.2616 measuring from 1.2365 and psychological resistance) would revive bullishness and extend recent upmove to 1.3040-50 first.
In view of this, would not chase this rise here and would be prudent to stand aside for now. Below the Kijun-Sen (now at 1.2893) would bring weakness to 1.2860-65 but only break there would revive bearishness for test of 1.2844 support, break there would extend the fall from 1.2991 top to 1.2831 support, then 1.2805.
Trade Idea Wrap-up: EUR/USD – Sell at 1.1000
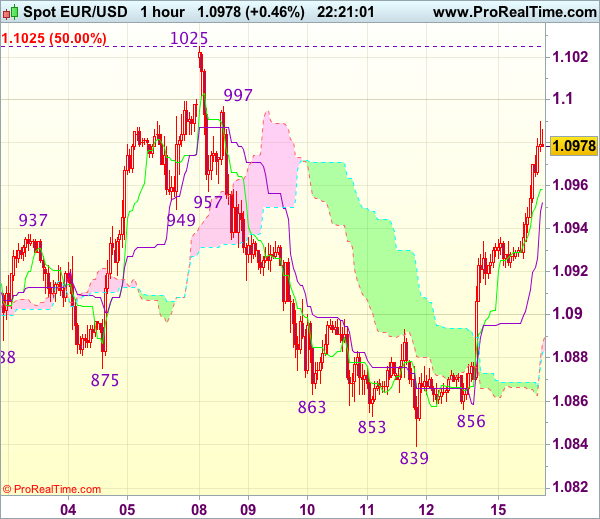
EUR/USD - 1.0980
Most recent candlesticks pattern : N/A
Trend : Near term up
Tenkan-Sen level : 1.0958
Kijun-Sen level : 1.0952
Ichimoku cloud top : 1.0887
Ichimoku cloud bottom : 1.0883
Original strategy :
Sell at 1.0995, Target: 1.0880, Stop: 1.1030
Position : -
Target : -
Stop : -
New strategy :
Sell at 1.1000, Target: 1.0900, Stop: 1.1035
Position : -
Target : -
Stop : -
Euro has staged a strong rebound after falling to 1.0839, suggesting consolidation above this level would be seen and near term upside risk remains for further gain to 1.0997 resistance, however, if our view that top has been formed at 1.1025 is correct, upside would be limited and price should falter below recent high at 1.1025, bring another decline later. Below 1.0895-00 would bring weakness to 1.0855-60 but break there is needed to retain bearishness an extend the fall from 1.1025 top to 1.0821, then 1.0795-00 later.
In view of this, we are still looking to sell euro on further subsequent rebound as 1.0997 resistance should limit upside. Only break of said resistance at 1.1025 would abort and signal early upmove has resumed instead, bring further gain to 1.1050-55 and later 1.1075-80 before prospect of another retreat.
Trade Idea Wrap-up: USD/JPY – Buy at 112.70
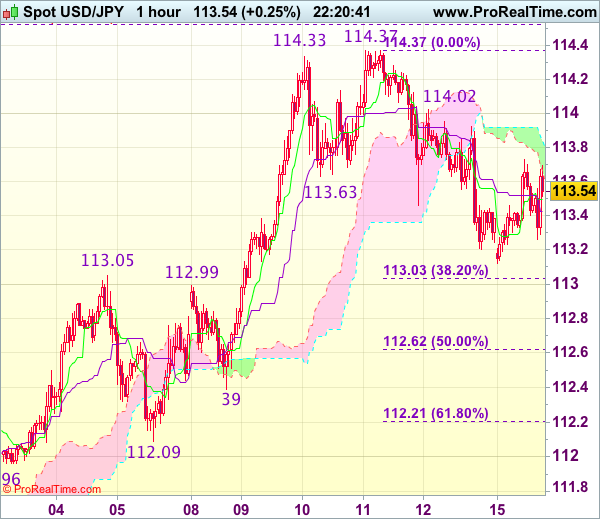
USD/JPY - 113.54
Most recent candlesticks pattern : N/A
Trend : Near term up
Tenkan-Sen level : 113.50
Kijun-Sen level : 113.43
Ichimoku cloud top : 113.84
Ichimoku cloud bottom : 113.67
Original strategy :
Buy at 112.70, Target: 113.80, Stop: 112.35
Position : -
Target : -
Stop : -
New strategy :
Buy at 112.70, Target: 113.80, Stop: 112.35
Position : -
Target : -
Stop : -
Although the greenback found support at 113.12 and recovered, last week’s retreat from 114.37 suggests further consolidation below this level would be seen and downside risk is for another corrective fall to 113.00-05, however, 112.60-65 (50% Fibonacci retracement of 110.87-114.37) should limit downside and bring rebound later, above 113.75 would bring test of 114.00-05 but break of latter level is needed to signal the pullback from 114.37 has ended, bring retest of this level later.
In view of this, we are inclined to buy dollar on next decline but one should exit on such rebound as 114.37 resistance should cap upside. Below support at 112.39 would risk further weakness to 112.20-25 (61.8% Fibonacci retracement of 110.87-114.37) but still reckon previous support at 112.09 would hold from here.
CAC Drifting as Investors Search for Cues, Eurozone GDP Next
The CAC has started the week quietly, as the index is at 5401.50 in the Monday session. There are no releases out of the eurozone, so we can expect the CAC to remain subdued for the remainder of the day. Tuesday will be busy, highlighted by Eurozone Flash GDP for the first quarter, which is expected to improve to 0.5%. France will release Final CPI for April, with an estimate of 0.1%. As well, Germany and the eurozone will release ZEW Economic Sentiment.
The first quarter of 2017 has seen improved numbers in the euro area, largely due to strong numbers from Germany, the largest economy in the eurozone. Germany's economy expanded 0.6% in the first quarter, compared to a 0.4% gain in Q4 of 2016. What was particularly encouraging was that the expansion was broadly based, with strong consumer and state spending, and an upsurge in the construction and manufacturing and export sectors. However, inflation levels continues to recede, after some strong numbers in the first quarter. In April, German Final CPI dropped to 0.0%, marking a 3-month low. This trend has also characterized inflation in the eurozone, as weaker inflation levels has lessened pressure on the ECB to tighten monetary policy.
The EU released its Spring 2017 Economic Forecast, and the report gave the eurozone a passing grade. The report noted that the European economy is in its fifth year of recovery, and forecast eurozone GDP growth of 1.7% in 2017 and 1.8% in 2018. On the inflation front, the report stated that inflation had risen in recent months, but this was mainly due to an increase in oil prices. Still, inflation was expected to reach 1.6% in 2017 and 1.3% in 2018, compared to just 0.2% in 2016. Stronger growth has led to lower unemployment, and the report projected that eurozone unemployment rate would drop to 9.4% in 2017 and 8.9% in 2018. At the same time, economic risks remain tilted to the downside, including US economic and trade policy under President Trump, the European banking sector and Brexit. This forecast was considerably more optimistic than the Winter 2017 forecast, as is apparent from the captions in the press releases for these two reports: The Winter forecast was entitled "Navigating through choppy waters", while the caption for the Spring forecast reads "Steady growth ahead".
US consumer numbers improved in April, but still missed their estimates. CPI came in at 0.2%, short of the estimate of 0.3%. Core CPI, which excludes the most volatile items, posted a small gain of 0.1, shy of the estimate of 0.2%. Retail Sales came in at 0.3%, compared to the forecast of 0.5%. Retail Sales rose 0.4%, short of the estimate of 0.6%. Consumer confidence remained strong, as the reading of 97.7 beat the forecast of 97.0 points. These numbers underscored a troubling trend where strong consumer confidence has failed to translate into increased consumer spending.
Technical Outlook: Oil Extending Recovery Leg from $43.74 Spike Low
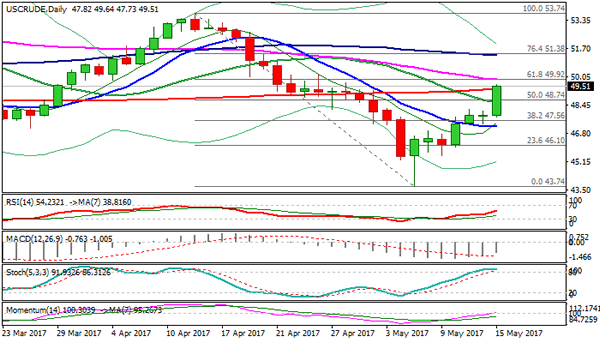
US oil rallied strongly on Monday, extending recovery leg from $43.74 spike low, boosted by agreement between Saudi Arabia and Russia to extend oil production cut for a further nine months. Top oil producers showed strong commitment to extend an existing deal in order to reduce global oil oversupply and stabilize oil price. However, the agreement needs verification on OPEC's May 25 meeting, with strong expectations that agreement will be supported by other oil producers. Oil price rallied over 3.5% since opening in Asia until early hours of American session, taking out important barriers at $48.74 (daily Kijun-sen and 20SMA) and cracking another strong obstacle at $49.30 (200SMA). Near-term focus turns towards key resistances at $49.92/$50.00 (Fibo 61.8% of $53.74/$43.74 descend, reinforced by 55SMA and daily cloud / psychological barrier), break of which would generate another strong bullish signal for extended recovery. Close above these barriers is needed to confirm bullish resumption. Daily MA's are gradually turning into bullish setup, with bullish momentum building up and supporting growing bullish sentiment in the market. On the other side, slow stochastic is strongly overbought on daily chart and suggests hesitation at pivotal $50 zone, however, no firmer bearish signal has been generated so far. Corrective dips should be ideally contained by broken 20SMA/daily Kijun-sen to keep near-term bullish structure intact.
Res: 49.92; 50.00; 50.20; 51.03
Sup: 48.74; 48.20; 47.73; 47.33
Trade Idea: EUR/GBP – Buy at 0.8465
EUR/GBP - 0.8504
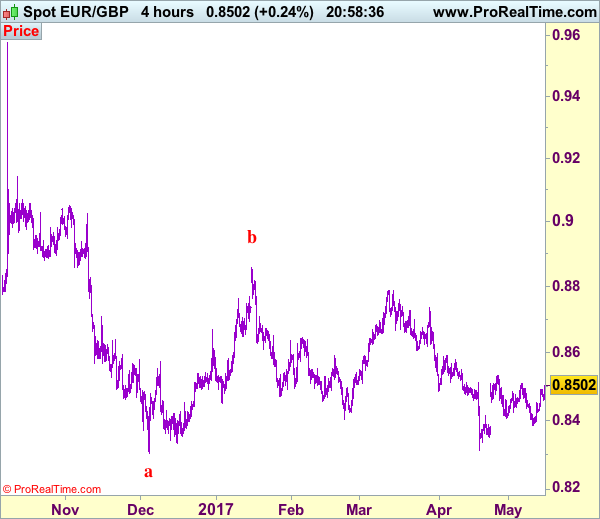
Recent wave: Major double three (A)-(B)-(C)-(X)-(A)-(B)-(C) is unfolding and 2nd (A) has possibly ended at 0.6936.
Trend: Near term down
New strategy :
Buy at 0.8465, Target: 0.8565, Stop: 0.8425
Position : -
Target : -
Stop : -
As the single currency has risen again after brief pullback, suggesting further gain to 0.8531 resistance would be seen, however, break there is needed to signal another leg of corrective rise from 0.8312 low is underway for retracement of recent decline to 0.8550 and then 0.8580 but price should falter below resistance at 0.8592, risk from there is seen for a retreat later.
In view of this, we are looking to buy euro on pullback as 0.8460-65 should limit downside and bring another rise. Below support at 0.8423 would abort and signal the rebound from 0.8384 has ended, bring further fall to 0.8400 but said support at 0.8384 should remain intact. Only a break below support at 0.8351 would revive bearishness and signal the rebound from 0.8312 low has ended at 0.8531 and bring further fall towards this support at 0.8312 which is likely to hold from here.
Our preferred count is that, after forming a major top at 0.9805 (wave V), (A)-(B)-(C) correction is unfolding with (A) leg ended at 0.8400 (A: 0.8637, B: 0.9491 and 5-waver C ended at 0.8400. Wave (B) has ended at 0.9413 and impulsive wave (C) has either ended at 0.8067 or may extend one more fall to 0.8000 before prospect of another rally. Current breach of indicated resistance at 0.9043 confirms our view that the (C) leg has ended and bring stronger rebound towards 0.9150/54, then towards 0.9240/50.
USD/CAD Mid-Day Outlook
Daily Pivots: (S1) 1.3668; (P) 1.3705; (R1) 1.3745; More....
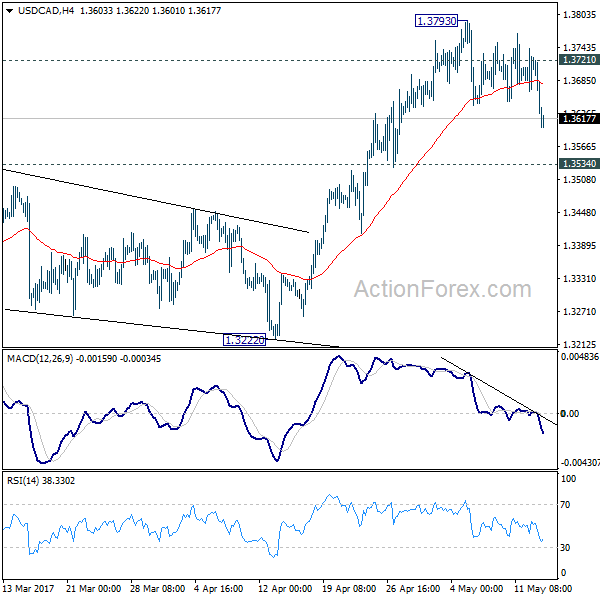
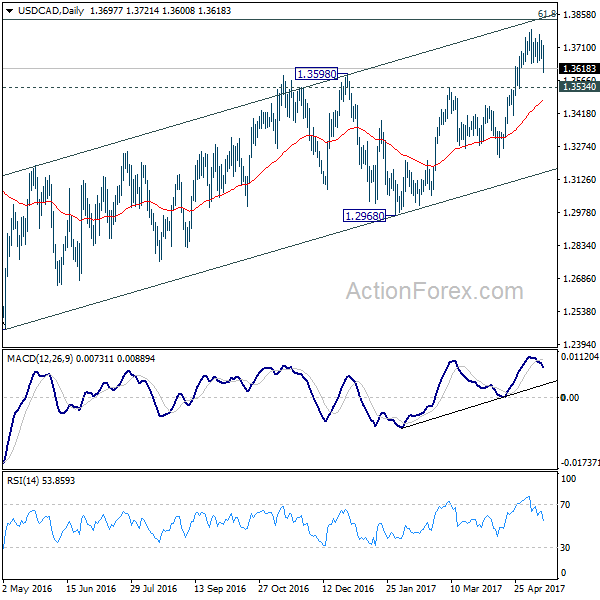
USD/CAD's fall from 1.3793 resumes by diving to as low as 1.3600 so far. Based on accelerating downside momentum, intraday bias is cautiously on the downside for 1.3534 resistance turned support. Break there should confirm completion of the rise from 1.2968 and target 1.3222 support next. On the upside, above 1.3721 will turn bias back to the upside and target 1.3793 and above. However, as noted before, choppy rise from 1.2460 is seen as a corrective move. In case of an extension, upside should be limited by 1.3838 fibonacci level to bring reversal.
In the bigger picture, price actions from 1.4689 medium term top are seen as a correction pattern. The first leg has completed at 1.2460. Rise from 1.2460 is seen as the second leg and would end at around 61.8% retracement of 1.4689 to 1.2460 at 1.3838. Break of 1.3222 should indicate the start of the third leg while further break of 1.2968 should confirm. Nonetheless, sustained trading above 1.3838 would pave the way to retest 1.4689 high.
Trade Idea: USD/CAD – Buy at 1.3570
USD/CAD - 1.3620
Recent wave: Only wave v of c has ended at 0.9407 and wave C of major A-B-C correction is underway for headway to 1.4700
Trend: Near term up
Original strategy :
Buy at 1.3570, Target: 1.3770, Stop: 1.3510
Position: -
Target: -
Stop: -
New strategy :
Buy at 1.3535, Target: 1.3735, Stop: 1.3475
Position: -
Target: -
Stop:-
The greenback has slipped again after meeting resistance at 1.3770, retaining our view that further consolidation below recent high at 1.3794 would be seen and near term downside risk remains for retracement to 1.3590-00, however, reckon downside would be limited to support at 1.3530 and bring another rise later, above 1.3725-30 would bring test of 1.3770 resistance but break there is needed to signal pullback from 1.3794 has ended, bring retest of this level, break there would confirm recent upmove has resumed and extend further gain to 1.3840-50 but overbought condition should prevent sharp move beyond 1.3890-00 and price should falter below 1.3950.
In view of this, would not chase this rise here and would be prudent to buy again on pullback as 1.3535 should limit downside and bring another rise later. Below 1.3530 would abort and suggest a temporary top is formed, bring retracement of recent upmove to 1.3500 and later towards 1.3450-60 but support at 1.3411 should remain intact, bring another upmove later.
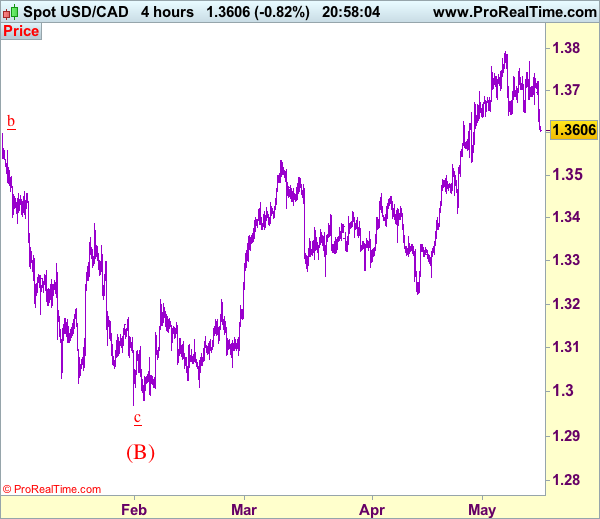
To recap, wave B from 1.3066 is unfolding as an a-b-c and is sub-divided as a: 1.2192, b: 1.2716 and wave c is a 5-waver with i: 1.1983, ii: 1.2506, extended wave iii with minor iii at 1.0206, wave iv ended at 1.0781 and wave v as well as wave iii has ended at 0.9931, hence the subsequent choppy trading is the wave iv which is unfolding as (a)-(b)-(c) with (a) leg of iv ended at 1.0854, followed by (b) leg at 1.0108 and (c) leg as well as the wave iv ended at 1.0674. The wave v is sub-divided by minor wave (i): 0.9980, (ii): 1.0374, (iii): 0.9446, (iv): 0.9913 and (v) as well as v has possibly ended at 0.9407, therefore, consolidation with upside bias is seen for major correction, indicated target at 1.3700 and 1.4000 had been met and further gain to 1.4700 would be seen later.
EUR/USD Mid-Day Outlook
Daily Pivots: (S1) 1.0878; (P) 1.0906 (R1) 1.0957; More....
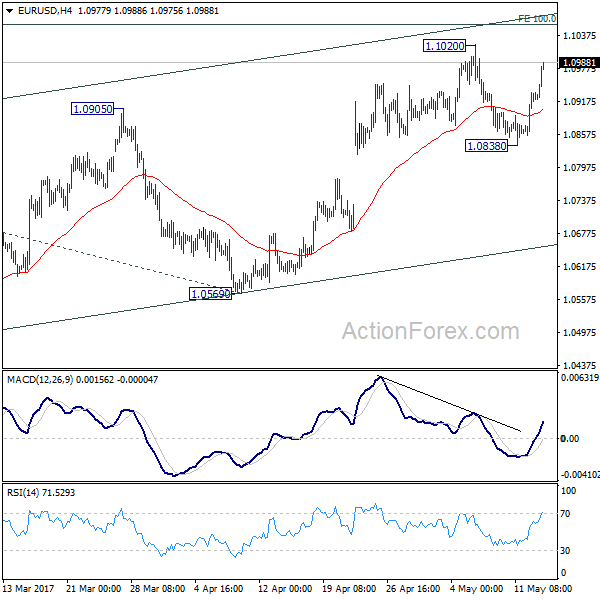
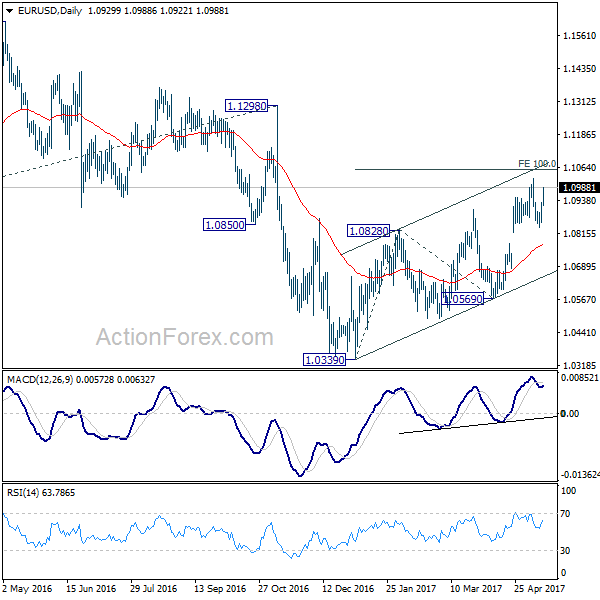
EUR/USD rebounds strongly today but it's staying below 1.1020 resistance so far. Intraday bias remains neutral first. Break of 1.1020 will resume the corrective rise from 1.0339. In the case, we'd expect upside to be limited by 100% projection of 1.0339 to 1.0828 from 1.0569 at 1.1058 to bring near term reversal. On the downside, break of 1.0838 will argue that the corrective rise from 1.0339 has completed. In such case, intraday bias will be turned back to the downside for 55 day EMA (now at 1.0770).
In the bigger picture, as long as 1.1298 key resistance holds, whole down trend from 1.6039 (2008 high) is still expected to continue. Break of 1.0339 low will send EUR/USD through parity to 61.8% projection of 1.3993 to 1.0461 from 1.1298 at 0.9115. However, considering bullish convergence condition in weekly MACD, break of 1.1298 will indicate long term reversal.
GBP/USD Mid-Day Outlook
Daily Pivots: (S1) 1.2850; (P) 1.2875; (R1) 1.2908; More...
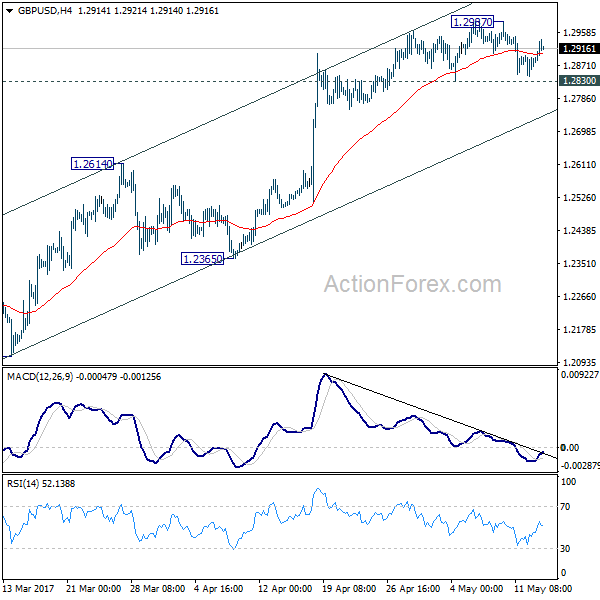
GBP/USD is staying in tight range below 1.2987 and intraday bias stays neutral first. With 1.2830 minor support intact, another rise could be seen. However, firstly, price actions from 1.1946 are viewed as a corrective pattern. Secondly, bearish divergence condition is seen in 4 hour MACD. Hence, in case of another rise, we'd start to look for reversal signal again above 1.2987. Meanwhile, break of 1.2830 will indicate short term topping. In such case, intraday bias is turned back to the downside for 1.2614 resistance turned support first.
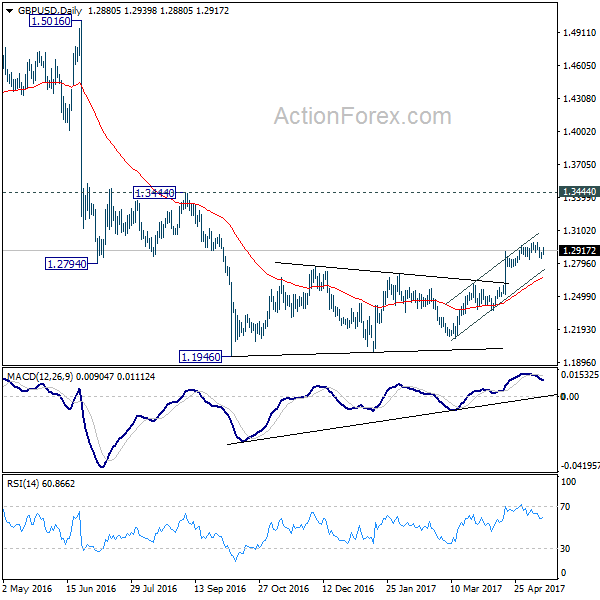
In the bigger picture, fall from 1.7190 is seen as part of the down trend from 2.1161. There is no sign of medium term reversal yet. Sustained trading below 61.8% projection of 2.1161 to 1.3503 from 1.7190 at 1.2457 will target 100% projection at 0.9532. Overall, break of 1.3444 resistance is needed to confirm medium term bottoming. Otherwise, outlook will remain bearish.