Sample Category Title
USD/CHF Mid-Day Outlook
Daily Pivots: (S1) 0.9967; (P) 1.0026; (R1) 1.0066; More.....
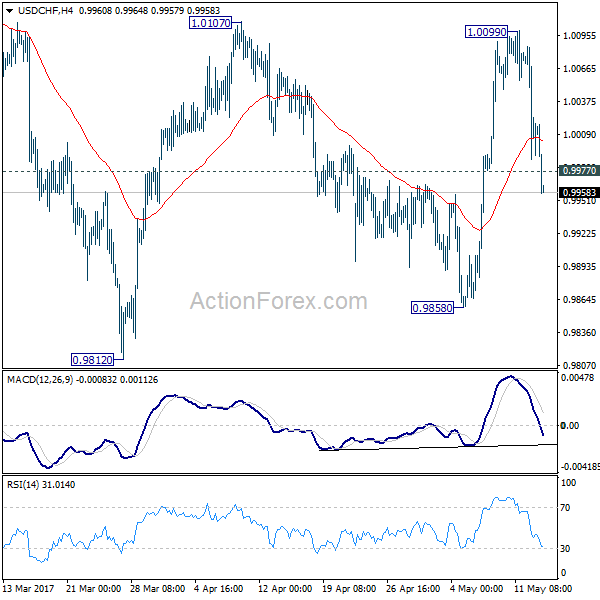
USD/CHF's fall from 1.0099 accelerate lower today. Break of 0.9977 minor support dampened the original bullish view. Intraday bias is now back on the downside for 0.9858 support first. Break of 0.9858 should then extend the correction from 1.0342 through 0.9812 before completion. Meanwhile, above 1.0099 will revive that case that correction from 1.0342 has completed and target a test on this high.
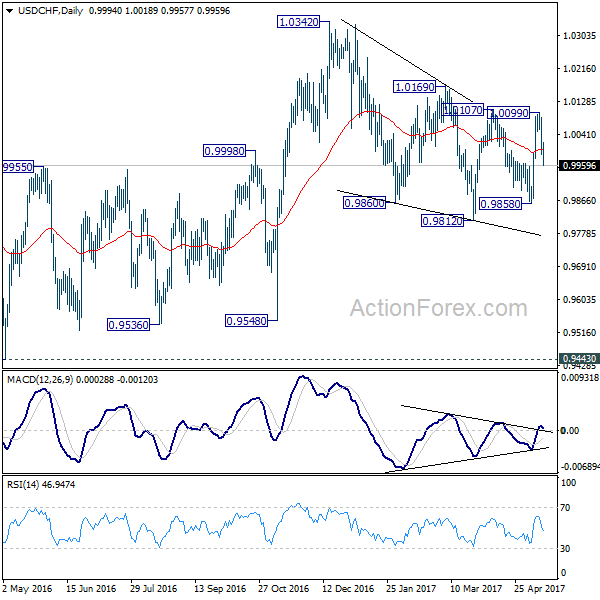
In the bigger picture, we're still maintaining that firm break of 1.0342 key resistance is needed to confirm underlying bullish momentum in the pair. However, the corrective nature of the fall from 1.0342 is starting to give the medium term outlook a bullish favor. Hence, in stead of looking for topping signal around 1.0342, we'd now pay closer attention to upside acceleration as USD/CHF approaches this level again.
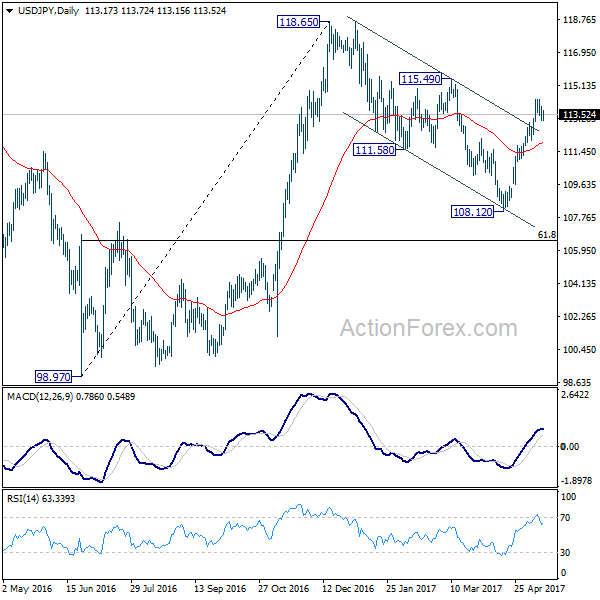
USD/JPY Mid-Day Outlook
Daily Pivots: (S1) 113.03; (P) 113.49; (R1) 113.78; More...
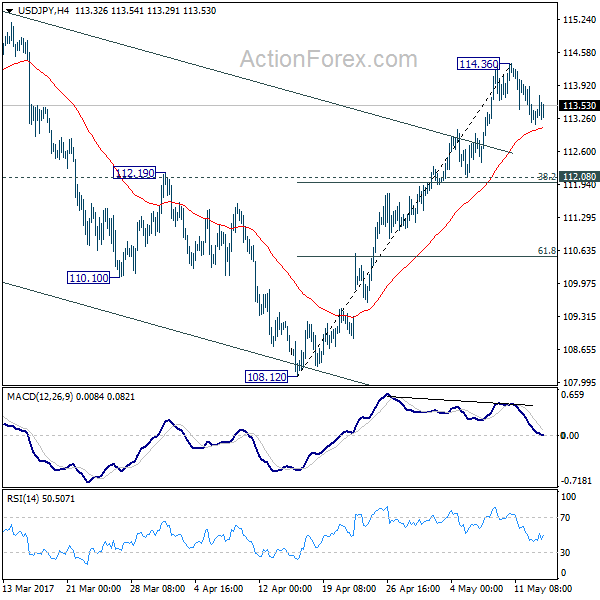
USD/JPY's consolidation pattern from 114.36 is still in progress and intraday bias remains neutral first. In case of deeper pull back, downside should be contained by 112.08 cluster support (38.2% retracement of 108.12 to 114.36 at 111.97) and bring rally resumption. We're holding on to the view that corrective fall from 118.65 is completed with three wave down to 108.12. Above 114.36 will target 115.49 resistance first. Break there should resume whole rise from 98.97 to 125.85 high.
In the bigger picture, price actions from 125.85 high are seen as a corrective pattern. It's uncertain whether it's completed yet. But in case of another fall, downside should be contained by 61.8% retracement of 75.56 to 125.85 at 94.77 to bring rebound. Meanwhile, break of 115.49 resistance will extend the rise from 98.97 to retest 125.85. Overall, rise from 75.56 is still expected to resume later after the correction from 125.85 completes.
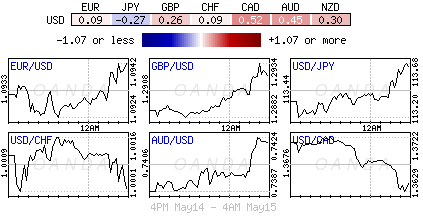
Oil Surges as Saudi Arabia and Russia Agree to Extend Product Cut, Canadian Dollar Jumps
The surge in oil price is the main focus today after Saudi Arabia and Russia agreed to extend production cut. WTI crude oil is now having 50 handle back in sight. Meanwhile, rise in oil price takes FTSE 100 to new record high at 7460.20. DAX also follow to record high at 12832.29. But both indices cannot ride on the initial strength and quickly pare back gains. Nonetheless, in the forex markets, commodity currencies follow and trade broadly higher. USD/CAD's dip is now putting near term support at 1.3534 in focus. Elsewhere in the FX markets, Euro strengthens clearly against Dollar, Sterling and Yen.
Oil price surges on Saudi-Russia production deal
Oil price jumps today after Saudi Arabia and Russia agreed to extend the current production cut deal by another nine-month. Saudi Energy Minister Kahlid Al-Falih said at a joint press briefing that, "the agreement needs to be extended as we will not reach the desired inventory level" by the end of June. Meanwhile, Russian Energy Minister Alexander Novak emphasized that "everyone is committed" and there is no reason for any country to "quit". Under the current agreement, OPEC and other oil producers pledged to lower output by 1.8mbpd during the first half of 2017. With the new deal, production cut will be extended to March 2018. WTI crude oil hits as high as 49.52 so far today, comparing to last week's close at 47.84 and this month's low as 43.76. Canadian Dollar finally follows with USD/CAD dropping to as low as 1.3605 so far.
On the data front...
US Empire State manufacturing index dropped to -1 in May. Swiss PPI dropped -0.2% mom, rose 0.8% yoy in April. Japan machine tools orders rose 34.7% yoy in April. Domestic CGPI rose 2.1% yoy in April. Australia home loans dropped -0.5% in March. New Zealand retail sales rose 1.2% qoq in Q1.
The batch of data released from China today is generally weaker than expected. Retail sales rose 10.7% yoy in April, down from prior month's 10.9% yoy and missed consensus of 10.8% yoy. Fixed asset investment rose 8.9% yoy, down from prior 9.2% and missed consensus of 9.1%. Industrial production rose 6.5% yoy, down from prior 7.6% yoy and missed expectation of 7.0% yoy. The set of data is in-line with recent PMIs, which showed loss of momentum in Q2 after a solid Q1.
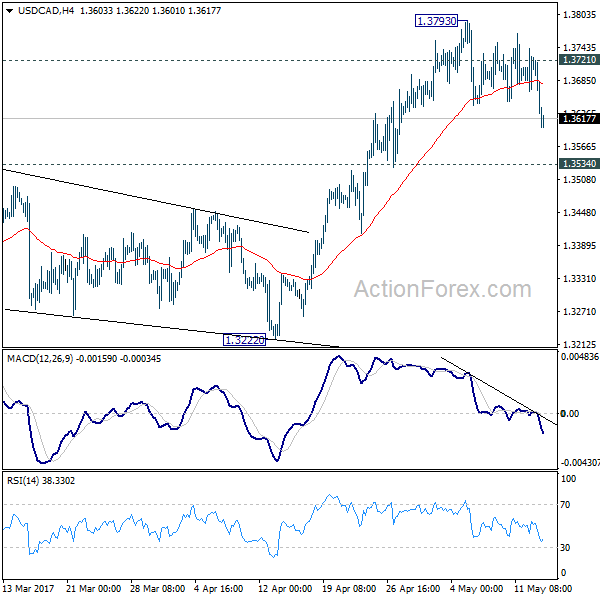
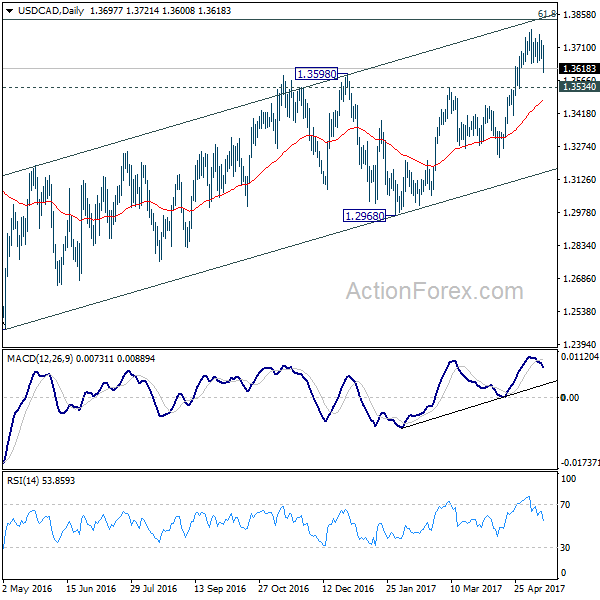
USD/CAD Mid-Day Outlook
Daily Pivots: (S1) 1.3668; (P) 1.3705; (R1) 1.3745; More....
USD/CAD's fall from 1.3793 resumes by diving to as low as 1.3600 so far. Based on accelerating downside momentum, intraday bias is cautiously on the downside for 1.3534 resistance turned support. Break there should confirm completion of the rise from 1.2968 and target 1.3222 support next. On the upside, above 1.3721 will turn bias back to the upside and target 1.3793 and above. However, as noted before, choppy rise from 1.2460 is seen as a corrective move. In case of an extension, upside should be limited by 1.3838 fibonacci level to bring reversal.
In the bigger picture, price actions from 1.4689 medium term top are seen as a correction pattern. The first leg has completed at 1.2460. Rise from 1.2460 is seen as the second leg and would end at around 61.8% retracement of 1.4689 to 1.2460 at 1.3838. Break of 1.3222 should indicate the start of the third leg while further break of 1.2968 should confirm. Nonetheless, sustained trading above 1.3838 would pave the way to retest 1.4689 high.
Economic Indicators Update
| GMT | Ccy | Events | Actual | Forecast | Previous | Revised |
|---|---|---|---|---|---|---|
| 22:45 | NZD | Retail Sales Ex Inflation Q/Q Q1 | 1.20% | 0.90% | 0.60% | 0.70% |
| 23:50 | JPY | Domestic Corporate Goods Price Index Y/Y Apr | 2.10% | 1.80% | 1.40% | |
| 01:30 | AUD | Home Loans Mar | -0.50% | 0.00% | -0.50% | -0.80% |
| 02:00 | CNY | Retail Sales Y/Y Apr | 10.70% | 10.80% | 10.90% | |
| 02:00 | CNY | Fixed Assets Ex Rural YTD Y/Y Apr | 8.90% | 9.10% | 9.20% | |
| 02:00 | CNY | Industrial Production Y/Y Apr | 6.50% | 7.00% | 7.60% | |
| 06:00 | JPY | Machine Tool Orders Y/Y Apr P | 34.70% | 22.80% | ||
| 07:15 | CHF | Producer & Import Prices M/M Apr | -0.20% | 0.00% | 0.10% | |
| 07:15 | CHF | Producer & Import Prices Y/Y Apr | 0.80% | 1.00% | 1.30% | |
| 12:30 | USD | Empire State Manufacturing Index May | -1 | 7.5 | 5.2 | |
| 14:00 | USD | NAHB Housing Market Index May | 68 | 68 | ||
| 20:00 | USD | Net Long-term TIC Flows Mar | 68.3B | 53.4B |
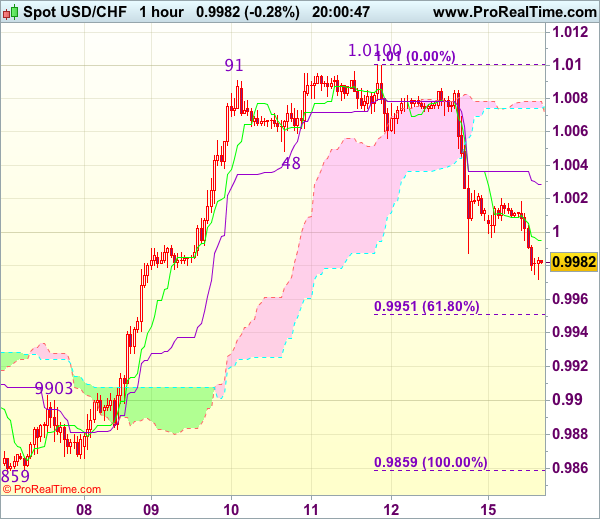
Trade Idea Update: USD/CHF – Sell at 1.0035
USD/CHF - 0.9978
New strategy :
Sell at 1.0035, Target: 0.9935, Stop: 1.0070
Position : -
Target : -
Stop : -
As the greenback has fallen again after brief recovery, suggesting the fall from 1.0100 top is still in progress and further weakness to 0.9950-55 (61.8% Fibonacci retracement of 0.9859-1.0100) would be seen, break there would add credence to this view, bring subsequent fall to 0.9930-35 but price should stay well above previous resistance at 0.9903, bring rebound later.
In view of this, would be prudent to sell dollar on recovery as 1.0035-40 should limit upside. Above previous support at 1.0056 would defer and risk a stronger rebound to 1.0080 but price should falter below resistance at 1.0100-08, bring retreat later.
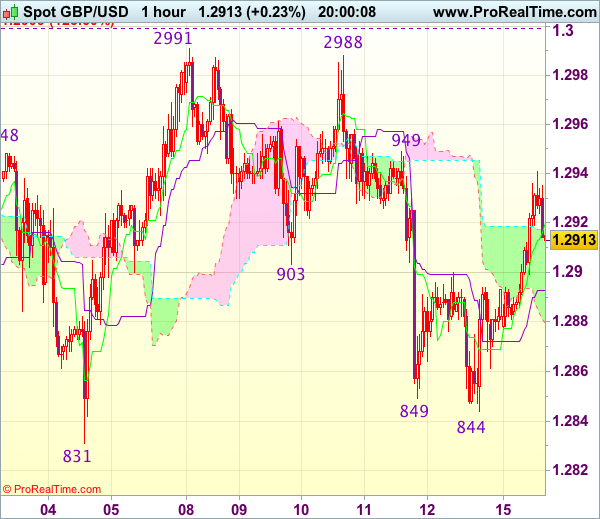
Trade Idea Update: GBP/USD – Stand aside
GBP/USD - 1.2918
Original strategy :
Sold at 1.2900, stopped at 1.2935
Position : - Short at 1.2900
Target : -
Stop : - 1.2935
New strategy :
Stand aside
Position : -
Target : -
Stop : -
Despite falling marginally to 1.2844 on Friday, the subsequent stronger-than-expected rebound suggests the fall from 1.2991 has ended there, hence consolidation with mild upside bias is seen for test of 1.2949 resistance but break there is needed to add credence to this view, bring further gain to 1.2970 but said resistance at 1.2991 should hold from here. Only a break of 1.2999-00 (1.236 times projection of 1.2109-1.2616 measuring from 1.2365 and psychological resistance) would revive bullishness and extend recent upmove to 1.3040-50 first.
In view of this, would not chase this rise here and would be prudent to stand aside for now. Below the Kijun-Sen (now at 1.2893) would bring weakness to 1.2860-65 but only break there would revive bearishness for test of 1.2844 support, break there would extend the fall from 1.2991 top to 1.2831 support, then 1.2805.
DAX Hits Record High on Stronger Oil Prices
The DAX index has started the new trading week with gains. In the Monday session, the DAX is trading at 12,757. 50. The index has taken advantage of stronger oil prices on Monday. On the release front, there are no eurozone events on the schedule. On Tuesday, there are two key events – Eurozone Flash GDP and German ZEW Economic Sentiment. As well, the eurozone releases ZEW Economic Sentiment and trade balance.
Despite a lack of eurozone fundamentals on Monday, the DAX has posted slight gains, taking advantage of a sharp rise in oil prices. Brent crude has jumped 3 percent on Monday, and the DAX briefly touched a high of 12,833.00, a new record. The first quarter of 2017 has seen improved numbers in the euro area, largely due to strong numbers from Germany, the largest economy in the eurozone. Germany's economy expanded 0.6% in the first quarter, compared to a 0.4% gain in Q4 of 2016. What was particularly encouraging was that the expansion was broadly based, with strong consumer and state spending, and an upsurge in the construction and manufacturing and export sectors. However, inflation levels continues to recede, after some strong numbers in the first quarter. In April, German Final CPI dropped to 0.0%, marking a 3-month low. This trend has also characterized inflation in the eurozone, as weaker inflation levels has lessened pressure on the ECB to tighten monetary policy.
The EU released its Spring 2017 Economic Forecast, and the report gave the eurozone a passing grade. The report noted that the European economy is in its fifth year of recovery, and forecast eurozone GDP growth of 1.7% in 2017 and 1.8% in 2018. On the inflation front, the report stated that inflation had risen in recent months, but this was mainly due to an increase in oil prices. Still, inflation was expected to reach 1.6% in 2017 and 1.3% in 2018, compared to just 0.2% in 2016. Stronger growth has led to lower unemployment, and the report projected that eurozone unemployment rate would drop to 9.4% in 2017 and 8.9% in 2018. At the same time, economic risks remain tilted to the downside, including US economic and trade policy under President Trump, the European banking sector and Brexit. This forecast was considerably more optimistic than the Winter 2017 forecast, as is apparent from the captions in the press releases for these two reports: The Winter forecast was entitled "Navigating through choppy waters", while the caption for the Spring forecast reads "Steady growth ahead".
US consumer spending and inflation numbers improved in April, but still fell short of estimates. CPI came in at 0.2%, short of the estimate of 0.3%. Core CPI, which excludes the most volatile items, posted a small gain of 0.1, shy of the estimate of 0.2%. Retail Sales came in at 0.3%, compared to the forecast of 0.5%. Retail Sales rose 0.4%, short of the estimate of 0.6%. Consumer confidence remained strong, as the reading of 97.7 beat the forecast of 97.0 points. These numbers underscored a troubling trend where strong consumer confidence has failed to translate into increased consumer spending.
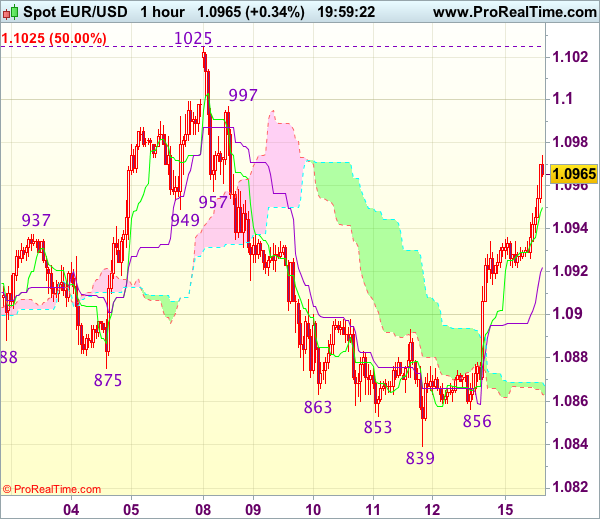
Trade Idea Update: EUR/USD – Sell at 1.0995
EUR/USD - 1.0970
Original strategy :
Sell at 1.0995, Target: 1.0880, Stop: 1.1030
Position : -
Target : -
Stop : -
New strategy :
Sell at 1.0995, Target: 1.0880, Stop: 1.1030
Position : -
Target : -
Stop : -
Euro has staged a strong rebound after falling to 1.0839, suggesting consolidation above this level would be seen and near term upside risk remains for further gain to 1.0990-95, however, if our view that top has been formed at 1.1025 is correct, upside would be limited and resistance at 1.0997 should hold, bring another decline later. Below 1.0895-00 would bring weakness to 1.0855-60 but break there is needed to retain bearishness an extend the fall from 1.1025 top to 1.0821, then 1.0795-00 later.
In view of this, we are still looking to sell euro on further subsequent rebound as 1.0997 resistance should limit upside. Only break of said resistance at 1.1025 would abort and signal early upmove has resumed instead, bring further gain to 1.1050-55 and later 1.1075-80 before prospect of another retreat.
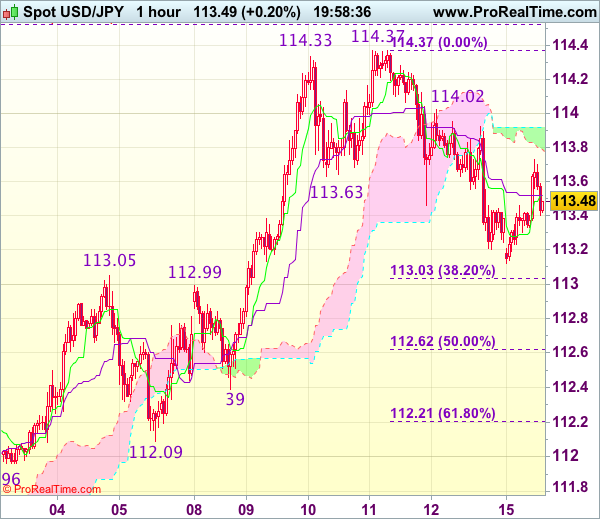
Trade Idea Update: USD/JPY – Buy at 112.70
USD/JPY - 113.47
Original strategy :
Buy at 112.70, Target: 113.80, Stop: 112.35
Position : -
Target : -
Stop : -
New strategy :
Buy at 112.70, Target: 113.80, Stop: 112.35
Position : -
Target : -
Stop : -
As the greenback dropped last Friday’s on dollar’s broad-based weakness, suggesting temporary top has been formed at 114.37 last week and near term downside risk remains for a stronger correction of recent rise to 113.00-05, however, 112.60-65 (50% Fibonacci retracement of 110.87-114.37) should limit downside and bring rebound later, above 113.75 would bring test of 114.00-05 but break of latter level is needed to signal the pullback from 114.37 has ended, bring retest of this level later.
In view of this, we are inclined to buy dollar on next decline but one should exit on such rebound as 114.37 resistance should cap upside. Below support at 112.39 would risk further weakness to 112.20-25 (61.8% Fibonacci retracement of 110.87-114.37) but still reckon previous support at 112.09 would hold from here.
Financial Markets Seeking Inspiration
An eerie calm shrouded the financial markets last week, with global stocks floating near record highs as investors maintained a cautious trading stance. The rising anxiety over ongoing geopolitical tensions has exposed Asian shares to losses during early trading on Monday with some disappointing data from China compounding to the downside pressure. Although the current absence of political risk in Europe continues to elevate European equities, the upside may face headwinds down the road from the persistent uncertainty gravitating around Brexit.
Wall Street relinquished short-term gains on Friday following the soft retail sales and inflation data and should be poised to edge lower this afternoon as investors re-evaluate the likelihood of an interest rate increase in June. With an air of anxiety suffocating participants who seek risk, and soft economic data from the US and China weighing on sentiment, the "Sell in May and go away" strategy may become a popular choice.
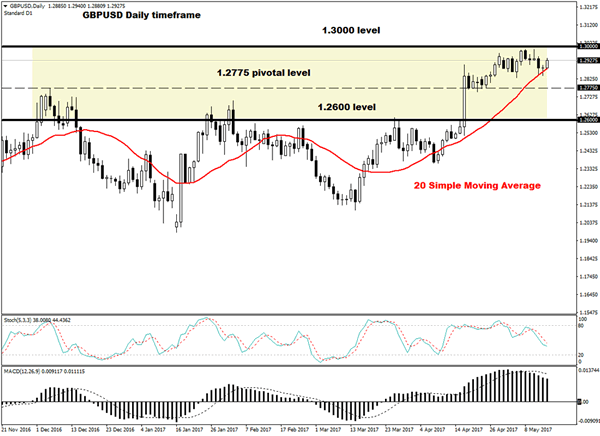
Sterling edges above 1.2900
Sterling ventured higher on Monday but this appreciation felt more technical than fundamental as prices found support above the daily 20 Simple Moving Average. Although short term bulls may exploit the upside momentum to elevate the Pound higher towards 1.3000, uncertainty over Brexit should limit gains in the medium to longer-term. Sterling bears still have a shot to attack, especially when considering that the threat of Brexit negatively impacting the UK economy has encouraged the Bank of England to maintain a dovish stance. The central bank has already trimmed its prediction for growth this year amid the Brexit uncertainty while rising levels of inflation and sluggish wage continue to dent consumer confidence. With consumer spending likely to face a squeeze amid the accelerating inflation and vulnerable Sterling, the GBPUSD still remains exposed to downside risks.
While bulls may propel the GBPUSD towards 1.3000 in the short term, repeated weakness below 1.2775 will encourage a decline towards 1.2600.
WTI offered another lifeline
Oil markets received a solid boost on Monday and bulls offered a lifeline after top exporters Saudi Arabia and Russia said that supply cuts should be extended until March 2018. While the prospect of the world's two top oil producers working together to battle the oversupply woes may support WTI in the short term, gains may be limited if US Shale's incessant pumping sabotages OPEC's effort to stabilize the markets.
Although most remain cautiously optimistic that the OPEC meeting on 25 May will result in an extension to the supply cut deal, one should learn to always expect the unexpected when dealing with the cartel. From a technical standpoint, a daily close above $49 on WTI Crude should encourage a further appreciation towards the psychological $50 level.
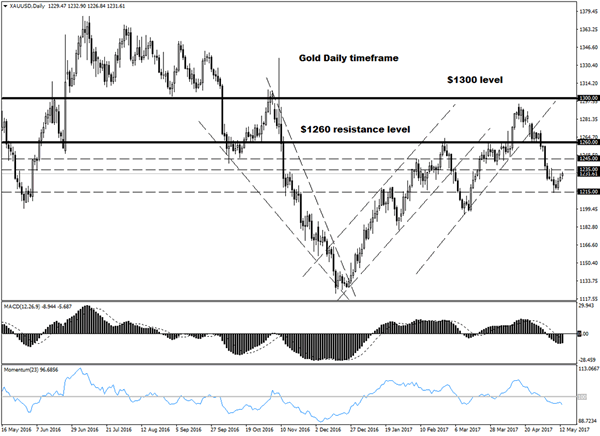
Commodity spotlight - Gold
Gold edged higher on Monday after weaker than expected economic data from the US on Friday exposed the Dollar to losses. Ongoing geopolitical tensions concerning North Korea continue to support the yellow metal with prices trading around $1230 as of writing. Although Gold remains technically bearish on the daily charts, this period of uncertainty should trigger a technical bounce that opens a path towards $1245. From a technical standpoint, bulls need a daily close above $1235 to open the gates towards $1245. In an alternative scenario, a breakdown below $1225 may trigger a selloff back towards $1215.
Dollar Held to Ransom
Monday May 15: Five things the markets are talking about
Global equities start the week better bid, shrugging off cyber attack threats, a missile test in North Korea, and weak U.S data.
Friday's U.S retail sales and inflation data may suggest that expectations for global growth have run too high.
Nevertheless, investor optimism over China's international infrastructure plans (an alternative to TPP) is offsetting concerns over the strength of the global economy.
Oil and commodity currencies are surging on expectations for a supply cut.
In Germany, Chancellor Merkel party won an election in the country's most populous state yesterday, solidify her lead ahead of Germany national election in September.
The Fed remains on track to hike rates next month with jobless claims at a 28-year low and the unemployment rate down to +4.4%, however, the odds have fallen to +70% from +83% on waning U.S inflation outlook.
On the data front this week, in Japan, GDP for Q1 will be the focus, with growth expected to have accelerated. In the U.K, inflation numbers are due tomorrow, followed by a labor market report Wednesday.
In the U.S, it's a slow week, however, tomorrow's industrial production print will provide useful insight into how the factory sector is performing.
1. Despite geopolitical risks, equities supported
Resilient Asian stocks continue to trade atop of their two-year high overnight, shaking off threats from by a ransom ware attack and North Korea saber rattling.
In Japan, regional stocks were small pressured by a stronger yen (¥113.47). The Nikkei share average fell -0.1%, while the broader Topix fell -0.04%.
In Hong Kong, the Hang Seng China Enterprises Index rose +1.5%, climbing for a sixth consecutive session.
In China, the Shanghai Composite Index rose +0.2%, and the Hang Seng Index advanced +0.7%.
In Europe, it's a quiet start to trading despite the event packed weekend. The Eurostoxx 600 has added +0.2%, after touching the highest level in two years last week. The FTSE has got a boost from the uptick in commodities.
U.S stocks are set to open little changed.
Indices: Stoxx50 -0.2% at 3631, FTSE +0.1% at 7444, DAX little changed at 12763, CAC-40 -0.1% at 5400, IBEX-35 +0.2% at 10920, FTSE MIB +0.3% at 21642, SMI -0.3% at 9100, S&P 500 Futures +0.1%
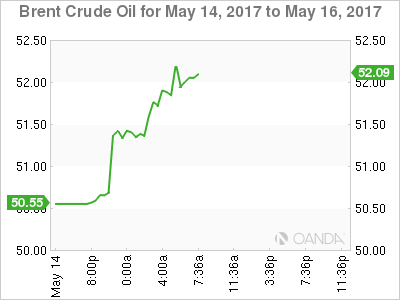
2. Oil jumps as Russia and the Saudi's back longer supply cuts
Oil prices have rallied more than +2% ahead of the U.S open, after Saudi Arabia and Russia said supply cuts need to last into next-year.
The market views this as a step towards keeping an OPEC-led deal to support prices in place longer than originally agreed.
Energy ministers from both countries said that supply cuts should be extended for nine months, until March 2018.
Note: That is longer than the optional six-month extension specified in the November 2017 deal.
Brent crude has rallied +$1.20 to +$52.04 a barrel, while U.S light crude (WTI) is up +$1.18 at +$49.02 a barrel.
Note: Global inventories remain high, and the output from other producers, especially the U.S is rising, which is keeping prices below the psychological +$60 some OPEC members would like to see.
OPEC and non-OPEC countries meet to decide policy on May 25 in Vienna
Data on Friday showed that U.S energy firms added oil rig's for a 17th consecutive week, extending a 12-month drilling recovery.
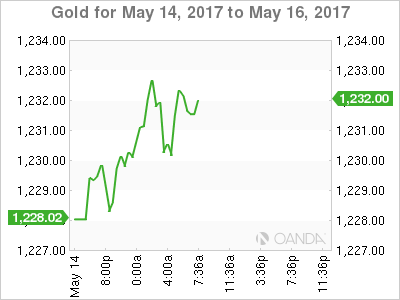
Gold prices have edged higher on weaker-than-expected U.S data and a missile test by North Korea over the weekend pressured the dollar. Spot gold is up + 0.3% at +$1,232.45 per ounce. The yellow metal rose +0.3% on Friday.
3. Global yields on the move
Friday's disappointing U.S data (Retail Sales and CPI) has fixed income dealers trimming the odds for a Fed hike next month. Fed fund futures currently see a +70% chance of a hike, down from +83% Friday morning.
The yield on 10-year Treasury notes has backed +1 bps to +2.34%, after dropping -6 bps Friday when the weaker-than-expected CPI report buoyed bond prices.
Elsewhere, yields on Aussie 10's lost -5 bps to +2.59%. Benchmark yields in France and Germany rose +1 bps.
A rise in German yields above the psychological +0.5% mark is expected to meet with strong resistance, however, the strengthening economic development in the eurozone and the robust outlook may make ECB monetary policy normalization conceivable and even sooner than later.

4. "Big" dollar losing some love
Last weekend's G7 Finance Ministers and central bank meeting did not provide any surprises.
G7 reiterated its pledge on FX - "that excess volatility was bad for growth" and declared their commitment against "competitive devaluation."
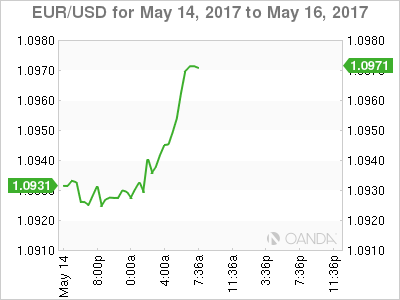
Ahead of the U.S open, the FX markets are somewhat subdued with the USD facing resistance from further underwhelming data. The EUR remains steady trading atop of €1.0940, while USD/CHF has dipped below parity to $0.9989. The pound continues to flounder below £1.2950, while USD/JPY is little changed at €113.42.
Petro-currencies (NOK, CAD, MXN) have all got a boost from higher crude oil prices overnight.
Note: Turkish markets will watch President Erodgan's meeting with U.S President Trump tomorrow. It's considered crucial for geopolitical developments in the region- USD/TRY is last down -0.3% at $3.5618.
5. China's Xi and data
China President Xi said on Sunday that China would "strike a balance between financial stability, gradual deleveraging, and steady economic growth, noting that China was capable of maintaining stability in its financial markets."
Such market-friendly language helped offset economic concerns triggered by news that China's factory output and fixed asset investment growth cooled more than expected last month.
China April Industrial Production: y/y - +6.5% vs. +7.0%e, while Retail Sales: y/y - +10.7% vs. +10.8%e.
China National Bureau of Statistics (NBS) said that economic growth was still within a "reasonable range," yet; overcapacity remained a serious problem in some sectors.