
Sample Category Title
US Dollar Slips On Soft Inflation Figures. Quiet Day Ahead
The US dollar fell sharply on Friday after data showed that consumer price index rose 0.2% on a month over month basis in April. This was a modest improvement following the 0.3% decline in March. Economists polled were expecting inflation to rise 0.3% instead.
Retail sales numbers were also soft, rising 0.4%, less than the forecasts of 0.6% increase. March's retail sales numbers were revised from -0.2% to 0.1%.
The US dollar was seen trading subdued on today's open. Economic data released so far showed China's industrial production rise 6.5%, less than the expected 7.0%, while retail sales rose 10.7%, slightly below forecasts of 10.8%.
Later in the day, the NY Fed's Empire State Manufacturing index is coming up with economists’ expecting the manufacturing activity in the New York area to rise to 7.2 after slipping to 5.2 the month before. Manufacturing activity in the New York area was seen weakening for the past two consecutive months.
EURUSD intraday analysis
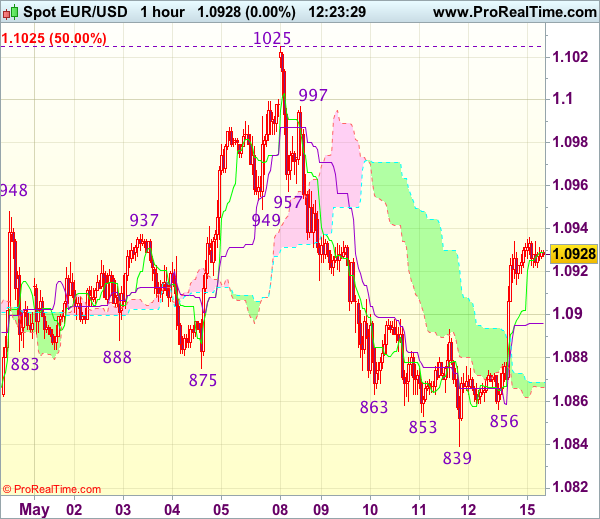
EURUSD (1.0930): EURUSD brushed past the 1.0900 price level on Friday, and further gains are likely to come by if support is seen being established at 1.0900. This would potentially keep the upside target towards 1.1000 in sight. However, a continuation without a pullback could see EURUSD test 1.0950 where resistance could be formed. This would mark a pullback from the recent declines and could signal a continuation towards 1.0850 followed by 1.0750.
GBPUSD intraday analysis
GBPUSD (1.2905): The British pound gapped lower this morning, opening at 1.2801 with price posting strong gains, currently trading at 1.2899 and recovering the past losses. On the 4-hour chart, the test to 1.2800 comes as a retest of the upside break-out from the bullish flag pattern that emerged three weeks ago. With prices testing 1.2900 level, further upside could be seen coming but watch for the familiar resistance at 1.2988 - 1.2965.
XAUUSD intraday analysis
XAUUSD (1230.86): Gold prices have been posting a modest recovery for the past three days after the price fell to a two month low at 1214.24. The upside recovery could continue if gold posts a higher low on the 4-hour chart. The downside correction could see price retest the support at 1221.47 where a higher low could confirm the upside in price. Resistance is seen coming in at 1250.00, although a continuation to the upside could see further gains pushing gold prices to 1263.00 and 1274.00.
Will Market Volatility Pick Up In The Week Ahead?
Last week was unusually quiet for the financial markets in terms of volatility and with the economic calendar relatively light over the next couple of days, the week ahead might be similar. It is a bit early to attribute the lower levels of market movements to a possible summer lull being upon us and instead, I would credit this to traders being on the right side of the trade in regards to the recent French elections and not needing to make any sudden moves in reaction to the event.
It is important to also bear in mind that there are two major event risks over the next couple of weeks, including the OPEC meeting on 25 May in Vienna and the UK general elections scheduled for 8 June. This should ensure that investors remain alert towards possible developments, preventing traders from taking their foot away from the pedal with summer fast approaching.
China making further steps towards globalization
One of the major financial stories to have gathered attention over the weekend has been the news that China's President Xi Jingpin has pledged $124bn to the Belt and Road global trade project, which provides further indications that China is taking steps towards embracing globalization. While populism and initiatives to move away globalization are still seen as threats in some advanced economies, China seems to be going full steam ahead with embracing the concept and proving itself as a reliable superpower in the global economy.
The news around the China's $124bn investment in the Belt and Road initiative falls sharply on the heels of the headline late last week that the United States and China have signed their own trade agreement. Under the agreement, it is thought that the Chinese market will be open to US credit rating agencies and credit card companies, while Chinese banks can also enter the US market in return.
This move does go some way towards supporting the previous indications of late that diplomatic relations between China and the United States are warming, which should gradually improve the public perception of President Trump in mainland China and also cool down the fears from late last year that China would suffer under a Trump presidency.
GBPUSD to remain under pressure with UK inflation ahead?
The Pound/Dollar found itself on the end of two days of successive losses to conclude the previous week, after investors found encouragement to drag the pair lower from its recent 2017 high narrowly below 1.30 following the Bank of England (BoE) downgrading its growth forecast for the UK economy this year.
For those looking for a recovery in the pair from here, it is worth pointing out that the BOE repeating its negative views on price pressures might weigh on investor sentiment with the latest UK inflation reading scheduled for this coming Tuesday.
Will upcoming data from Europe continue to suggest the Euro is undervalued?
Now that the French elections are out of the way and with Europe appearing like it has fared better than the United States and United Kingdom in defeating populism, I am expecting for more arguments to be made that the EU currency is undervalued.
Most headlines around Europe over the past couple of months have ignored macro-economics and instead focused on the several political events that have been scheduled around the continent. While this makes sense with the shock results of the EU referendum and US elections, it has completely slipped under the radar that the EU economy has been picking up momentum in 2017.
I do feel that investors should now start paying closer attention towards the economic data coming out of Europe, and I am firmly bullish on the Euro over the medium and longer-term.
Currencies: Dollar Comeback Aborted By Weaker Eco Data
Sunrise Market Commentary
- Rates: Short term picture neutral for core bonds
The Bund and US Note future moved back above 160.64 and 125-04+/03 levels on Friday, making the technical picture more neutral again. Given this week's razor thin eco calendar, we expect sideways action. If oil prices extend their rally, they could nevertheless inflict some losses on core bonds. - Currencies: Dollar comeback aborted by weaker eco data
After Friday's dollar sell-off, we expect more sideways-oriented trading today and maybe also further this week. The eco calendar is razor thin and equity sentiment seems neutral as positives (Merkel's surprising regional election victory) and negatives (North Korea / cyber-attack) cancel each other out.
The Sunrise Headlines
- US equities closed the session again narrowly mixed after a largely sideways trading session, shrugging off weaker eco data. Overnight, Asian stock markets trade mixed with China outperforming despite weaker data.
- An unrivalled global cyber-attack is poised to continue claiming victims, even as UK health facilities whose systems were crippled early in the assault are returning to normal operation.
- Chancellor Merkel's conservatives won a surprise victory in regional elections in Germany's most populous state (North Rhine-Westphalia) giving Europe's most powerful leader a boost in the run-up to national elections in September.
- Oil prices jumped after the energy ministers of top producers Saudi Arabia and Russia jointly said that an OPEC-led crude production cut would be extended from the middle of this year until March 2018.
- Chinese eco data disappointed. Retail sales (10.7% Y/Y), industrial production (6.5% Y/Y) and fixed asset investment growth (8.9% Y/Y) all cooled more than expected in April.
- Downside risks to inflation continue to cloud the outlook for interest rates despite an otherwise healthy US economy, Chicago Fed Evans said. He added that he could be fine with two more rate increases this year.
- North Korea fired a ballistic missile early Sunday, just days after South Korea elected a president who vowed to engage with Un's regime to defuse tensions over its nuclear weapons program
Currencies: Dollar Comeback Aborted By Weaker Eco Data
Dollar suffers modest loss on small data miss
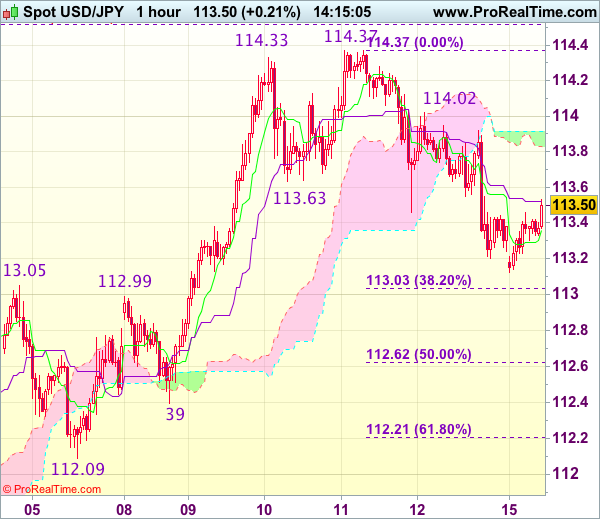
On Friday, the dollar lost ground against euro and yen after weaker than expected US inflation and retail sales pushed US yields lower, narrowing the yield spread versus Germany (and Japan) somewhat. EUR/USD traded ahead of the data in a tight 1.0860/80 range, but surged after the US data release to 1.0933 in the close, up from 1.0861 on Thursday eve. Equities held up well in the face of the data, but couldn't avoid USD/JPY weakening either, even if it was slightly more limited than the EUR/USD gains. USD/JPY fell from openings levels at 113.96 to intraday lows around 113.20 before closing at 113.38, a loss of about 50 ticks.
High oil prices support commodity currencies
Overnight, Asian stocks trade narrowly mixed with China outperforming despite weaker data. Increased signs of an extending of the OPEC production cut agreement to March 2018 (see headlines) pushes oil (and many other commodities) higher. This is reflected in modestly higher commodity currencies. USD/JPY pushes higher to 113.36, reversing some of the opening losses, but is still only level with Friday's close. EUR/USD is little changed at 1.0935.
Calm trading amid thin calendar
Markets expect a modest improvement in the May NY Fed manufacturing survey while the NAHB homebuilders' sentiment index is expected unchanged at lofty levels. We see no reasons to expect sharp deviations from these data releases, which don't have strong market moving potential. Friday's sharp negative reaction of the dollar shows that it remains vulnerable to weaker data. The market slightly reduced Fed rate hike expectations, especially for H2 meetings. The expected chance for a June rate hike is still an overwhelming 97%, according to Bloomberg data. Merkel's regional election victory in NRW is a euro and equity positive event, while the worldwide cyber-attack and the North-Korean missile launch are equity negative, so they cancel each other out. The uninspiring eco and event calendars suggest technical and sentiment driven range-trading today.
Short term trading assessment
The USD/JPY rebound ran into resistance last Thursday when equities stabilized and Friday on weak US inflation and retail sales. A correction was upcoming after a 6 big figure gain from mid-April to mid-May. The weaker data and stabilizing equities were a welcome trigger.
Some more corrective losses shouldn't surprise, but as long as USD/JPY 112.20 holds, the outlook for the dollar versus yen remains positive. A buy on dips of USD/JPY near these levels looks appropriate. The Fed will continue to tighten policy and the stronger labour market should ultimately lead to higher wages and inflation. If so, EUR/USD might revisit the 1.0821/1.0778 support (gap). However, Friday's data poured some cold water on the dollar's short term comeback chances. The US and EMU eco calendars are unattractive this week, which means trading may be confined to the 1.0821/1.0778 to 1.1023 range.
Technical notes
From a technical point of view, USD/JPY broke the 112.20 resistance, improving the technical picture. The rebound continues in a gradual way, but looks quite robust. Next intermediate resistance comes in at 115.51. EUR/USD extensively tested the topside of the MT range (1.0874/1.0906 area) late March. The pair finally broke above the 1.09/1.0950 resistance last week, but the break wasn't confirmed and a correction kicked in. A sustained break higher would improve the ST picture. Next resistance stands at 1.1129 (62% retracement) and at 1.1366 (correction top). A decline below 1.0821 suggests that the dollar is regaining traction against the euro.
EUR/USD: EUR/USD fall aborted after weaker eco data
EUR/GBP
Post-BoE repositioning pushes EUR/GBP closer to 0.85
Sterling remained under pressure versus the euro during the Friday's session Investors adapted positions further as they concluded after Thursday's policy meeting that the BoE won't tighten soon, hampered by parliamentary elections and second and Brexit negotiations. EUR/GBP rose further after the weaker US eco data (inflation and retail sales) as EUR/USD outperformed cable. EUR/GBP started the day at 0.8430 to close at 0.8476, with an intraday top at 0.8488, a 47 pips daily gain. Cable fell in the morning on sterling weakness, but recovered after the US eco releases when dollar weakness dominated. Cable closed nearly unchanged at 1.2890.
There are no eco data in the UK or EMU today and the US data are second tier and likely near consensus. Technical considerations and sentiment should drive the price action. Sterling gained against the euro and dollar overnight, likely as a reaction to Friday's losses. Cable re-takes the 1.29 handle, EUR/GBP drops to 0.8467. We consider it as consolidation which might be the dominant theme in today's session. EUR/GBP is locked in a ST broad sideways range (0.83/0.85) after a substantial decline in March/April. Recent price suggest a bottoming out of EUR/GBP with 0.84/0.8330 a solid bottom. To improve the EUR/GBP picture, we need to see a break of 0.8508/31 (previous ST tops). On technical considerations, we slightly prefer a EUR/GBP buy-on-dips approach at levels closer to 0.83. Longer term, Brexit-complications remain potentially negative for sterling.
EUR/GBP: Sterling loses on follow through post BOE selling and EUR/USD outperforming cable after weaker US data
GDP Indicator For Q1 Is Due To Be Published Today At 09:00 CET
Market movers today
Today is a rather quiet day in terms of data releases (so is the rest of the week actually). In the US, regional PMIs begin to tick in now and we estimate them to have declined from their extremely high levels, as they have overshot ISM/Markit PMI. The Empire manufacturing index data is due out today.
In Denmark, the GDP indicator for Q1 is due to be published today at 09:00 CET. We estimate GDP grew by 0.4% q/q in Q1, as private consumpt ion seems to have made a decent start to 2017 and thestatistics for business revenue are also pointing up.
In Norway, trade data for April is due out today but more important is the GDP data for Q1, which is due out tomorrow.
Selected market news
The German state election in North Rhine-Westphalia proved to be another victory for CDU/CSU and Angela Merkel. Given that Merkel continues to solidify her posit ion of strength, the 'Schulz-effect ' fading and the fact t hat North Rhine-Westphalia is the most populous of the German states, the out come bodes well for Merkel's chances of being re-elected as Chancellor at the general federal election in September.
While Chinese industrial production and retails sales released this morning were largely in line with expectations, we continue to see risks in China as tilted to the downside. PMI decreased sharply in April, commodity prices for oil and metals have lost momentum, there has been a sharp rise in yields and the Chinese stock market has fallen over the past month to the lowest level in four months See Strategy: Downside risks to China – and what it means for the market, 11 May 2017.
US retail sales and CPI data released on Friday confirmed that the US economy is slowing down. While retails sales remained st rong (although weaker than expected), the CPI data showcased an economy that is slowing down. Headline inflation decreased to 2.2% y/y (2.4% in March), but even more interesting was that core inflation was unable to offset the surprising drop seen in March – even with the timing of Easter having an upward effect on April's print. On the inflation front, the market now shifts to April's PCE prints (due to be released 30 May), which the Fed tends to prefer as its benchmark when reviewing economic conditions.
Trading during Asian hours has been fairly uneventful, with Japanese government bond yields slight ly lower, Nikkei slighter down and Hang Seng adding 0.5%. However, oil advanced after Saudi Arabia and Russia said they favoured extending production curbs.
USD/JPY Candlesticks and Ichimoku Analysis
Weekly
• Last Candlesticks pattern: Marubozu
• Time of formation: 14 Nov 2016
• Trend bias: Down
Daily
• Last Candlesticks pattern: Shooting star
• Time of formation: 15 Feb 2017
• Trend bias: Down
USD/JPY – 112.71
As the greenback has eased after meeting resistance at 114.37, suggesting consolidation below this level would be seen and pullback to the upper Kumo (now at 112.81) is likely, however, reckon downside would be limited to 111.70-75 and price should stay above the Kijun-Sen (now at 111.25) and bring another rise later, above said resistance at 114.37 would extend recent rise from 108.13 low to 114.60-65 (61.8% Fibonacci retracement of 118.66-108.13), then 115.00 but reckon upside would be limited to indicated key resistance at 115.51, bring retreat later.
On the downside, whilst initial pullback to the upper Kumo (now at 112.81) cannot be ruled out, reckon downside would be limited to 112.05-10 and renewed buying interest should emerge around 111.70 and the Kijun-Sen (now at 111.25) should hold, bring another rise later. Below 110.85-90 would suggest top is possibly formed, bring correction to 110.00 but support at 109.59 should remain intact, bring rebound later. Only a daily close below this support at 109.59 would confirm and bring weakness to 108.85-90 but break there is needed to signal the rebound from 108.13 has ended, then retest of this recent low would follow.
Recommendation : Buy at 111.70 for 113.70 with stop below 110.70.
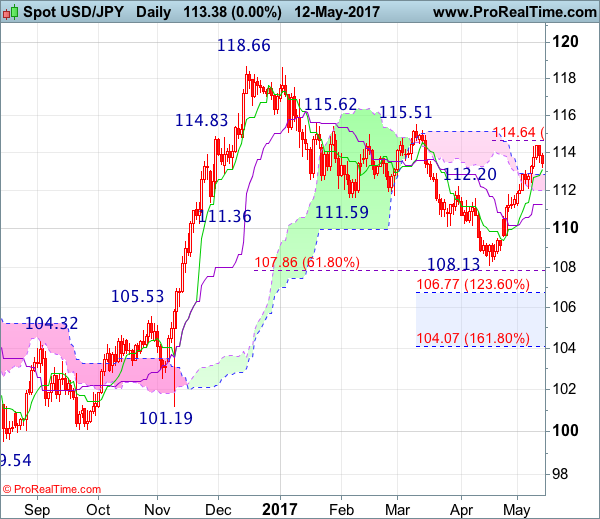
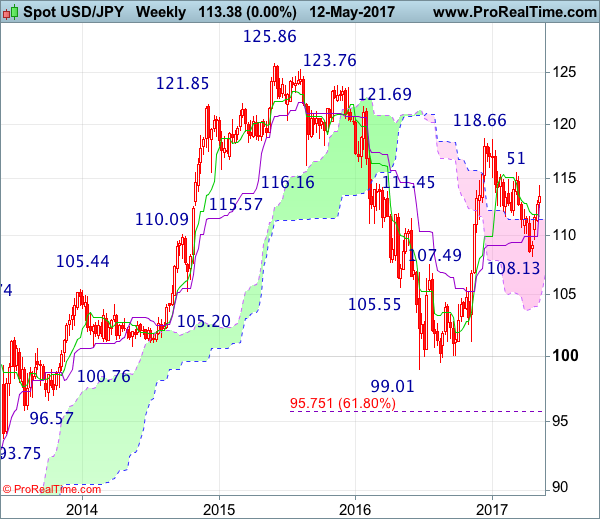
On the weekly chart, although dollar edged higher to 114.37 last week, lack of follow through buying suggests initial consolidation below this level would be seen and pullback to 112.00-10 cannot be ruled out, however, reckon downside would be limited to 111.70-75 and bring another rise later, above said resistance at 114.37 would extend the rise from 108.13 to 114.60-65 (61.8% Fibonacci retracement of 118.66-108.13), however, reckon upside would be limited and price should falter well below resistance at 115.51. Looking ahead, only a break of 115.51 would retain bullishness and signal the entire correction from 118.66 has ended at 108.13), bring further rise to 119.50, then 120.00-10 but resistance at 121.69 should remain intact.
On the downside, expect pullback to be limited to 112.00-05 and the Tenkan-Sen (now at 111.25) should hold, bring another rise later. Below support at 111.21 would defer and suggest top is possibly formed, risk weakness to 110.45-50 but only break of indicated previous support at 109.59 would add credence to this view, bring further fall to previous resistance at 109.49. A drop below this level would provide confirmation, bring weakness to 108.80-85, break there would bring retest of 108.13 support, once this level is penetrated, this would revive bearishness an extend recent selloff from 118.66 to 107.85-90 (61.8% Fibonacci retracement of 101.19-118.66), then towards 107.00, however, reckon downside would be limited to 106.50-55 (61.8% Fibonacci retracement of 99.01-119.52) and previous resistance at 105.53 (now support) should remain intact.
Trade Idea : USD/CHF – Stand aside
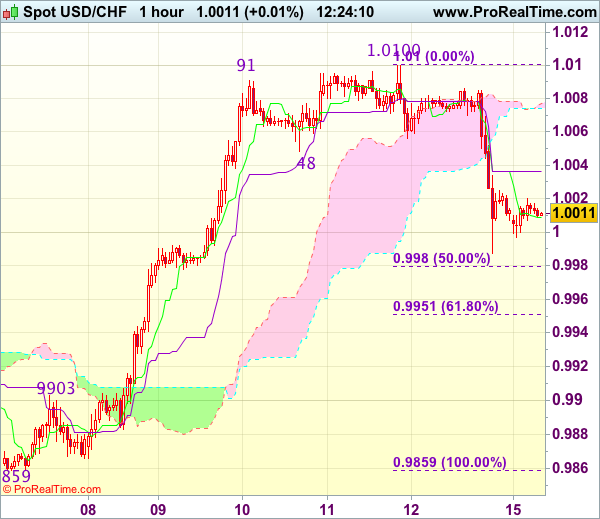
USD/CHF - 1.0005
Most recent candlesticks pattern : N/A
Trend : Near term up
Tenkan-Sen level : 1.0010
Kijun-Sen level : 1.0037
Ichimoku cloud top : 1.0078
Ichimoku cloud bottom : 1.0074
New strategy :
Stand aside
Position : -
Target : -
Stop : -
Friday’s selloff suggests a temporary top has possibly been formed at 1.0100 last week and consolidation with downside bias remains for retracement of recent rise towards 0.9980 (50% Fibonacci retracement of 0.9859-1.0100), break there would add credence to this view, bring further fall to 0.9950-55 (61.8% Fibonacci retracement) but price should stay well above previous resistance at 0.9903, bring rebound next week.
In view of this, would be prudent to stand aside in the meantime. Above 1.0045-50 would bring recovery to 1.0080-85, however, price should falter below strong resistance at 1.0100-8 and bring further consolidation later.
Trade Idea : GBP/USD – Hold short entered at 1.2900
GBP/USD - 1.2919
Most recent candlesticks pattern : N/A
Trend : Near term up
Tenkan-Sen level : 1.2900
Kijun-Sen level : 1.2882
Ichimoku cloud top : 1.2919
Ichimoku cloud bottom : 1.2894
Original strategy :
Sold at 1.2900, Target: 1.2800, Stop: 1.2935
Position : - Short at 1.2900
Target : - 1.2800
Stop : - 1.2935
New strategy :
Hold short entered at 1.2900, Target: 1.2800, Stop: 1.2935
Position : - Short at 1.2900
Target : - 1.2800
Stop : - 1.2935
As cable has rebounded again after finding strong support at 1.2844 on Friday, suggesting near term upside risk remains but as long as 1.2930 holds, further consolidation would take place and bearishness remains for another decline, below 1.2860 would bring retest of 1.2844 support but break there is needed to extend the fall from 1.2991 top to 1.2831 support, break there would bring subsequent weakness to 1.2805 and later towards 1.2770, however, reckon previous support at 1.2757 would hold from here.
In view of this, we are holding on to our short position entered at 1.2900. Above 1.2930 would risk test of 1.2950-60 but break there is needed to signal low is formed, bring another bounce towards 1.2988-91 resistance but break of 1.2999-00 (1.236 times projection of 1.2109-1.2616 measuring from 1.2365 and psychological resistance) is needed to revive bullishness.
Trade Idea : EUR/USD – Sell at 1.0995
EUR/USD - 1.0936
Most recent candlesticks pattern : N/A
Trend : Near term down
Tenkan-Sen level : 1.0930
Kijun-Sen level : 1.0897
Ichimoku cloud top : 1.0869
Ichimoku cloud bottom : 1.0866
Original strategy :
Sell at 1.0980, Target: 1.0860, Stop: 1.1015
Position : -
Target : -
Stop : -
New strategy :
Sell at 1.0995, Target: 1.0880, Stop: 1.1030
Position : -
Target : -
Stop : -
Euro has staged a strong rebound after falling to 1.0839, suggesting consolidation above this level would be seen and near term upside risk remains for further gain to 1.0960, however, if our view that top has been formed at 1.1025 is correct, upside would be limited and resistance at 1.0997 should hold, bring another decline later. Below 1.0895-00 would bring weakness to 1.0855-60 but break there is needed to retain bearishness an extend the fall from 1.1025 top to 1.0821, then 1.0795-00 later.
In view of this, we are still looking to sell euro but at a higher level as 1.0997 resistance should limit upside. Only break of said resistance at 1.1025 would abort and signal early upmove has resumed instead, bring further gain to 1.1050-55 and later 1.1075-80 before prospect of another retreat.
Trade Idea : USD/JPY – Buy at 112.70
USD/JPY - 113.39
Most recent candlesticks pattern : N/A
Trend : Near term up
Tenkan-Sen level : 113.30
Kijun-Sen level : 113.52
Ichimoku cloud top : 113.92
Ichimoku cloud bottom : 113.83
New strategy :
Buy at 112.70, Target: 113.80, Stop: 112.35
Position : -
Target : -
Stop : -
As the greenback dropped last Friday’s on dollar’s broad-based weakness, suggesting temporary top has been formed at 114.37 last week and near term downside risk remains for a stronger correction of recent rise to 113.00-05, however, 112.60-65 (50% Fibonacci retracement of 110.87-114.37) should limit downside and bring rebound later, above 113.60-65 would bring test of 114.00-05 but break of latter level is needed to signal the pullback from 114.37 has ended, bring retest of this level later.
In view of this, we are inclined to buy dollar on next decline but one should exit on such rebound as 114.37 resistance should cap upside. Below support at 112.39 would risk further weakness to 112.20-25 (61.8% Fibonacci retracement of 110.87-114.37) but still reckon previous support at 112.09 would hold from here.
Europe Seen Higher As Oil Spikes On Output News
- Markets boosted by Chinese stimulus plans and oil rally;
- Chinese data disappoints but consumer spending remains strong;
- Oil rallies as Russia and Saudi energy ministers support output cut extension;
- Traders look for signs of 'upside news on growth or inflation' in this week's UK data.
European equity markets are expected to open a little higher on Monday, tracking gains throughout most of Asia and buoyed by gains in oil.
We've seen moderate gains throughout most of Asia overnight, with the exception of Japan where earlier advances in the yen appear to have weighed on the index. While reports over the weekend of a global cyberattack and another missile launch from North Korea may have prompted some risk aversion this morning, it seems the prospect of substantial infrastructure spending from China and its commitment to free trade is taking priority.
Even the softer than expected figures from China overnight are being overlooked, with retail sales, industrial production and fixed asset investment figures all falling short of expectations. Double digit growth in consumer spending remains a positive of the data, given the efforts to move away from a reliance on investment and exports.
Oil prices are up more than 1.5% in early trade on Monday, boosted by reports over the weekend that energy ministers from Russia and Saudi Arabia support extending production cuts by another nine months to the end of the first quarter of next year. The two countries – which are responsible for around a fifth of total daily output – are crucial to the success of the cut and I would now expect other participating nations to get behind the extension as well.
Of course, with the US taking full advantage of higher prices and increasing output rapidly at the same time, attempts to rebalance the oil market have been more difficult than anticipated. With any extension likely to keep prices elevated, it will be interesting to see whether the US can continue to ramp up production on the same scale as it has in recent months. If so, compliance with any new cut and the rebalancing efforts will be severely tested with both Russia and Saudi Arabia not wanting to lose market share in key markets.
It's likely to be another relatively quiet week on the data side, with the UK being a particular focus in Europe. Inflation numbers on Tuesday will be followed by the latest labour market figures on Wednesday and retail sales on Thursday, as traders look for evidence of the economy or prices rising faster than expected, given that, in the words of the Bank of England, 'some MPC members would need relatively little upside news on growth or inflation to consider voting for tighter policy'. Should we see signs of this in the coming days, it could offer a boost for sterling as it moves back above 1.29 against the dollar again, with the focus very much on 1.30.