Sample Category Title
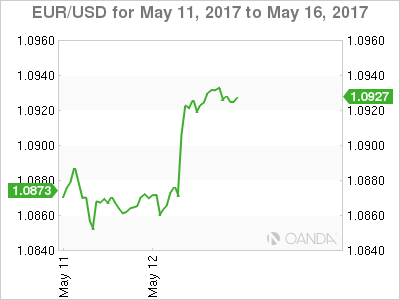
EURUSD – Retains Upside Bias On Recovery
EURUSD - With the pair retaining its short term uptrend, more strength is envisaged. Resistance comes in at 1.1000 level with a cut through here opening the door for more upside towards the 1.1050 level. Further up, resistance lies at the 1.1100 level where a break will expose the 1.1150 level. Conversely, support lies at the 1.0900 level where a violation will aim at the 1.0850 level. A break of here will aim at the 1.0800 level. Its weekly RSI is bullish and pointing higher suggesting further strength. All in all, EURUSD faces further bull threats.
GOLD – Hesitates, Closes Higher
GOLD - The commodity halted its weakness to close higher the past week. On the downside, support comes in at the 1,220.00 level where a break will turn attention to the 1,210.00 level. Further down, a cut through here will open the door for a move lower towards the 1,200.00 level. Below here if seen could trigger further downside pressure targeting the 1,190.00 level. Conversely, resistance resides at the 1,230.00 level where a break will aim at the 1,240.00 level. A turn above there will expose the 1,250.00 level. Further out, resistance stands at the 1,260.00 level. All in all, GOLD looks to weaken further but with caution.
AUD/JPY Stepping Down Between Support/Resistance Levels
After AUD/JPY resistance held back in February, we've seen a pullback in the pair worth another look.
The following excerpt is taken from from the previous AUD/JPY feature which I've linked to in the previous paragraph:
Here is the zone once again. It doesn't really get much clearer that this:
AUD/JPY Daily:
As you can see quite clearly, higher time frame resistance held and price subsequently dropped.
Keep that one in mind and now compare that above chart to the following updated daily chart, showing where we're at now:
AUD/JPY Daily:
This is where you can see that price has now pulled back to retest previous short term support, this time as resistance. An opportunity to look for a continuation if you're still in, and a chance to get short if you missed the first entry.
Zooming into the hourly chart, you can see a further intraday pullback into previous support turned resistance:
AUD/JPY Hourly:
Depending on how aggressive you are a trader, there are a few levels here that you could use to manage your risk and position sizing around.
How are you looking to trade the Aussie?
Should We Look Past The US Q1 Soft Patch?
Should we look past the US Q1 soft patch?
Friday was another disheartening day for US economic data and has left dollar bulls in doubt entering this week. Focus shifts to pivotal European economic releases, as the lack of tier one US economic announcements this week, will leave US investors lamenting on Friday's weaker retail sales and disappointing consumer price index prints. Given the recent trend of deteriorating US data, set against a backdrop of other G-10 economies that have surveyed data print above expectations, if this bias persists it may bode poorly for the US dollar's performance this week.
We can sugar-coat Friday's retail sales data, which rebounded from two sluggish months and was mitigated by a three-tenth upward revision to March. But the cold, hard fact is that the figures grew just 0.4%; badly missing market expectations of 0.6%, which did little to convince investors that a recent run of weak US economic performance was reversing. While confidence was extremely elevated for a high rebound after a poor print in March, the dollar may have got off easy this time, as the Fed had already warned the market that they would look through the Q1 US economic soft patch, so why shouldn't traders? If the deterioration in tier one US economic data continues, I think it will be time for a reality check, as both the market tonality, along with Fed policy expectations, could yaw significantly.
While the CPI missed the Fed's 2% mandate level, the print itself is unlikely to alter June rate hike expectations. A miss on both Retail sales and CPI is concerning and resulted in a modest repricing for hike odds to just over 70% in June and only a 50%.But US labour markets remain robust and parsing the recent Fed speak; there is little slack left in labour markets, so the FOMC will likely remain unwavering on it's tighter policy path.
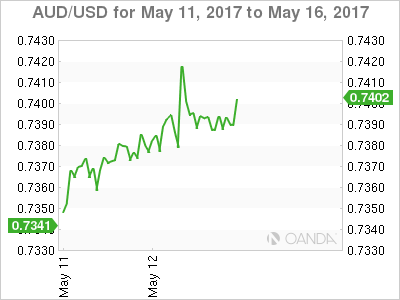
Australian Dollar
Trying to extract juice from the Aussie dollar trade has been little more than an exercise in futility of late. Thwarted on the downside by commodity price basing, and struggling to stage any meaningful topside momentum due to lingering concerns over China's 'Moneyball' reduction. Fleshing out convincing signals amongst a myriad of global and domestic narratives has traders increasingly frustrated.
Friday's jump above .7400 after Friday weak US data was faded, suggesting focus remains on the emphatically weak Australian consumption data and uncertainty over the commodity landscape.
The base metal view is mixed: copper higher, while iron ore regained a foothold above USD 60 per tonne after there was a 3% drop in China iron ore futures on Friday. But momentum remains clouded as a weaker US dollar on Friday failed to excite commodity investors, suggesting that tighter monetary conditions in China are taking a bite out of demand. Parsing President's Xi's recent comments, regulators are committed to weed out excess leverage throughout the economy and commodities could continue to struggle near term as China deleverages.
The market has opened flat to Friday's close, as dealers await a round of fresh economic data from China which could steady the Aussie dollar market. This morning's China retail sales, industrial production and fixed asset investment will garner some attention after a recent soft patch in Mainland's economic data.
In the meantime, in the absence of any spark, look for dealers to go through their daily ritual of selling rallies above .74 and buying dips too.73
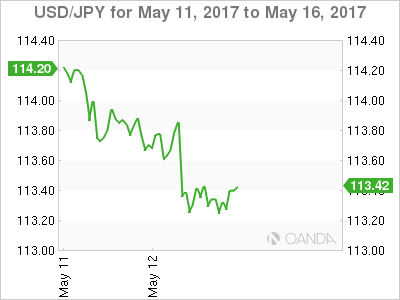
Japanese Yen
Dollar-Yen ground lower on the data, as dollar bulls were chop blocked by a slide in US Treasuries, which triggered stop loss orders at 113.50 on the way to a low of 113.20 before recovering. The bullish bond tone was then further aided by Chicago Fed Charles Evans, who said he thought 'downside risks [for inflation] still predominate.'
In a show of defiance, North Korea conducted a ballistic missile on the weekend, which has had little impact on risk so far as it was not the intercontinental variety, but there remains a very cautious mood in first markets eerily reminiscent of April trade.
We could see USDJPY struggle this week in the absence of any tier one US economic data to ignite the dollar bulls, as dealers shift their focus to Japan's preliminary GDP data to be released on Thursday, as an acceleration in economic activity would suggest a higher probability for the BOJ to consider tapering.
Euro
The EURUSD has surged on weaker US data and aided by an ECB source cited by Der Spiegel who stated that starting in July, the ECB would prepare markets for exit from ultra-loose policy; followed by starting in the fall to lay out plans for exit from QE. With political risk abating, the euro longs held steadfast above the critical support level last week, anticipating some ECB hint of policy convergence with the US.
Traders did take note of weekend elections held on Sunday in Germany's most densely populated North Rhine-Westphalia. Angela Merkel's conservative party scored a big victory, dealing a knockout blow to Martin Schulz's ambitions. With no election surprise, the EURO has held on to Friday gains.
In the meantime, I expect offers to remain substantial between a 1.0950-.75 level which was the top of the range before the French election run up.
Dollar Risks Deeper Pull Back After Data Miss, Euro to Regain Strength
There are a couple of developments to note in the forex markets last week. Firstly, Dollar ended as the strongest major currencies as markets firmed up the expectation of a June hike by Fed. However, the greenback tumbled sharply against Euro and Swiss Franc before close after weaker than expected inflation data. The dollar index was rejected from 55 day EMA and closed lower at 99.19. That was also accompanied by steep decline in 10 year yield which closed at 2.335. Overall development suggests that the greenback would turn weaker against Euro again as the post French election pull back ends.
Dollar index rejected by 55 day EMA
Dollar index's rebound was limited at 99.88 last week, below 55 day EMA (now at 99.96). Subsequent sharp fall suggests that rebound from 99.54 has completed already. More importantly, the corrective pattern from 103.82 is likely not finished and deeper fall is now in favor through 98.54 in near term. However, we'd still expect strong support from 50% retracement of 91.91 to 103.82 at 97.86 to contain downside to resume the larger up trend at a later stage.
10 year yield heading back to 2.177
10 year yield edged higher to 2.423 last week but failed to sustain above 55 day EMA. The sharp decline from there argues rebound from 2.177 is completed and the fall from 2.615 is possibly resuming. Near term outlook is now turned bearish for 38.2% retracement of 1.336 to 2.621 at 2.130. We'd still anticipate, with lower confidence now, strong support from 2.130 to contain downside. But a break there would possibly extend the pull back to 50% retracement at 1.978 before completing the correction. Both developments argues that Dollar could turn weaker against Euro and Yen ahead.
Sterling to under perform Euro and Dollar on BoE
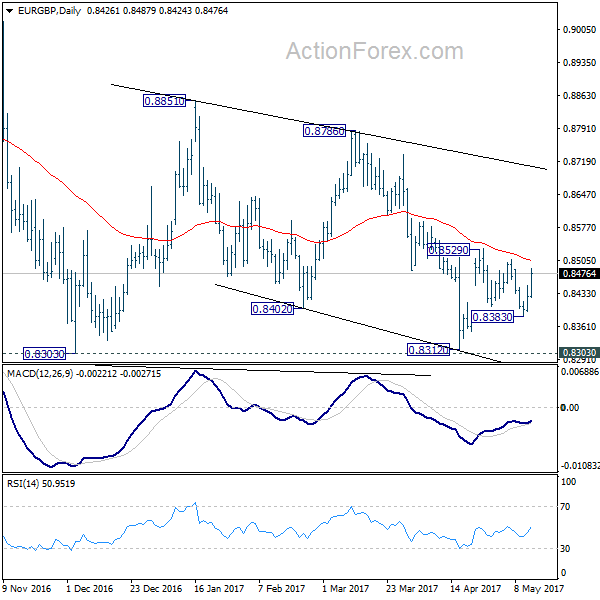
Secondly, Sterling weakened broadly, except versus Swiss Franc and New Zealand Dollar, after dovish BoE meeting. Markets should be paring bet on an early BoE rate hike. The central bank will likely hold their hands before clearing up the picture of Brexit negotiation with EU. GBP/USD will be looking at 1.2830 support this week while EUR/GBP will look at 0.8508 resistance. Break of these levels will trigger deeper selloff in the Pound and could drag down GBP/CHF and GBP/JPY too.
EUR/GBP's actions from 0.8529 to 0.8383 were clearly corrective in nature. And focus will now be back on 0.8508 resistance. Also note that the cross just defended 0.8303 support level back in April. And a break of 0.8508 will extend the rebound from 0.8312 with the prospect of at least a take on upper side of medium range at 0.8786/8851. Sterling will likely under-perform Euro in near term.
Canadian Dollar shrugged rebound in oil
Thirdly, even though Canadian Dollar and Australia Dollar didn't end the week too badly, the outlook remained bearish for both. In particular, WTI crude oil rebounded strongly last week after drawing support from 44.09 fibonacci level. However, Canadian Dollar had just little reaction to such rebound with USD/CAD staying in very tight range between 1.36/38. EUR/AUD consolidated for a while but the pull back was shallow. EUR/AUD could be set to resume recent rally through 1.49 this week.
Strong rebound in WTI crude oil indicates short term bottoming at 43.76 after breaching 38.2% retracement of 26.05 to 55.24 at 44.09. It's a bit early to determinate whether the whole corrective fall from 55.24 is completed. But there is much prospect of at least at test on 55 day EMA (now at 49.69). However, the lack of reaction in USD/CAD argues that Canadian Dollar could be heading lower first before making a bottom.
Overall, for the near term, we'll probably see Euro and Swiss performing better than Dollar, Sterling and Yen. Meanwhile, commodity currencies will likely remain the weakest group.
Regarding trading strategy...
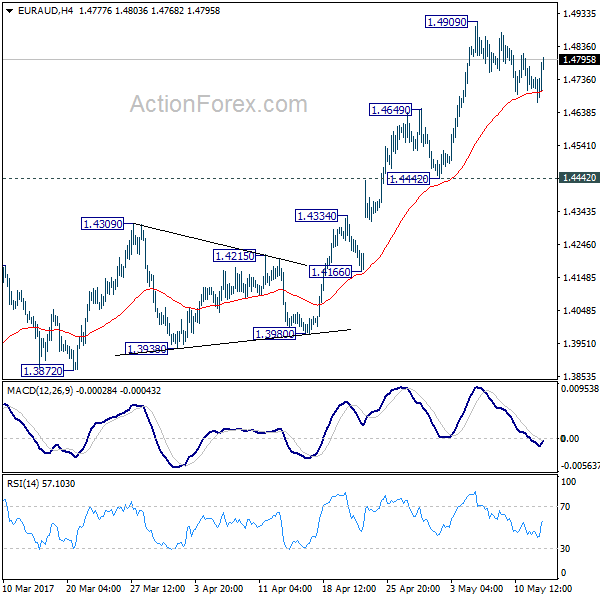
Our buy EUR/JPY at 121.60 was not filled as the cross didn't have a pull back at all last week. As it's pressing 124.08 resistance and risk topping in near term, we'll cancel the order first. The buy EUR/AUD at 1.4660 order was also not filled as the cross dipped to 1.4669, just missing our entry by 9 pips. Based on the above analysis, we'd still favoring further upside in EUR/AUD. And the pull back from 1.4909 could have completed after hitting 4 hour 55 EMA. Hence, we'll just buy EUR/AUD at market this week, with a stop at 1.4640, below 1.4649 support.
EUR/AUD Weekly Outlook
EUR/AUD stayed in consolidation below 1.4909 last week and recent rebound lost momentum. But overall outlook is unchanged. That is, whole correction from 1.6587 has completed at 1.3624 already after defending 1.3671 key support level. Further rise is expected to next fibonacci level at 1.5455 after consolidation completes.
Initial bias in EUR/AUD remains neutral this week first. Consolidation from 1.4909 could extend and deeper retreat cannot be ruled out. But downside should be contained by 1.4442/4649 support to bring rise resumption. Above 1.4909 will extend recent rally from 1.3624 to next medium term fibonacci level at 1.5455.
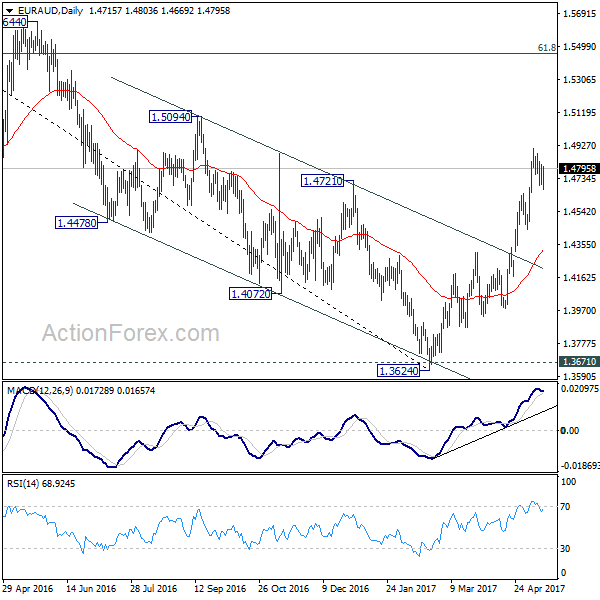
In the bigger picture, price actions from 1.6587 medium term top are viewed as a corrective pattern. Such correction should be completed after defending 1.3671 key support. Rise from 1.3642 is now expected to target 61.8% retracement of 1.6587 to 1.3624 at 1.5455 and above. In any case, outlook will now stay cautiously bullish as long as 1.4309 resistance turned support holds.
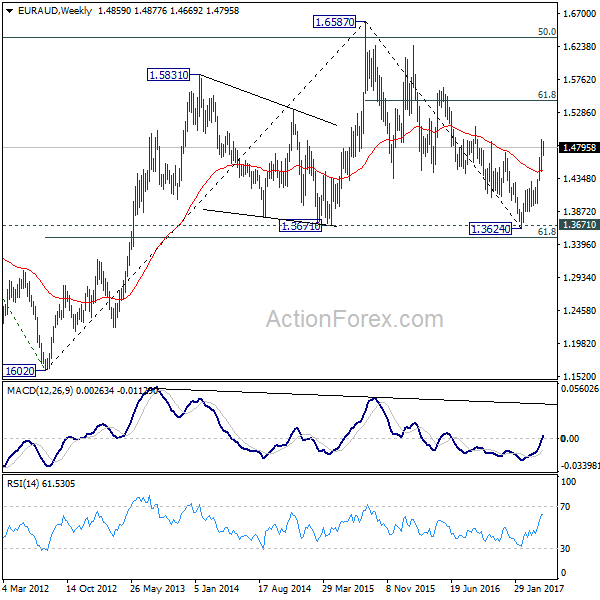
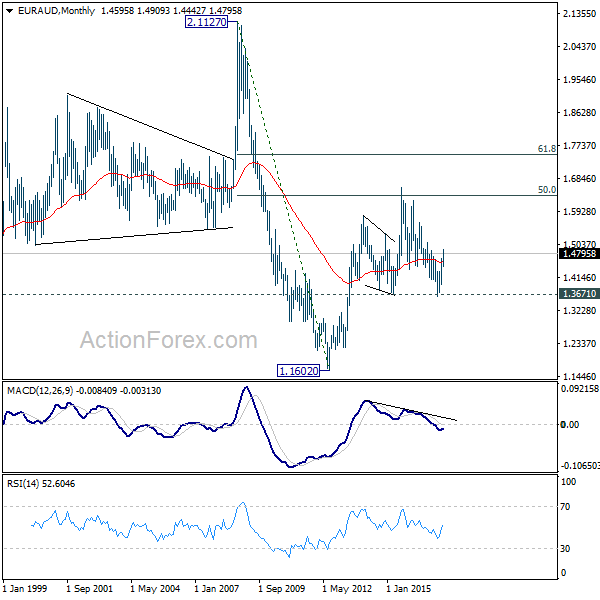
In the longer term picture, the rise from 1.1602 long term bottom isn't over yet. We'll keep monitoring the development but there is prospect of extending the rise to 61.8% retracement of 2.1127 to 1.1602 at 1.7488 and above. However, sustained trading below 1.3671 should confirm trend reversal and target 1.1602 long term bottom again.
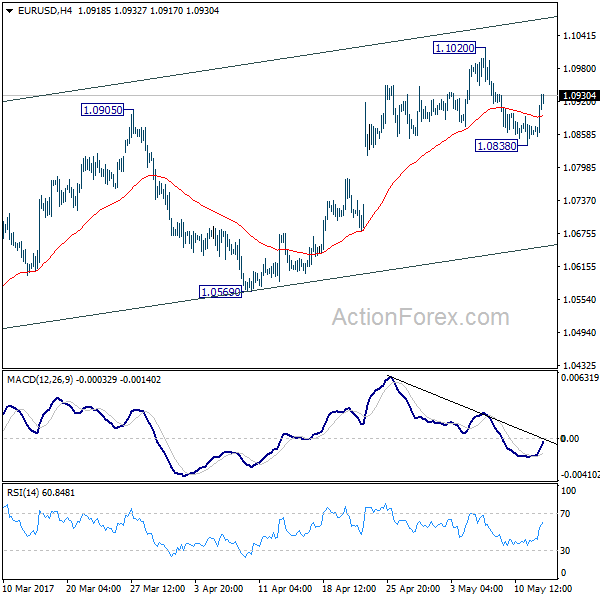
EUR/USD Weekly Outlook
EUR/USD dipped to 1.0838 last week but rebounded strongly since then. Initial bias is neutral this week first. Overall, near term outlook is unchanged. Choppy rise from 1.0339 is seen as a corrective move. Bearish divergence condition in 4 hour MACD suggests short term topping at 1.1020 already. Hence, we'd favoring another fall. Break of 1.0838 will turn bias to the downside for 55 day EMA (now at 1.0770). Break there will argue that the corrective rise from 1.0339 is completed and target 1.0569 support for confirmation. Break of 1.1020 will extend the rise but we'll look for reversal signal again.
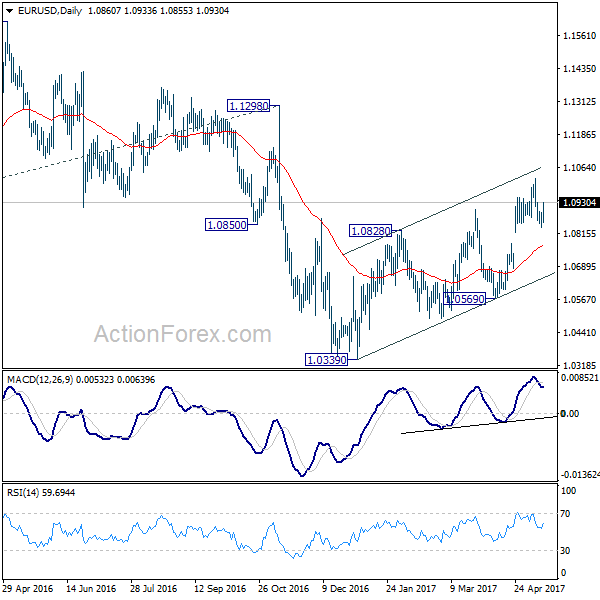
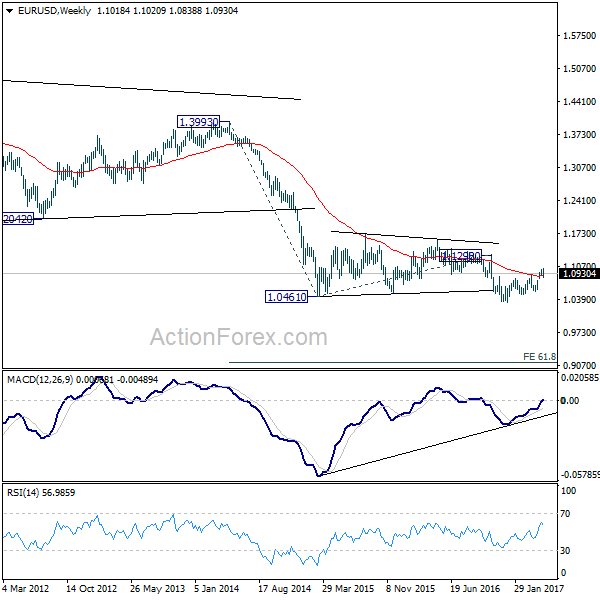
In the bigger picture, as long as 1.1298 key resistance holds, whole down trend from 1.6039 (2008 high) is still expected to continue. Break of 1.0339 low will send EUR/USD through parity to 61.8% projection of 1.3993 to 1.0461 from 1.1298 at 0.9115. However, considering bullish convergence condition in weekly MACD, break of 1.1298 will indicate long term reversal.
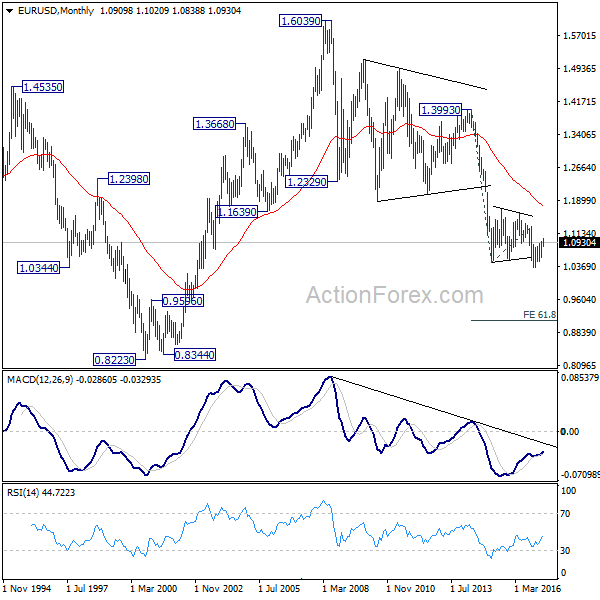
In the long term picture, the down trend from 1.6039 (2008 high) is still in progress and there is no clear sign of completion. We'd expect more downside towards 0.8223 (2000 low) as long as 1.1298 resistance holds. However, firm break of 1.1298 should now confirm long term reversal.
USD/JPY Weekly Outlook
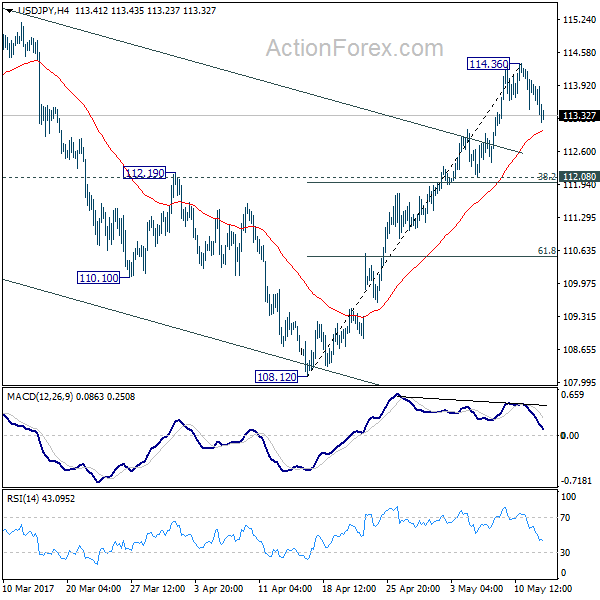
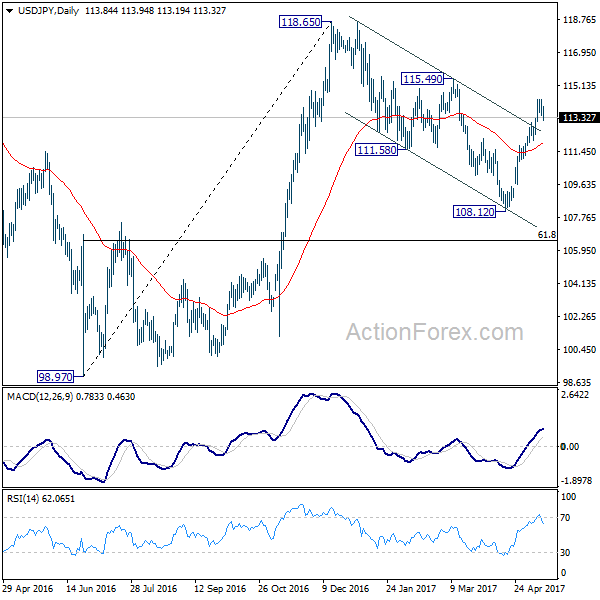
USD/JPY's rally extended to 114.36 last week bur retreated since then. Initial bias stays neutral this week for consolidation first. In case of deeper decline, downside should be contained by 112.08 cluster support (38.2% retracement of 108.12 to 114.36 at 111.97) and bring rally resumption. We're holding on to the view that corrective fall from 118.65 is completed with three wave down to 108.12. Above 114.36 will target 115.49 resistance first. Break there should resume whole rise from 98.97 to 125.85 high.
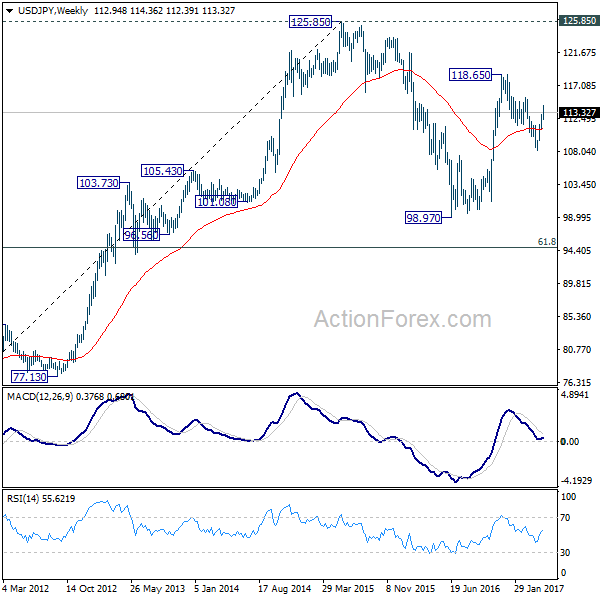
In the bigger picture, price actions from 125.85 high are seen as a corrective pattern. It's uncertain whether it's completed yet. But in case of another fall, downside should be contained by 61.8% retracement of 75.56 to 125.85 at 94.77 to bring rebound. Meanwhile, break of 115.49 resistance will extend the rise from 98.97 to retest 125.85. Overall, rise from 75.56 is still expected to resume later after the correction from 125.85 completes.
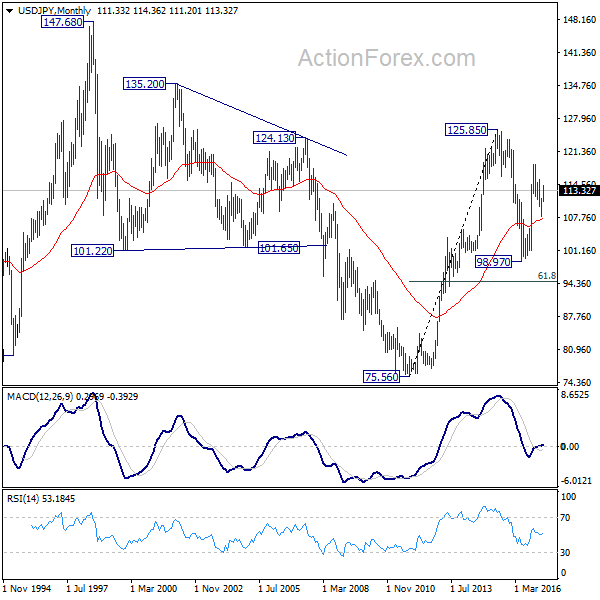
In the long term picture, the rise from 75.56 long term bottom to 125.85 medium term top is viewed as an impulsive move. Price actions from 125.85 are seen as a corrective move which could still extend. But, up trend from 75.56 is expected to resume at a later stage for above 135.20/147.68 resistance zone.
GBP/USD Weekly Outlook
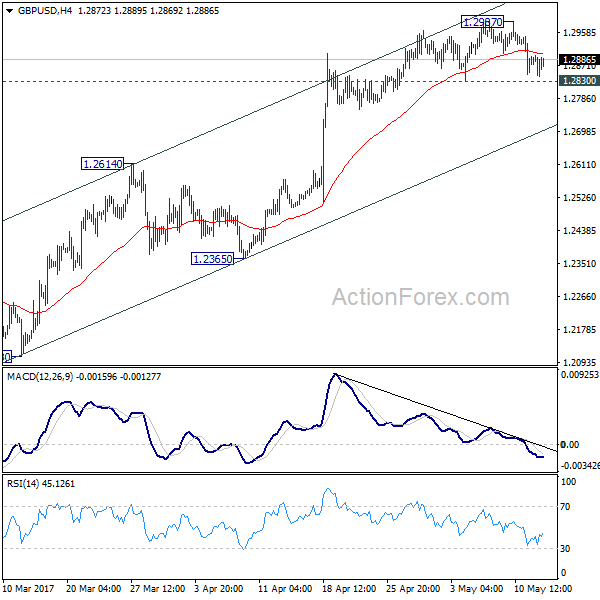
GBP/USD edged higher to 1.2987 last week but dipped sharply since then. Nonetheless, it's staying above 1.2830 minor support. Hence, initial bias is neutral this week first. Considering bearish divergence condition in 4 hour MACD, break of 1.2830 will indicate short term topping. In such case, intraday bias is turned back to the downside for 1.2614 resistance turned support first. Overall, price actions from 1.1946 are viewed as a corrective pattern. There, in case of another rise, we'd start to look for reversal signal again above 1.2987.
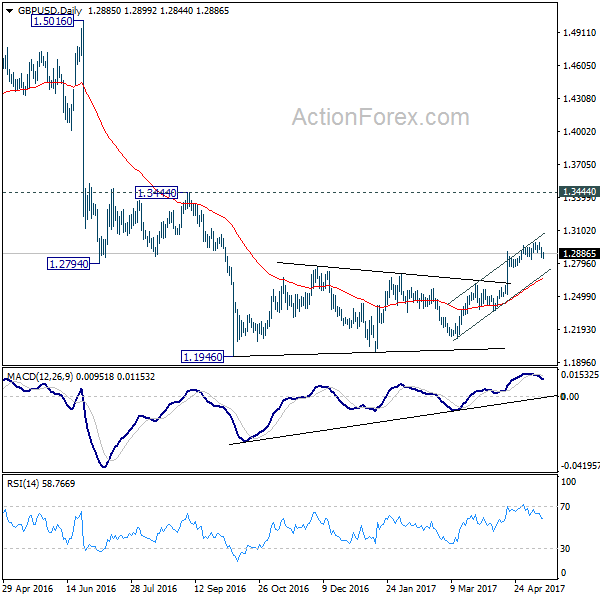
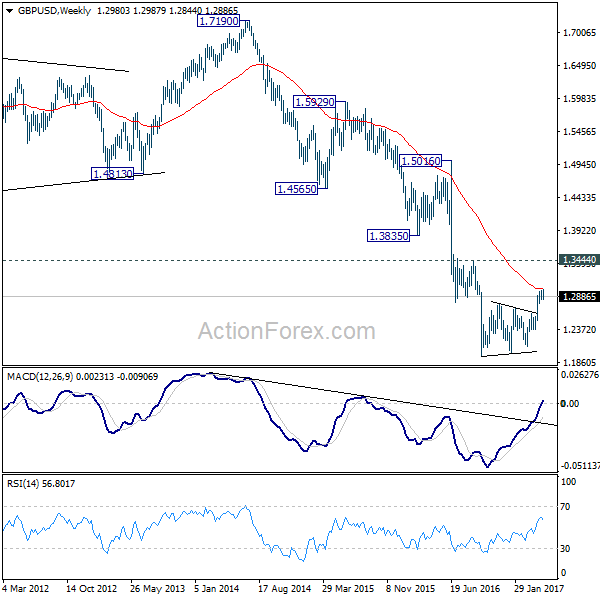
In the bigger picture, fall from 1.7190 is seen as part of the down trend from 2.1161. There is no sign of medium term reversal yet. Sustained trading below 61.8% projection of 2.1161 to 1.3503 from 1.7190 at 1.2457 will target 100% projection at 0.9532. Overall, break of 1.3444 resistance is needed to confirm medium term bottoming. Otherwise, outlook will remain bearish.
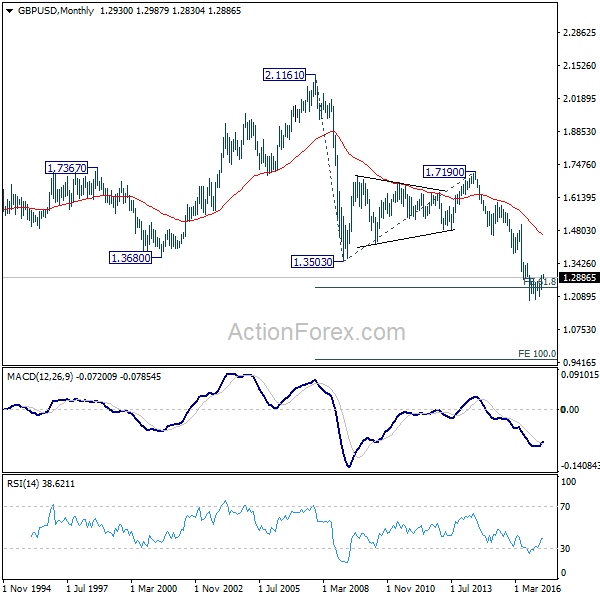
In the longer term picture, no change in the view that down trend from 2.1161 is still in progress. Current momentum suggests that the down trend will go deeper than originally expected to 100% projection of 2.1161 to 1.3503 from 1.7190 at 0.9532.
USD/CHF Weekly Outlook
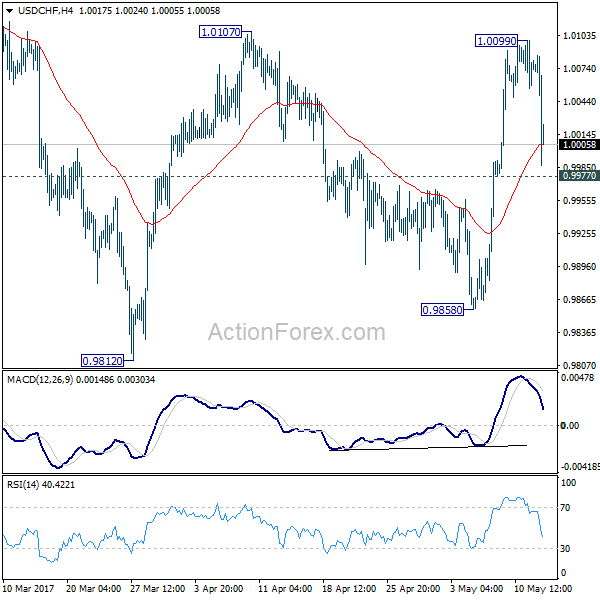
USD/CHF rose to 1.0099 last week but failed to break through 1.0107 resistance. The sharp fall on Friday raised some question on the bullish outlook but it's staying above 0.9977 minor support so far. Hence initial bias remains neutral this week first. On the upside, break of 1.0107 resistance will be in line with the view that correction from 1.0342 has completed at 0.9812. In such case, further rally would be seen to retest 1.0342 high. However, break of 0.9977 will dampen this view and turn bias back to the downside for 0.9858 first.
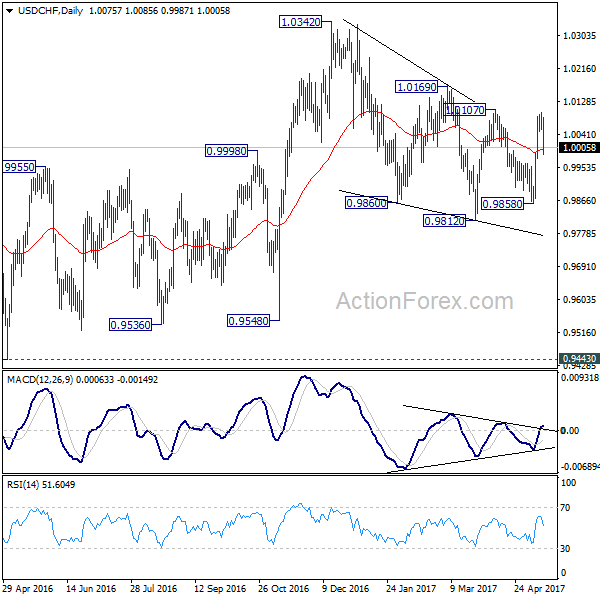
In the bigger picture, we're still maintaining that firm break of 1.0342 key resistance is needed to confirm underlying bullish momentum in the pair. However, the corrective nature of the fall from 1.0342 is starting to give the medium term outlook a bullish favor. Hence, in stead of looking for topping signal around 1.0342, we'd now pay closer attention to upside acceleration as USD/CHF approaches this level again.
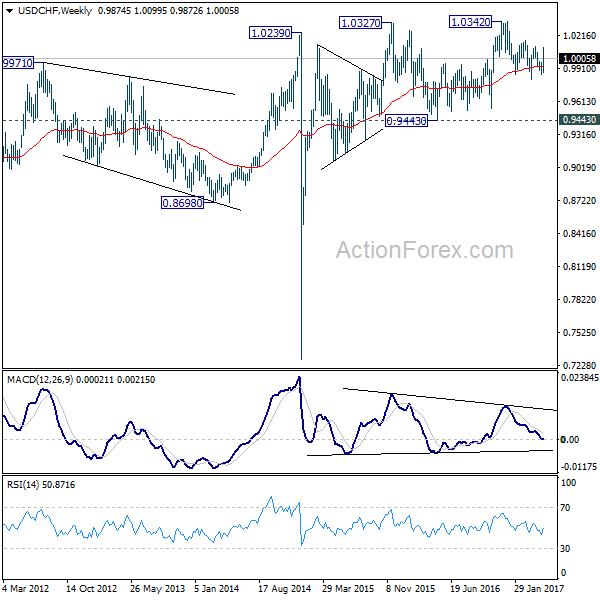
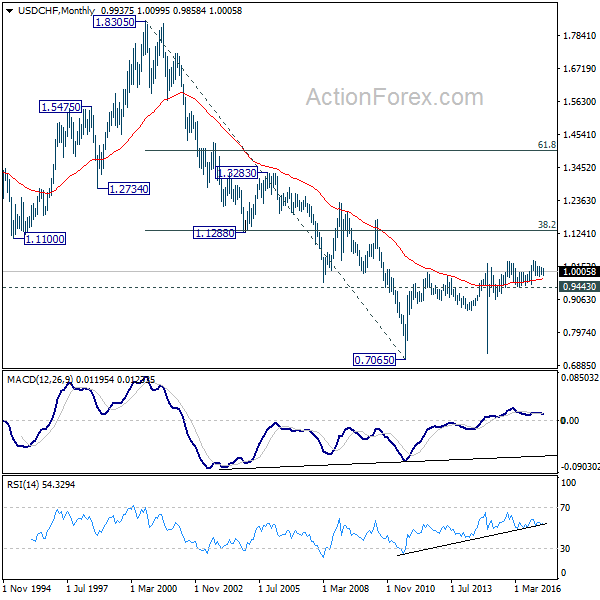
The long term outlook in USD/CHF stays a bit mixed for the moment. But in case of another medium term fall, we'd expect strong support from 0.9443/9548 support zone. Meanwhile, firm break of 1.0342 will target 38.2% retracement of 1.8305 to 0.7065 at 1.1359.
AUD/USD Weekly Outlook
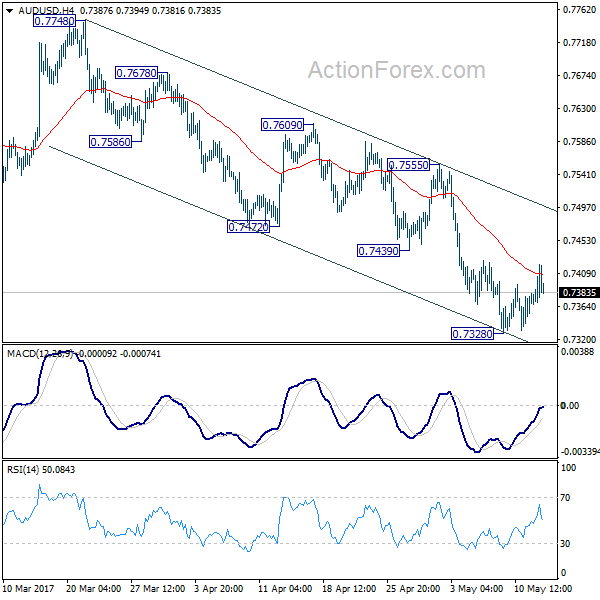
AUD/USD dropped further to 0.7328 last week but formed a temporary low there and recovered. Initial bias is neutral this week for consolidation above 0.7328 first. Upside of recovery should be limited below 0.7555 resistance to bring another fall. Below 0.7382 will target 0.7144/7158 support zone. However, there is no clear sign of larger down trend resumption yet. Hence we'll be cautious on strong support from0.7144/58 to contain downside and bring rebound. On the upside, firm break of 0.7555 will argue that fall from 0.7748 is completed and turn bias back to the upside.
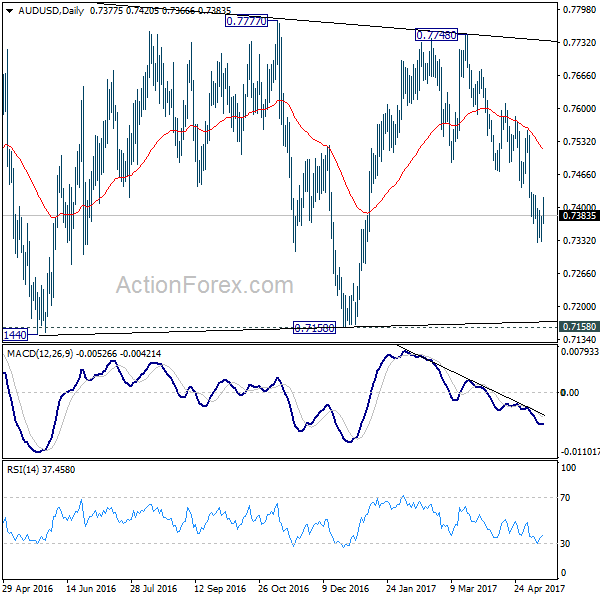
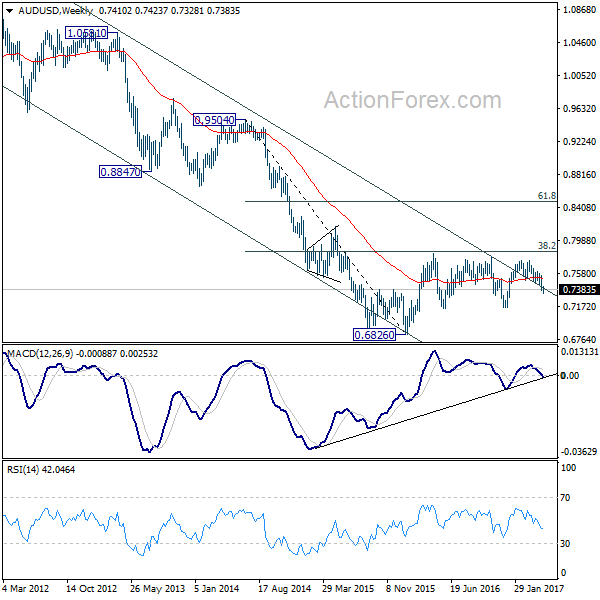
In the bigger picture, we're still treating price actions from 0.6826 low as a correction pattern. And, as long as 38.2% retracement of 0.9504 to 0.6826 at 0.7849 holds, long term down trend from 1.1079 is expected to resume sooner or later. Break of 0.6826 low will target 0.6008 key support level. However, firm break of 0.7849 will indicate that rise from 0.6826 is developing into a medium term rebound, rather than a sideway pattern. In such case, stronger rise should be seen to 55 month EMA (now at 0.8115) and above.
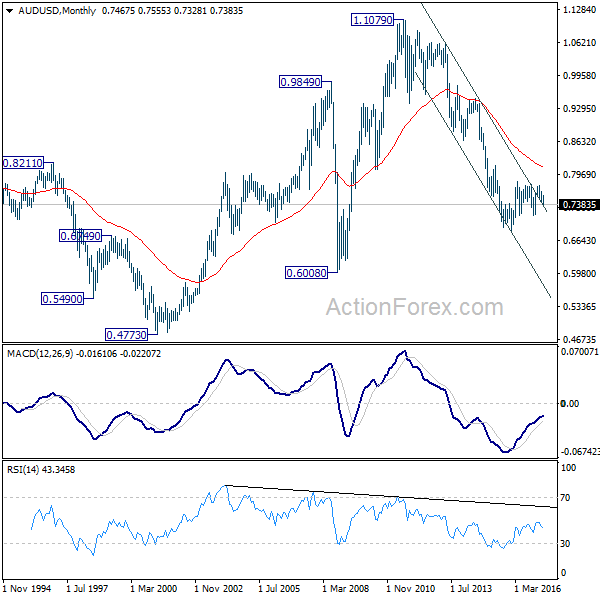
In the longer term picture, while the down trend from 1.1079 might extend lower, we're not anticipating a break of 0.6008 (2008 low) yet. We'll look for bottoming above there to reverse the medium term trend.