
Sample Category Title
Trade Idea Wrap-up: GBP/USD – Hold short entered at 1.2900
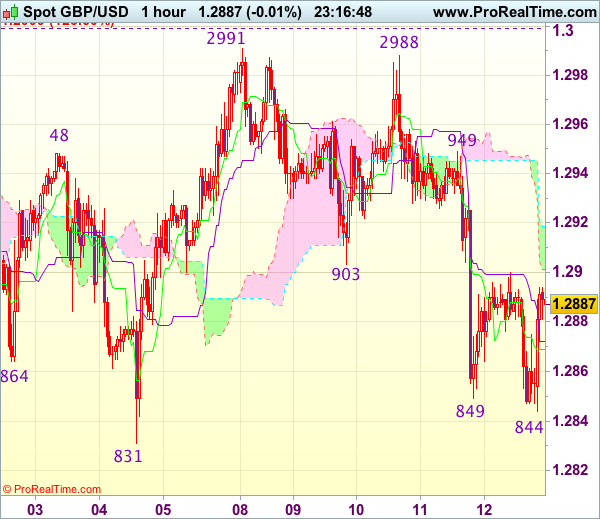
GBP/USD - 1.2874
Most recent candlesticks pattern : N/A
Trend : Near term up
Tenkan-Sen level : 1.2869
Kijun-Sen level : 1.2872
Ichimoku cloud top : 1.2919
Ichimoku cloud bottom : 1.2901
Original strategy :
Sold at 1.2900, Target: 1.2800, Stop: 1.2935
Position : - Short at 1.2900
Target : - 1.2800
Stop : - 1.2935
New strategy :
Hold short entered at 1.2900, Target: 1.2800, Stop: 1.2935
Position : - Short at 1.2900
Target : - 1.2800
Stop : - 1.2935
Although cable has rebounded after marginal fall to 1.2844 and consolidation above this level would be seen, still reckon upside would be limited to resistance at 1.2903 (previous support) and bring another decline, below said support would add credence to our bearish view that top is formed at 1.2991 earlier and bring test of 1.2831 support, break there would provide confirmation and extend the fall from 1.2991 top to 1.2805 and later towards 1.2770 but reckon previous support at 1.2757 would hold from here.
In view of this, we are holding on to our short position entered at 1.2900. Above 1.2925-30 would risk test of 1.2950-60 but break there is needed to signal low is formed, bring another bounce towards 1.2988-91 resistance but break of 1.2999-00 (1.236 times projection of 1.2109-1.2616 measuring from 1.2365 and psychological resistance) is needed to revive bullishness.
Trade Idea Wrap-up: EUR/USD – Sell at 1.0980
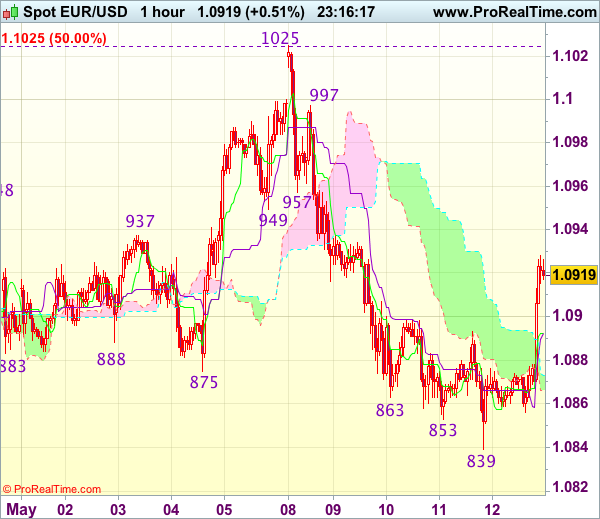
EUR/USD - 1.0921
Most recent candlesticks pattern : N/A
Trend : Near term down
Tenkan-Sen level : 1.0892
Kijun-Sen level : 1.0892
Ichimoku cloud top : 1.0873
Ichimoku cloud bottom : 1.0866
Original strategy :
Sell at 1.0955, Target: 1.0840, Stop: 1.0990
Position : -
Target : -
Stop : -
New strategy :
Sell at 1.0980, Target: 1.0860, Stop: 1.1015
Position : -
Target : -
Stop : -
Current rebound in US morning suggests first leg of decline from 1.1025 top has ended at 1.0839 and near term upside risk is seen for this rebound to extend gain to 1.0950-55, however, if our view that top has been formed at 1.1025 is correct, upside would be limited to 1.0980 and resistance at 1.0997 should hold, bring another decline later. Below 1.0880 would bring weakness to 1.0855-60 but break of support at 1.0839 is needed to confirm and extend fall to 1.0821, then 1.0795-00 later.
In view of this, we are still looking to sell euro but at a higher level as 1.0997 resistance should limit upside. Only break of said resistance at 1.1025 would abort and signal early upmove has resumed instead, bring further gain to 1.1050-55 and later 1.1075-80 before prospect of another retreat.
Trade Idea Wrap-up: USD/JPY – Stand aside
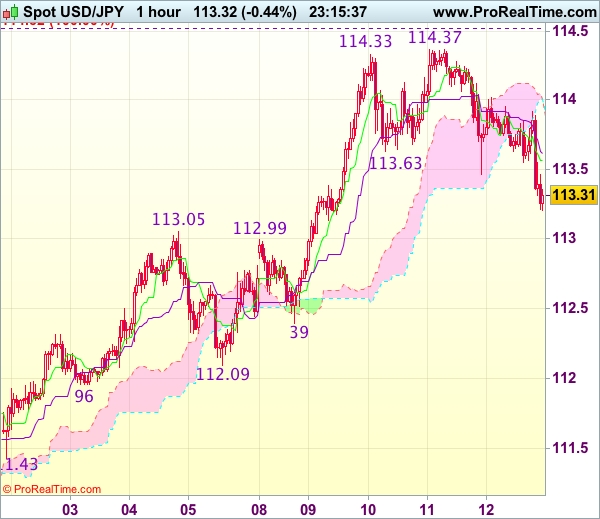
USD/JPY - 113.31
Most recent candlesticks pattern : N/A
Trend : Near term up
Tenkan-Sen level : 113.56
Kijun-Sen level : 113.61
Ichimoku cloud top : 114.01
Ichimoku cloud bottom : 114.00
Original strategy :
Buy at 113.15, Target: 114.25, Stop: 112.80
Position : -
Target : -
Stop : -
New strategy :
Stand aside
Position : -
Target : -
Stop : -
Current selloff in NY morning on dollar’s broad-based weakness suggests a temporary top has been formed at 114.37 yesterday and consolidation below this level is seen with mild downside bias for test of previous resistance at 112.99-05 (now support), break there would add credence to this view, bring retracement of recent upmove to 112.70-75, however, reckon support at 112.39 would limit downside and price should stay above support at 112.09, bring rebound next week.
In view of this, would be prudent to stand aside in the meantime. Above the Kijun-Sen (now at 113.61) would bring recovery to 114.00, however, price should falter below said resistance at 114.37, bring another retreat later. Only break of 114.37 would revive bullishness and extend recent upmove to 114.50-55 (100% projection of 108.13-111.78 measuring from 110.87) and possibly 114.75-80 but price should falter below 115.00.
Trade Idea: EUR/GBP – Stand aside
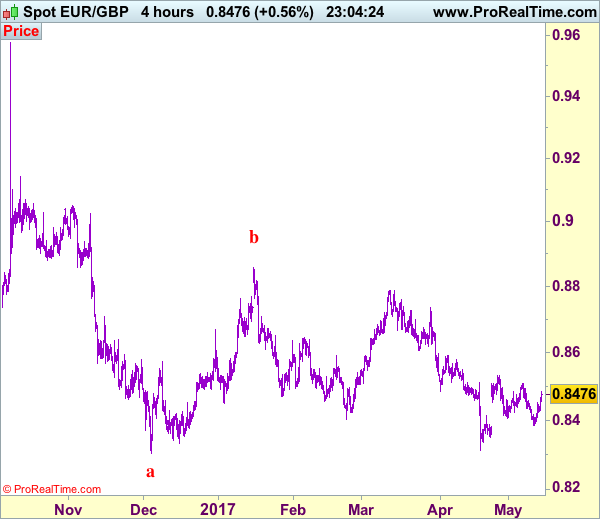
EUR/GBP - 0.8473
Recent wave: Major double three (A)-(B)-(C)-(X)-(A)-(B)-(C) is unfolding and 2nd (A) has possibly ended at 0.6936.
Trend: Near term down
New strategy :
Stand aside
Position : -
Target : -
Stop : -
As the single currency has rebounded again today, suggesting further consolidation above this week’s low at 0.8384 would take place and gain to 0.8509 resistance cannot be ruled out, however, as outlook remains consolidative, reckon upside would be limited to resistance at 0.8531 and bring further choppy trading. Only a break of said resistance at 0.8531 would add credence to our view that a temporary low has been formed at 0.8312 last month and extend the rebound from there for retracement of recent decline to 0.8550
On the downside, expect pullback to be limited to 0.8425-30 and 0.8400 should hold, bring another rebound later. Below said support at 0.8384 would extend weakness to support at 0.8351 but break there is needed to signal the rebound from 0.8312 low has ended at 0.8531 and bring further fall towards this support at 0.8312 which is likely to hold from here. As near term outlook is still mixed, would be prudent to stand aside for now.
Our preferred count is that, after forming a major top at 0.9805 (wave V), (A)-(B)-(C) correction is unfolding with (A) leg ended at 0.8400 (A: 0.8637, B: 0.9491 and 5-waver C ended at 0.8400. Wave (B) has ended at 0.9413 and impulsive wave (C) has either ended at 0.8067 or may extend one more fall to 0.8000 before prospect of another rally. Current breach of indicated resistance at 0.9043 confirms our view that the (C) leg has ended and bring stronger rebound towards 0.9150/54, then towards 0.9240/50.
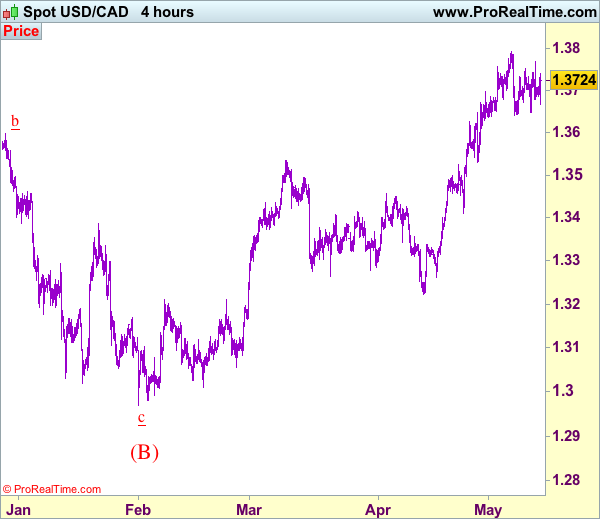
Trade Idea: USD/CAD – Buy at 1.3570
USD/CAD - 1.3725
Recent wave: Only wave v of c has ended at 0.9407 and wave C of major A-B-C correction is underway for headway to 1.4700
Trend: Near term up
Original strategy :
Buy at 1.3570, Target: 1.3770, Stop: 1.3510
Position: -
Target: -
Stop: -
New strategy :
Buy at 1.3570, Target: 1.3770, Stop: 1.3510
Position: -
Target: -
Stop:-
The greenback has remained confined within near term established range and further sideways trading below last week’s high at 1.3794 would take place, below 1.3640-45 would bring correction to 1.3600, however, reckon downside would be limited to 1.3570 and bring another rise later, only break of said resistance at 1.3794 would confirm recent upmove has resumed and extend further gain to 1.3840-50 but overbought condition should prevent sharp move beyond 1.3890-00 and price should falter below 1.3950.
In view of this, would not chase this rise here and would be prudent to buy again on pullback as 1.3570 should limit downside and bring another rise later. Below 1.3530 would abort and suggest a temporary top is formed, bring retracement of recent upmove to 1.3500 and later towards 1.3450-60 but support at 1.3411 should remain intact, bring another upmove later.
To recap, wave B from 1.3066 is unfolding as an a-b-c and is sub-divided as a: 1.2192, b: 1.2716 and wave c is a 5-waver with i: 1.1983, ii: 1.2506, extended wave iii with minor iii at 1.0206, wave iv ended at 1.0781 and wave v as well as wave iii has ended at 0.9931, hence the subsequent choppy trading is the wave iv which is unfolding as (a)-(b)-(c) with (a) leg of iv ended at 1.0854, followed by (b) leg at 1.0108 and (c) leg as well as the wave iv ended at 1.0674. The wave v is sub-divided by minor wave (i): 0.9980, (ii): 1.0374, (iii): 0.9446, (iv): 0.9913 and (v) as well as v has possibly ended at 0.9407, therefore, consolidation with upside bias is seen for major correction, indicated target at 1.3700 and 1.4000 had been met and further gain to 1.4700 would be seen later.
Currencies: Dollar Maintains Most of Recent Gains Ahead of Key data
Headlines
European equity markets corrected lower today with the telecom sector underperforming. US stock markets opened around 0.25% in the red.
NY Fed Dudley said that the Fed will probably begin shrinking its balance sheet sometime later this year or in 2018 if economy stays on track. They will allow both MBS and Treasuries to run off. He added that there's no great urgency for the Fed to tighten aggressively though.
The BoE kept its policy unchanged with one member again voting in favour of an immediate rate hike. The BoE suggested interest rates could rise towards more normal levels over the next three years if Brexit negotiations go smoothly, but said it had been overoptimistic about economic performance for the first half of this year.
US shale oil output is growing at a faster than expected rate, keeping pressure on prices despite steep supply curbs from some of the world's biggest producers, Opec said in its monthly market report.
The European Commission revised upward its forecasts of euro zone economic growth this year and projected a lower unemployment rate, in new signs that the bloc's recovery is gathering pace. The 19-country currency bloc is expected to expand by 1.7% this year and 1.8% in 2018.
Banks' "unconstrained" ability to generate credit by pledging the same assets as collateral multiple times needs to be curbed or risks creating a new financial bubble, ECB vice president Constancio said. His remarks underscored the ECB's concerns about the prospect of a new boom in lending between financial firms
British industrial output shrank for a third month in a row in March (-0.5% M/M) underscoring how the impact of last year's Brexit vote has begun to weigh on the economy. The ONS also said Britain's trade deficit widened by more than expected, a further setback for hopes that sterling's fall would help rebalance the economy.
US weekly jobless claims stabilized around historical lows (236k) while markets expected a small setback to 245k. Continuing claims declined to a 28-yr low at 1918k. The bigger-than-forecast rebound in April producer prices indicates inflation pressures continue to build in the US economy and that March's decline was short-lived.
Rates
US Note future tests this week's low after strong data
Global core bonds continued to trade choppy. The Bund faced immediate selling pressure, but equity weakness came to the rescue and prevented losses. The EC only marginally upgraded its 2017 growth forecast, while keeping it unchanged in 2018 which avoid more ECB exit speculation. Heavyweight NY Fed governor Dudley suggested that the Fed will allow both MBS and US Treasuries to run-off, starting at the end of this year or the beginning of next. He added that there's no hurry to tighten policy though. His comments fell on deaf ears. US eco data, even if they were second-tier, managed to change the intraday tide. Weekly jobless claims remained near historically low levels while producer prices rose faster than forecast. US Treasuries recorded new intraday lows while German Bunds lost ground as well. Brent crude managed to hold above the key $50/barrel mark.
At the time of writing, the German yield curve bear steepens with yield 1 bp (2- yr) to 3.1 bps (30-yr) higher. Changes on the US yield curve range between +0.3 bps (10-yr) and +1.3 bps (30-yr). On intra-EMU bond markets, 10-yr yield spreads changes versus Germany range between -1 bps and +2 bps with Portugal (-3 bps) and Greece (-5 bps) outperforming.
The Italian debt agency tapped the on the run 3-yr BTP (€2.44B 0.35% Jun2020), 7-yr BTP (€2.25B 1.85% May2024), 30-yr BTP (€1.25B 2.7% Mar2047) and the off the run BTP (€1.25B 4.75% Sep2044). The combined amount sold (€7.19B) was near the upper end of the €5.5-7.25B target range. The auction bid cover was 1.51 which is rather strong for Italian standards. Tonight, the Treasury ends its refinancing operation with a $15B 30-yr Bond auction. Currently, the WI trades around 3.05%.
Currencies
Dollar maintains most of recent gains ahead of key data
Today, EUR/USD and USD/JPY initially drifted sideways. Both cross rates lost ground as equities finally fell prey to modest profit taking. The US eco data (PPI and claims) were better than expected. Core yields rose slightly, but were not able to trigger more USD gains. The focus for USD trading is on tomorrow's US CPI and retail sales. EUR/USD trades in the 1.0855/60 area. USD/JPY struggles not to fall below 114.
Overnight, most Asian equity indices gained ground with the Nikkei and the Korean indices at multi-month highs. Mainland China equities initially underperformed but staged a remarkable rebound towards the close. Until now the Chinese underperformance had little impact on other markets, but the issue deserves close monitory. USD/JPY (114.20) remained in risk-on modus, holding within reach of the recent highs. EUR/USD stabilized the 1.0865 area.
Early in Europe, there was again no clear directional momentum in European equities nor in EUR/USD and USD/JPY. The EU commission forecasts were revised only marginally higher and no market mover. At the onset of the US trading session, sentiment on risk gradually faltered. The correction weighed on EUR/JPY, EUR/USD and, to a lesser extent USD/JPY. The US PPI and jobless claims were stronger than expected and triggered some modest gains of the dollar against the euro. EUR/USD trades currently in the 1.0850/60 area. So, the price action in the cross rate was both due a pinch of risk-off and a small piece of USD strength. The US eco data also help to prevent a further USD/JPY decline. The pair stabilizes near 114. However, some further topping out might be on the cards if sentiment on risk would worsen more on China or for whatever other reason including simple profit taking.
Sterling ceding ground post-BoE decision.
Today, UK March production data and the trade balance were substantially weaker than expected. Sterling lost temporary ground upon their publication, but EUR/GBP drifted back to the low 0.84 area going into the BoE policy decision and inflation report. The Bank of England kept a balanced approach as it said that 'Monetary policy cannot prevent either the necessary real adjustment as the United Kingdom moves towards its new international trading arrangements or the weaker real income growth that is likely to accompany that adjustment over the next few years'. The Bank indicated that an earlier rate hike might be needed in case of a smooth Brexit,. However, what are the chances for this scenario? The moves in sterling remained modest, but the market apparently concluded that the BoE will give slightly more weight to supporting growth rather than fighting inflation. The vote was again 7-1 for an unchanged decision. There was no additional support for a rate hike, what some apparently expected. EUR/GBP trades currently in the 0.8445/50 area. Cable is drifting further away from the 1.30 resistance and trades currently in the 1.2860 area.
Inflation Pressures Remain Modest
The consumer price index (CPI) rose 0.2%m/m in April, as expected by markets. On a year-on-year basis inflation was 2.2%, a continued deceleration from its 2.8% peak in February.
It was necessities that took prices higher in April. Indices for shelter (+0.3%), energy (+1.1%), tobacco (+4.2%) and food (+0.2%) all rose on a monthly basis.
Leaning against these price increases, many categories saw falling prices, including apparel (-0.3%), education/communication (-0.3%), medical care (-0.2%), and new and used vehicles.
This tug of war between various categories left core inflation up a modest 0.1% (m/m) in April, after a surprising 0.1% drop in core prices in March. That leaves core inflation at 1.9% on a year-on-year basis, its slowest pace since October 2015.
The recent softening in core inflation is a result of continued deflation in core goods prices, down 0.6% year-on-year, and now a slowing in core services prices. Core services inflation had run as strong as 3.2% last fall, but has now decelerated to 2.7%.
Key Implications
April's CPI data provided some reassurance that there are still inflationary forces in the economy. However, the softening in recent months in core inflation may cause some concern for the Fed as it considers its next rate move. The Fed is very much in data dependent mode, and it will need to balance a red hot job market with an inflation picture that has a bit less oomph than it would like.
Overall, we expect the Fed to keep the faith on price pressures building down the line reflecting a strengthening economy. Price pressures in other measures, like the producer price index, showed heartier gains in April, and suggest higher inflation is on its way. So long as the economic data continues to cooperate over the next month, the Fed looks set to raise rates another quarter point in June.
Retail Sales Rebound in April, Strengthening Case for June Hike
Retail sales increased 0.4% in April according to the advance Census Bureau report. While this was slightly shy of expectations for a 0.6% rise, upward revisions to March sales - which are now reported to have grown by 0.1% instead of a 0.2% decline - more than made up for the miss.
Sales at motor vehicle & parts dealers (+0.7%) helped the headline, while gasoline station sales rose by a more muted 0.2%. Excluding autos and gas, retail sales were up 0.3% on the month, or slightly slower than the previous months' upwardly revised gain of 0.4% (previously reported as 0.1%).
Excluding gas, autos, building materials (+1.2%), and food services (+0.4%), the so-called 'control group' used in calculating GDP was up just 0.2% on the month. This was half the expected pace but comes atop of upward revision to 0.7% gain in the previous month. Gains in the control group were broad, with electronics (+1.3%), health and personal care (+0.8%) and sporting goods (+0.6%) showing strong gains together with the persistently outperforming e-commerce (+1.4%) . These were somewhat offset by 0.5% declines in the furniture, clothing, and general merchandise stores.
Key Implications
This was a healthy report all things considered. Despite the headline print falling shy of expectations, revisions to previous month's sales more than made up for miss. Together with the relatively muted price changes, the number suggests a fairly strong consumption profile at the start of the second quarter, with PCE likely to advance by nearly 3.5% during Q2.
Another encouraging element was the breadth of the gains themselves, with particular strength in building materials and discretionary spending categories. The former suggests that the healing housing market is spurring increasing renovation activity, which is a positive for residential investment. The latter indicates that consumers are spending on wants in addition to needs, and hints at the notion that strong job growth and rising wages are boosting confidence - something that we expect will continue supporting consumption.
The report is likely to further assuage fears that the weakness in the first quarter will spill over into the rest of the year. As such, it will likely strengthen the case for the Fed to raise rates next month despite the weaker-than-expected April CPI print released this morning. All in all, we expect the Fed will move in June, with another hike still likely during the second half of the year.
U.S. April Retail Sales Point to Stronger Q2 Consumer Spending
Highlights:
- April retail sales rose 0.4% to build on a 0.1% increase (previously reported as -0.2%) in March.
- Motor vehicle sales rose 0.8%, gasoline station sales inched up 0.2%, and building material store sales rose 1.2% after falling 1.7% in March.
- 'Control' (excluding motor vehicles, building materials and gasoline stations) sales rose 0.2% following a 0.7% jump in March.
Our Take:
The 0.4% gain in April retail sales was only slightly below expectations for a 0.6% increase and followed an upwardly revised March gain (now reported as up 0.1% versus the previous -0.2%). On balance, spending over the last two months is in line with the view that the slowing in Q1 real consumer spending growth, to just a 0.3% annualized pace, was more the result of 'normal' volatility in the data and a weather-related pull-back in utilities consumption than the beginning of a new weaker trend. Strong employment growth, rising wages and consumer confidence, and the still stimulative stance of monetary policy are all pointing to a solid household spending backdrop and the recent data remains in line with our forecast for a 2.8% increase in consumer expenditures in Q2 that we expect will support a 2.9% increase in GDP (following the surprisingly modest 0.7% Q1 gain.) Along with continued improvement in labour markets — the unemployment rate fell to a new cycle low of 4.4% in April — the data will provide reassurance to the Fed that the fundamental economic backdrop remains strong and, if anything, further increases the odds of another hike to the fed funds target range when monetary policymakers next meet in June.
US Inflation Rates Edged Down in April But Remained Near 2%
Highlights:
- The all items index rebounded by 0.2% in April but the year-over-year rate slipped to 2.2% from 2.4% in March.
- Higher energy prices (+9.3% from last year) continued to boost headline inflation.
- Consumer prices excluding food and energy rose by less than expected (+0.1%) following a 0.1% dip in March that was just the second monthly decline in decades.
- Rising shelter costs offset declines in a number of other core components in April.
- Year-over-year core inflation slipped to a 1½-year low of 1.9%.
- Prices for wireless telephone services declined again in April; a more substantial 7% drop in March shaved about 0.1 percentage point off of headline inflation.
Our Take:
Inflation has come off the boil in the last two months, though we don't see the latest data standing in the way of a June rate hike. Following last week's labour market report that showed a rebound in job growth and 4.4% unemployment rate, there seems to be a bit more urgency from Fed officials to continue removing accommodation. Whereas, a year ago, a slow start to the year led to a more cautious approach from the Fed, policymakers now seem more than willing to look through soft Q1 GDP. Inflation and wage data isn't yet signaling a sharp tightening in monetary policy is required, but with unemployment at a 16 -year low and inflation hovering around 2%, we expect the Fed will proceed with gradual rate hikes rather than risk falling behind the curve. We think a June rate hike is order, as well as further tightening over the second half of the year.