Sample Category Title
EUR/USD Short-Term Weakness, GBP/USD Weakening, USD/JPY Ready To Bounce Back Higher.
EUR/USD Short-term weakness.
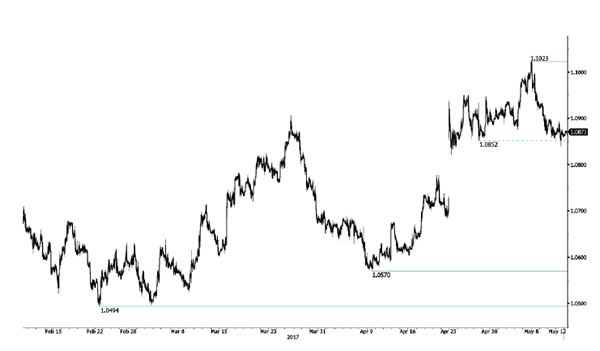
EUR/USD is trading lower. Hourly support given at 1.0852 (27/04/2017 low) has been broken. Stronger support is now given at 1.0682 (21/04/2017 base) and key support can be found at 1.0494 (22/02/2017 low). The road is wideopen for further decline.
In the longer term, the death cross late October indicated a further bearish bias. The pair has broken key support given at 1.0458 (16/03/2015 low). Key resistance holds at 1.1714 (24/08/2015 high). Expected to head towards parity.
GBP/USD Weakening.
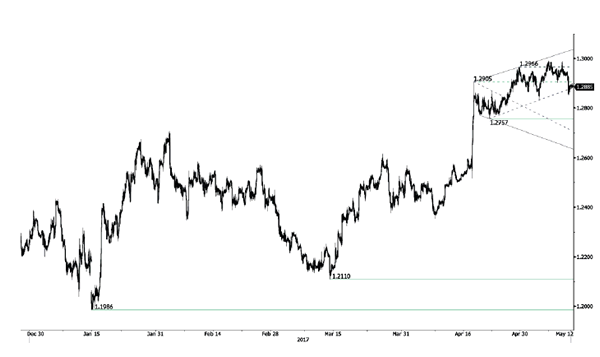
GBP/USD is trading lower. Hourly resistance is given at 1.2989 (07/05/2017 high). Hourly support can be found at 1.2757 (21/04/2017 low). An unlikely break of this support would indicate further weakness. Expected to push higher.
The long-term technical pattern is even more negative since the Brexit vote has paved the way for further decline. Long-term support given at 1.0520 (01/03/85) represents a decent target. Long-term resistance is given at 1.5018 (24/06/2015) and would indicate a long-term reversal in the negative trend. Yet, it is very unlikely at the moment.
USD/JPY Ready to bounce back higher.
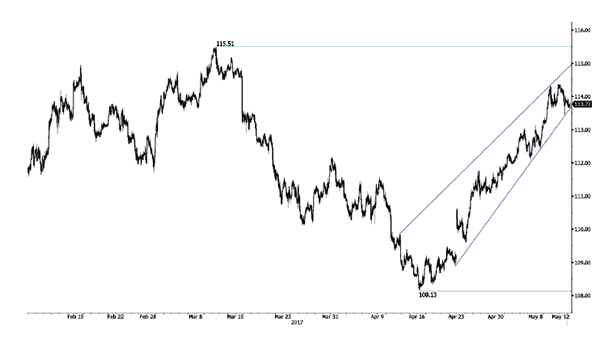
USD/JPY is pushing higher since the pair broke resistance given at 112.20 (31/03/2017 high). Hourly support can be found at 113.86 (11/05/2017 low). Stronger support is located at 108.13 (17/04/2017 low). Other key supports lie at a distant 106.04 (11/11/2016 low). Expected to show continued bullish pressures.
We favor a long-term bearish bias. Support is now given at 96.57 (10/08/2013 low). A gradual rise towards the major resistance at 135.15 (01/02/2002 high) seems absolutely unlikely. Expected to decline further support at 93.79 (13/06/2013 low).
USD/CHF Elliott Wave Analysis
USD/CHF – 1.0072
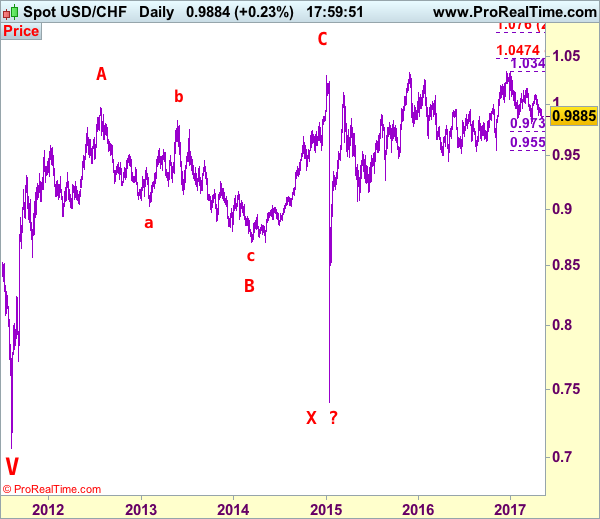
USD/CHF – Wave IV ended at 1.1730 and wave V has possibly ended at 0.7068
Although the greenback fell to as low as 0.9589 late last week, dollar found decent demand there and has staged a strong rebound in line with our bullish expectations, retaining our upside bias and bullishness remains for a test of resistance at 1.0108, however, break there is needed to signal the rise from 0.9813 low has resumed and extend gain to previous resistance at 1.0171. Looking ahead, once this level is penetrated, this would signal the retreat from 1.0344 has ended, bring further gain to 1.0200-10, then test of resistance at 1.0248 resistance, only above there would add credence to this view and bring resumption of early upmove for an eventual retest of 1.0344.
Our preferred count on the daily chart is that early selloff to 0.9630 is an end of the larger degree wave III and major correction is unfolding from there with a leg ended at 1.2298 (Nov 2008 with (a): 1.0625, (b):1.0011 and (c):1.2298), wave b ended at 0.9910 with (a): 1.0370, (b): 1.1967, (c): 0.9910. The rise from there to 1.1730 is the wave c which also marked the end of wave IV and wave V has possibly ended at 0.7068.
On the downside, whilst pullback to 1.0050 cannot be ruled out, reckon 1.0000 would hold and bring another rise later. Only below 0.9903 (previous resistance) would abort and prolong choppy trading, risk weakness towards said support at 0.9859 but price should stay well above previous support at 0.9813. Only below said support at 0.9813 would abort and confirm another leg of major fall from 1.0344 top is underway for further fall to 0.9735-40, however, oversold condition should prevent sharp fall below 0.9675-80 and price should stay well above 0.9600, bring rebound later.
Recommendation: Hold long entered at 0.9905 for 1.0105 with stop now at break-even
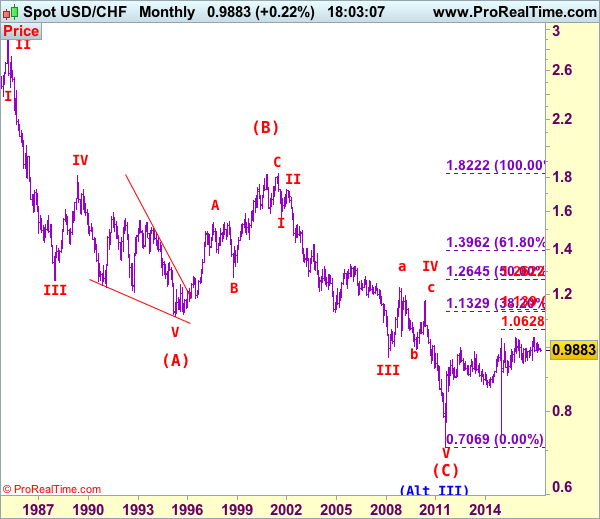
Dollar's long-term downtrend started from 2.9343 (Feb 1995) and it was unfolding as a (A)-(B)-(C) with (A): 1.1100, (B): 1.8310 (26 Oct 2000), then followed by another impulsive wave (C) with wave III ended at 0.9630 (Mar 2008). Under this count, correction in wave IV has possibly ended at 1.1730 and wave V already broke below support at 0.9630 and met indicated downside target at 0.7500 and 0.7400. The reversal from 0.7068 suggests the wave V has possibly ended and the breach of resistance at 0.9595 add credence to this view and indicated upside target at 1.0000 had been met, however, the sharp retreat from 1.0296 to 0.7401 suggests choppy trading would be seen but price should stay above said record low at 0.7068.
Trade Idea: GBP/USD – Hold short entered at 1.2955
GBP/USD – 1.2859
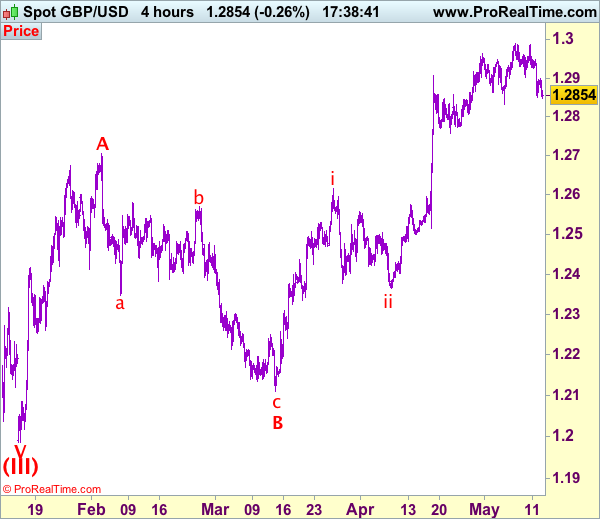
Recent wave: Wave V of larger degree wave (III) has ended at 1.1986 and major correction has commenced from there for gain to 1.3000 and 1.3140-50
Trend: Near term up
Original strategy :
Sold at 1.2955, Target: 1.2775, Stop: 1.3000
Position: - Short at 1.2955
Target: - 1.2775
Stop: - 1.3000
New strategy :
Hold short entered at 1.2955, Target: 1.2775, Stop: 1.2910
Position: - Short at 1.2955
Target: - 1.2775
Stop:- 1.3000
Cable finally dropped below previous support at 1.2900-03 and has remained under pressure, adding credence to our view that top has been formed at 1.2991 last week and bearishness remains weakness to 1.2831 support, however, a break below this level is needed to add credence to this view, bring retracement of recent rise to 1.2770-75 but previous support at 1.2757 should hold from here. We are keeping our view that the wave c as well as larger degree wave B has ended at 1.2109, hence impulsive wave C has commenced from there with wave i of C ended at 1.2616, follow by a correction to 1.2365 (end of wave ii) and wave iii rally is unfolding.
Our preferred count on the daily chart is that cable's rebound from 1.3500 (wave (A) trough) is unfolding as a wave (B) with A ended at 1.7043, followed by triangle wave B and wave C as well as wave (B) has ended at 1.7192, the subsequent selloff is the larger degree wave (C) which is still unfolding with minor wave (III) of larger degree wave 3 ended at 1.1986, hence wave (IV) correction is in progress which could either be a triangle wave (IV) of a complex formation but upside should be limited to 1.3500 and price should falter well below 1.4000, bring another decline in wave (V) of 3 for weakness to 1.1500, then 1.1200.
On the upside, expect recovery to be limited and previous support at 1.2903 (now resistance) should hold, bring another retreat later. Above 1.2950 would risk test of said resistance at 1.2991 but break there is needed to extend recent upmove to 1.3040-50 but overbought condition should limit upside to 1.3075-80 and price should falter below 1.3100.
Trade Idea: GBP/JPY – Buy at 144.50
GBP/JPY - 146.15
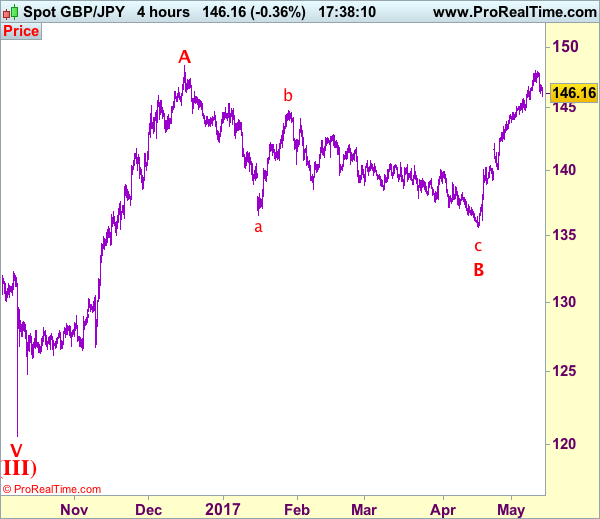
Recent wave: Medium term low formed at 120.50 and (A)-(B)-(C) major correction has commenced with (A) leg ended at 148.45, hence wave (B) is unfolding for retreat to 131.00-10.
Trend: Near term up
Original strategy:
Buy at 145.75, Target: 148.75, Stop: 145.15
Position: -
Target: -
Stop: -
New strategy :
Buy at 144.50, Target: 146.70, Stop: 143.90
Position: -
Target: -
Stop:-
As sterling has retreated after rising to 148.10 earlier this week, retaining our view that consolidation below this level would be seen and pullback to support at 145.65-70 is likely, however, reckon downside would be limited to 144.80 and renewed buying interest should emerge around 144.40-50, bring another rise later, above 146.90-00 would signal the pullback from 148.10 has ended, bring retest of this level, break there would extend recent upmove from 135.60 to previous chart resistance at 148.45, then towards 148.90-00 but overbought condition should prevent sharp move beyond 149.50, bring retreat later.
In view of this, would not chase this rise here and would be prudent to buy sterling on further subsequent pullback as 144.50-60 should limit downside, bring another rise later. Below said support at 144.00-10 would abort and suggest a temporary top is formed instead, bring correction to 143.50-60 but reckon 143.10-15 would hold from here, bring another rise later.
Our preferred count is that larger degree wave V with circle is unfolding from 251.12 with wave (I) 219.34, (II): 241.38 and wave (III) is subdivided into 1: 192.60, 2: 215.89 (23 Jul 2008) and wave 3 ended at 118.87 earlier in 2009. The correction from there to 162.60 is wave 4 which itself is a double three and is labeled as first a-b-c ended at 151.53, followed by wave x at 139.03, 2nd a ended at 162.60, 2nd b at 146.75 and 2nd c leg of wave 4 ended at 163.00. Therefore, the decline from 163.00 to 116.85 is now treated as wave 5 which also marked the end of larger degree wave (III), hence wave (IV) major correction has commenced for retracement of the wave (III) from 241.38 and upside target at 183.95-00 (50% Fibonacci retracement of the wave (II) from 241.38) had been met, a drop below 160.00 would suggest wave (IV) has ended at 195.85, bring decline in wave (V) for initial weakness to 130 (already met) and 120.
Euro Drifting As German GDP Matches Forecast
The euro is almost unchanged in the Friday session, as EUR/USD trades at 1.0870. On the release front, German Preliminary GDP gained 0.6%, matching the forecast. German Final CPI came in at a flat 0.0%, also matching the estimate. Eurozone Industrial Production contracted 0.1%, marking its third decline in four months. The weak reading missed the estimate of +0.3%. It's a busy day in the US, with CPI and Retail Sales reports for April. We'll also get a look at UoM Consumer Sentiment. Given the host of key events, traders should be prepared for some volatility from EUR/USD in the North American session.
A solid German economy has been the primary driver of an stronger euro area economy, which has posted improved numbers in the first quarter of 2017. Germany's economy expanded 0.6% in the first quarter, compared to a 0.4 gain in Q4 of 2016. The upswing was broadly based, with strong consumer and state spending, and an upsurge in the construction and manufacturing sectors. Stronger global demand has boosted German exports. However, inflation continues to recede, as Final CPI dropped to 0.0%. This trend has also characterized inflation in the eurozone, which showed rose earlier in the year but has since retracted.
The eurozone economy received a passing grade on Thursday, as the European Commission released its Spring 2017 Economic Forecast. The report noted that the European economy is in its fifth year of recovery, and forecast eurozone GDP growth of 1.7% in 2017 and 1.8% in 2018. On the inflation front, the report stated that inflation had risen in recent months, but this was mainly due to an increase in oil prices. Still, inflation was expected to reach 1.6% in 2017 and 1.3% in 2018, compared to just 0.2% in 2016. Stronger growth has led to lower unemployment, and the report projected that eurozone unemployment rate would drop to 9.4% in 2017 and 8.9% in 2018. The report also sounded a cautionary note, warning that risks to the eurozone economy remain tilted to the downside. These risks include a protectionist economic and trade policy in the US under President Trump, the banking sector in Europe and the UK's exit from the EU. This forecast is considerably more optimistic than the Winter 2017 forecast, as is apparent from the captions in the press releases for these two reports: The Winter forecast was entitled “Navigating through choppy waters”, while the caption for the Spring forecast reads “Steady growth ahead”.
President Donald Trump's firing of FBI director James Comey was perfectly legal, but the move has set off a political firestorm in Washington. Trump has been accused of triggering a constitutional crisis and undermining the rule of law. Comey had been conducting an investigation into possible collusion between Trump and Russia during the presidential campaign, so predictably, Comey's dismissal has raised suspicions that Trump is trying to impede the investigation by firing Comey. The crisis could heat up further, with calls in Congress to appoint an independent investigator into Trump's connections with Russia. This latest political storm has yet to shake up the markets, but a prolonged crisis could paralyze Washington and delay Trump's agenda of tax reform and increased fiscal spending.
US Uncertainties To Take Center Stage, WTI Bounces Back
Do not get carried away by oil's dead cat bounce
After falling as much as 20% in the second half of April, crude oil is making a comeback as the West Texas Intermediate bounced back at around $48 a barrel, up roughly 3% over the week. After the decision of OPEC and its allies to cut supply back in November last year, investors entered into a wait-and-see mode and took their time to assess the effectiveness of the OPEC decision. The market's enthusiasm was only short-lived but the WTI stabilised at between $48 and $55, during the first quarter at least.
It is quite clear that OPEC is always a trifle late. A few years ago the Cartel, realising that the US shale industry could jeopardise its dominant position in the oil business, tried to nip them in the bud by flooding the market with cheap oil. This move stopped any new investments in upstream exploration and killed the momentum of the US shale industry. However, the move came quite late as North America's frackers were already too efficient and were able to lower their break-even price well below $50 a barrel.
The problem now, is that OPEC countries are struggling with cheap oil prices, even though their breakeven prices are much lower (around $20 a barrel for Saudi Arabia, for example), as they need a higher price to balance their state budgets. To lift prices, OPEC trimmed production last year and members are currently discussing to extend the cut. Unfortunately for OPEC and its allies, the US shale industry, which does not participate to the cut, is the primary beneficiary of those production cuts. Indeed, the higher the price, the higher the number of profitable US wells.
Against such a backdrop of supply glut and subdued demand, we believe that the recovery in oil prices is quite limited, especially given the current set-up. The cartel has to cut production more aggressively and for longer if it wants to lift prices substantially. Only in the latter case, may we see WTI above $55 a barrel, but again, the primary beneficiary will be the US shale industry.
Focus is back on uncertainties in the US
Just when the President Trump-trade was gaining traction on the congressional passage of the Healthcare bill, new uncertainty threatens to derail the driver. Trump's poor-timing firing of FBI head James Comey has unleased fresh unease within the administration and will challenge his enacting critical pro-growth tax reform. Interestingly, the US and China trade deal reached overnight failed to gather much market positive reaction. At this point markets are unconcerned as volatility continues to contract. However, given the overstretched valuation it would not take much to shift investors' sentiment bearish.
This trigger and with a pause on scheduled risk events (UK parliamentary elections anticipating a landside Conservative victory and Fed 25bp rate hike fully priced in), sustained low volatility will further push investors into yield chasing, powering the already robust carry trade. We see upside for EM growth outlook above 4.5%, so a bit of support from commodity prices will give EM another strong bound. For today, US economic data will further support USD buying. Recent US data has been surprisingly solid followed by hawkish Fed comments and has pushed US yields higher. Markets expect headline CPI to increase by 0.2% m/m in April, which converts into annual inflation of 2.3%. Excluding energy and food prices, we think core CPI inflation will ease back to 0.2% m/m and annual 2.0% (flowing a fall for -0.1% in March).
We suspect that the reversal of inflation decline will keep pressure on the Fed to hike two or possibly three times in 2017. Given this scenario, we believe the market is still underpriced and should give short-end rates a boost. Higher front-end yield also equates in our mind to earlier discussions on strategies for reducing the Fed balance sheet (indirect tightening).
Retails sales will also be released, after slowing in 1Q February and the March headline fell 0.2% m/m consecutively, driven by weak sales in the auto sector. However, rebound in ISM non-manufacturing indicates that we should see a bounce. We anticipate that April headline retail sales will increase 0.6%. In addition, the markets will get business inventories and University of Michigan consumer sentiment.
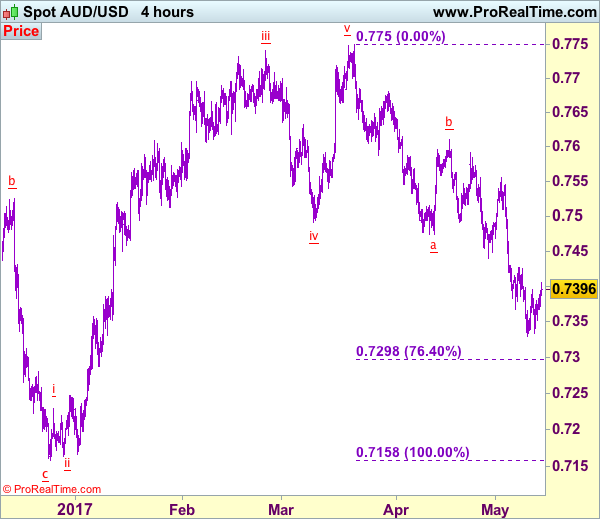
Trade Idea: EUR/JPY – Hold short entered at 124.00
EUR/JPY - 123.54
Recent wave: wave v of (C) ended at 94.12 and major correction in wave A has ended at 149.79
Trend: Near term up
Original strategy:
Sold at 124.00, Target: 122.20, Stop: 124.55
Position: - Short at 124.00
Target: - 122.20
Stop: - 124.55
New strategy :
Hold short entered at 124.00, Target: 122.20, Stop: 124.55
Position: - Short at 124.00
Target: - 122.20
Stop:- 124.55
As the single currency has retreated again after faltering below indicated resistance at 124.55, retaining our view that further consolidation would take place and as long as said resistance holds, mild downside bias remains for a test of support at 122.92-98, break there would suggest a temporary top is possibly formed, bring further fall to 122.60 but break of 122.00-10 is needed to add credence to this view, bring retracement of recent upmove to 121.50 first.
In view of this, we are holding on to our short position entered at 124.00. Above said resistance at 124.55 would abort and signal recent upmove is still in progress and may extend further gain towards 125.00 level but loss of upward momentum should prevent sharp move beyond 125.40-50, risk from there is seen for another retreat later.
Our latest preferred count is that wave (ii) is ABC-X-ABC which ended at 123.33 and wave (iii) is unfolding with wave iii ended at 100.77, followed by wave iv at 111.57 and wave v as well as the wave (iii) has ended at 97.04, followed by wave (iv) at 111.43 and wave (v) has ended at 94.12 which is also the end of the larger degree v, this also implied the major wave (C) has also ended there, hence major correction has commenced from there with (A) leg unfolding in its lower degree wave c which has possibly ended at 145.69. Under this count, A-B-C wave (B) has commenced with A leg ended at 136.23, wave B at 143.79 and wave C has possibly ended at 149.79.
Our larger degree count is that the decline from 139.26 is wave (C) and is sub-divided into a diagonal triangle i-ii-iii-iv-v with wave i - 105.44, wave ii- 123.33, wave iii - 97.03, wave iv - 111.43, followed by the final wave v as well as the end of wave (C) at 94.12, this also mark the bottom of larger degree wave B. Under this count, major rise in wave C has commenced as an impulsive wave with minor wave III ended at 145.69, wave V is still in progress for further gain to 150.00. Having said that, this so-called wave V could well be the first leg of larger degree 5-waver wave C and this wave C should bring at least a retest of wave A top at 169.97 (July 2008).
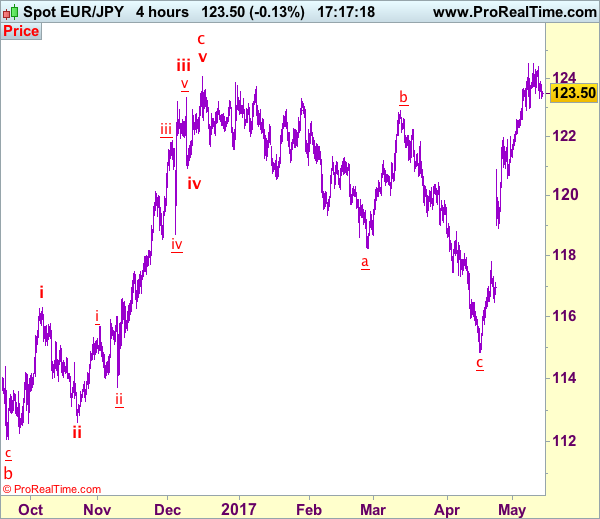
Trade Idea: AUD/USD – Buy at 0.7300
AUD/USD – 0.7395
Recent wave: Wave 5 ended at 1.1081 and major correction has commenced for fall to 0.7000 and then towards 0.6500-10
Trend: Near term down
Original strategy :
Buy at 0.7300, Target: 0.7500, Stop: 0.7240
Position: -
Target: -
Stop: -
New strategy :
Buy at 0.7300, Target: 0.7500, Stop: 0.7240
Position: -
Target: -
Stop:-
Although aussie has rebounded again after holding above support at 0.7329 (this week’s low) and minor consolidation above this level would be seen, reckon 0.7425-30 would limit upside and bring another decline later, below said support at 0.7329 would extend one more fall to 0.7295-00 (76.4% retracement of 0.7158-0.7750), however, loss of downward momentum should prevent sharp fall below there and bring rebound later, above 0.7425-30 would bring subsequent gain to 0.7490-00 but break of 0.7510 is needed to signal low is formed, then test of resistance at 0.7556 would follow.
In view of this, we are inclined to turn long on next decline. Below 0.7245-50 would risk weakness to 0.7200-10, however, reckon previous support 0.7158 would contain downside and aussie may stage another strong rebound from there later this week.
On the 4-hour chart, the move from 0.8066 is the wave 5 with i: 0.8860, ii: 0.8315, wave iii is an extended move ended at 1.0183, iv: 0.9706 and wave v has ended at 1.1081 (also the top of entire wave 5). The subsequent selloff is the major correction which is unfolding as ABC-X-ABC and 2nd A leg has ended at 0.8848, followed by a-b-c wave B which ended at 0.9758, hence, 2nd C wave is now in progress and indicated downside target at 0.7000 and 0.6950 had been met, so further fall to 0.6710-20 cannot be ruled out.
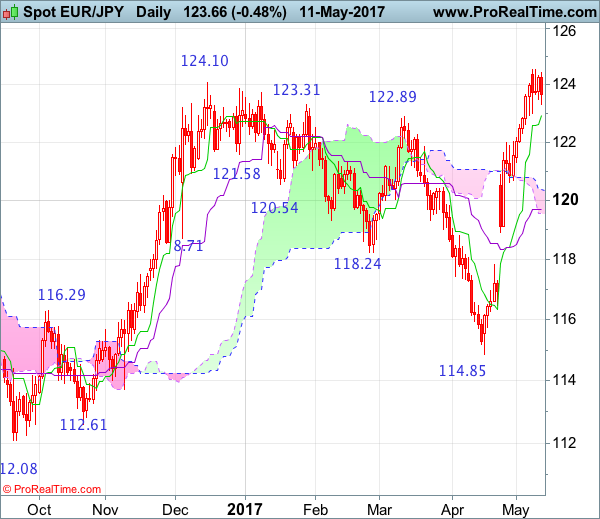
EUR/JPY Candlesticks and Ichimoku Analysis
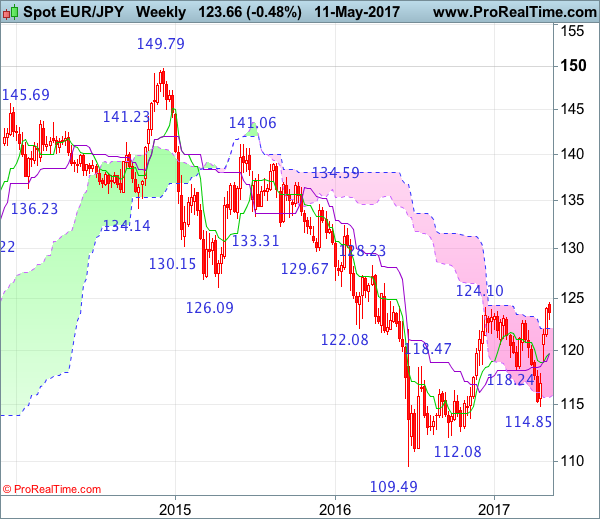
Weekly
• Last Candlesticks pattern: Hammer
• Time of formation: 19 Sep 2016
• Trend bias: Down
Daily
• Last Candlesticks pattern: Doji
• Time of formation: 28 Mar 2017
• Trend bias: Near term up
EUR/JPY – 123.12
As the single currency has eased after rising to 124.55 late last week, suggesting minor consolidation below this level would be seen and pullback to 122.95-00 cannot be ruled out, however, reckon downside would be limited to 122.30-35 and bring another rise later, above said resistance at 124.55 would extend early upmove from 109.49 low for headway to 125.00 and then 125.25-30 (50% Fibonacci retracement of 141.06-109.49) but reckon upside would be limited to 125.90-00, risk from there is seen for a retreat to take place soon due to overbought condition.
On the downside, whilst initial pullback to 122.90-00 cannot be ruled out, reckon downside would be limited to 122.30-35 and bring another upmove later to aforesaid upside targets. Below previous resistance at 121.98 would defer and suggest a temporary top is possibly formed, risk correction to 121.35-40 and then 121.00, however, reckon support at 120.60 would contain weakness and bring another rise later. Only a drop below support at 120.60 would confirm top formation, bring correction of recent upmove to 120.00 but downside should be limited to the Kijun-Sen (now at 119.70) and price should stay well above indicated support at 118.92, bring rebound later.
Recommendation: Buy at 122.00 for 124.50 with stop below 121.00.
On the weekly chart, the single currency has maintained a firm undertone after breaking previous resistance at 124.10 last week, adding credence to our view that the erratic rise from 109.49 has resumed, hence bullishness remains for this move to bring retracement of medium term downtrend to 124.85-90 (38.2% Fibonacci retracement of 149.79-109.49), then 125.25-30 (50% Fibonacci retracement of 141.06-109.49) but reckon upside would be limited to 126.00 and 126.45-50 would hold from here, bring retreat later.
On the downside, although initial pullback to the upper Kumo (now at 122.04) cannot be ruled out, reckon downside would be limited to 121.50 and bring another rise. Only below support at 120.60 would defer and risk weakness to 120.00 but reckon the Tenkan-Sen (now at 119.70) would limit downside and support at 118.92 should hold, bring another rebound later. A drop below 118.92 would shift risk to downside for further fall to 118.00, however, downside should be limited to previous resistance at 117.82 and bring rebound later. A weekly close below 117.82 would suggest first leg of rebound from 114.85 has ended, bring weakness to 117.00 but price should stay above 116.20-25, bring another rebound later.
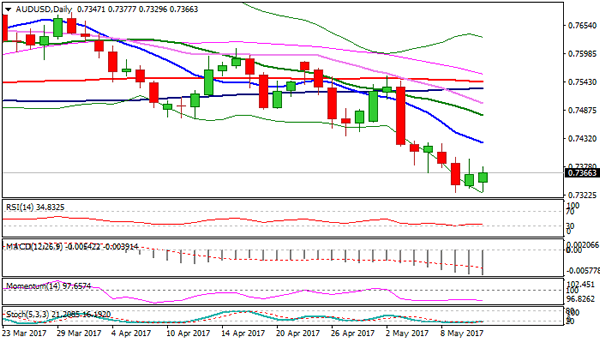
Technical Outlook: AUDUSD May Extend Recovery On Break Above Falling 10SMA
The Aussie remains constructive on Friday and probes above three-day congestion top at 0.7396. Bullish closes of past two day signal that immediate downside risk is sidelined, as broader bears found support at 0.7329 (weekly cloud base). The first pivot lies at 0.7416 (falling 10SMA/Fibo 38.2% of 0.7554/0.7327 downleg), firm break of which would signal stronger correction of 0.7554/0.7327 downleg . Next obstacle lies at 0.7440 (50% retracement), ahead of 0.7467 (Fibo 61.8% retracement, reinforced by falling 20SMA) which is expected to cap recovery before larger bears resume for renewed attack at weekly cloud base pivot.
Res: 0.7416, 0.7440, 0.7467, 0.7500
Sup: 0.7364, 0.7329, 0.7298, 0.7250