Sample Category Title
Will CPI And Consumer Data Signal A Q2 Rebound?
It's been a relatively flat start to trading on Friday but things should pick up as we approach the US session, with retail sales and inflation data due to be released, among others, and the Fed's Charles Evans scheduled to appear.
Will Investors Be So Confident on June Rate Hike if Data Doesn't Rebound?
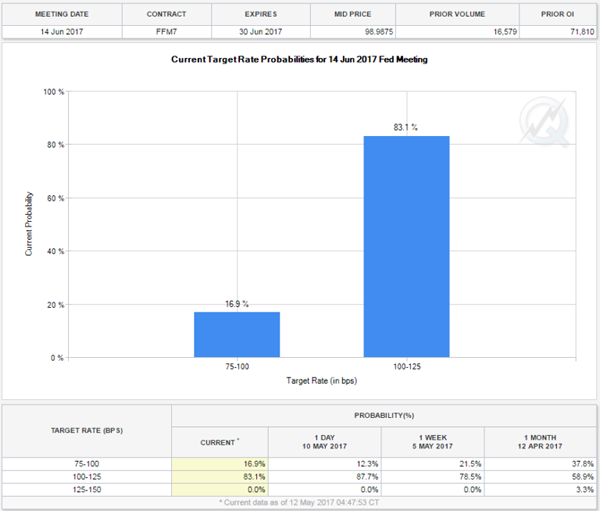
With the Federal Reserve looking to raise interest rates twice more this year and markets eyeing June for the next hike – 83% priced in based on Fed Funds futures – today's inflation and consumer figures are going to be closely followed.
While CPI may not be the Fed's preferred measure of inflation, it will offer insight into whether inflationary pressures are building or the trend of the last couple of months is continuing. That may prove to be a concern for the Fed ahead of the June meeting.
CAC Quiet as French Nonfarm Payrolls Beats Estimate
We'll also get insight into the US consumer, a very important part of the economy, with the release of retail sales data for April and UoM consumer sentiment data for May being released. It's been a disappointing couple of months for the US consumer but we're expecting a rebound this month, with sales seen rising by 0.6%, while consumer sentiment is seen holding at 97, very close to its multi-year highs. The tendency of the US to slow in the first quarter – as noted by the Fed in its statement last week – appears to be once again responsible for the weakness in recent inflation and spending figures, today could offer some insight into whether we'll see a similar second quarter rebound this year.
Gold Follows Copper and Oil Higher
Will One of the Fed's Most Dovish Members Support Higher Rates?
Charles Evans speech later today could offer some insight into the June meeting, with him being among the more dovish voting members of the committee. Should he allude to a rate hike next month then it would suggest there's relatively little opposition and markets are relatively well positioned, although there is still some room for it to be increasingly priced in.
Daily Technical Analysis: EURUSD, GBPUSD, USDJPY, USDCHF
EURUSD
The EURUSD had another indecisive movement yesterday. Price slipped below 1.0850 but still closed above the key support as you can see on my H1 chart below. The bias is neutral in nearest term. 1.0850 area remains a good place to buy with a tight stop loss as a clear break below that area would expose the pre-gap level at 1.0730 and the trend line support. Immediate resistance is seen around 1.0900. A clear break above that area could trigger further bullish pressure testing 1.0950 area and keeps the bullish outlook intact. Overall I remain neutral.
GBPUSD
The GBPUSD had a bearish momentum yesterday bottomed at 1.2848 but closed a little bit higher at 1.2888. The triple top formation I told you about yesterday gave us a valid bearish signal. The bias is bearish in nearest term testing 1.2830. A clear break below that area would expose 1.2780 region which is a good place to buy with a tight stop loss. Immediate resistance is seen around 1.2915. A clear break above that area could lead price to neutral zone in nearest term testing 1.2950 or higher. Overall I remain bullish.
USDJPY
The USDJPY was corrected lower yesterday bottomed at 113.45 but closed a little bit higher at 113.85. The bias is neutral in nearest term. 113.60 area remains a good place to buy with a tight stop loss as a clear break below that area would expose 113.00 or lower. Overall price is still in a bullish trend, but need a clear break above 114.35 to continue the bullish scenario testing 115.00 or higher.
USDCHF
The USDCHF had another indecisive movement yesterday. The bias is neutral in nearest term but overall price is still in a bullish phase after broke above the trend line resistance as you can see on my H4 chart below targeting 1.0170 area. Immediate support remains around 1.0050. A clear break back below that area would interrupt the bullish scenario testing 1.0000 region. Overall I remain neutral.
CAC Quiet As French Nonfarm Payrolls Beats Estimate
The CAC continues to drift this week. In the Friday session, the index is at 5386.00 points. On the release front, euro area data was mixed. French Nonfarm Payrolls posted a gain of 0.3%, edging above the estimate of 0.2%. German Preliminary GDP climbed 0.6% in the first quarter, matching the forecast. However, Eurozone Industrial Production contracted 0.1%, marking its third decline in four months. The weak reading missed the estimate of +0.3%. It's a busy day in the US, with the release of key consumer spending and inflation reports.
Germany is the locomotive of the eurozone, and strong numbers in the largest economy in Europe has boosted eurozone growth. The forecast for German Preliminary GDP was on target, as the economy expanded 0.6% in the first quarter, compared to a 0.4% gain in Q4 of 2016. The upswing was broadly based in the economy, with strong consumer and state spending, and an upsurge in the construction and manufacturing sectors. Stronger global demand has boosted German exports, notably for automobiles and machinery. However, inflation continues to recede, as Final CPI dropped to 0.0%. This trend has also characterized inflation in the eurozone, which rose earlier in the year but has since retracted.
Anytime Mario Draghi is talking, the markets are all ears. The ECB president spoke about monetary policy before a Dutch parliamentary committee on Wednesday, but there was nothing new in his remarks. Draghi reiterated that the ECB continues to monitor growth and inflation levels, but has no plans at present to modify its monetary policy. Draghi said that that central bank would tighten its policy once the 'tail risks' of a drop in inflation receded and growth improved. Currently, the ECB is making monthly purchases of EUR 60 billion under its asset-purchase scheme, which is scheduled to expire in December. Inflation levels were higher in the first quarter, which led to calls for Draghi to tighten policy. However, the ECB was reluctant to make any moves during the French election campaign, and this aversion could continue, with Germany holding elections in September. The central bank appears satisfied with the status quo, and can be expected to hold course, unless eurozone growth and inflation levels climb sharply.
ECB Study Shows Eurozone Unemployment Higher than Official Data
President Donald Trump appears to have badly misjudged the ramifications in firing FBI director James Comey. The firing has set off a political firestorm in Washington, with Trump facing accusations of triggering a constitutional crisis and undermining the rule of law. Comey had been conducting an investigation into possible collusion between Trump and Russia during the presidential campaign, so predictably, Comey's dismissal has raised suspicions that Trump is trying to impede the investigation by firing Comey. The crisis could heat up further, with calls in Congress to appoint an independent investigator into Trump's connections with Russia. This latest political storm has yet to shake up the markets, but a prolonged crisis could paralyze Washington and delay Trump's agenda of tax reform and increased fiscal spending.
DAX Steady As German GDP Climbs 0.6%
The DAX index has had an uneventful week, and is showing limited movement in the Friday session. Currently, the DAX is trading at 12,717.25. On the release front, German Preliminary GDP gained 0.6%, matching the forecast. German Final CPI came in at a flat 0.0%, also matching the estimate. Eurozone Industrial Production contracted 0.1%, marking its third decline in four months. The weak reading missed the estimate of +0.3%. It's a busy day in the US, with CPI and Retail Sales reports for April.
German economy has posted solid numbers in recent months, and the forecast for Preliminary GDP was on the money, as the economy expanded 0.6% in the first quarter, compared to a 0.4 gain in Q4 of 2016. The upswing was broadly based in the economy, with strong consumer and state spending, and an upsurge in the construction and manufacturing sectors. Stronger global demand has boosted German exports, notably for automobiles and machinery. However, inflation continues to recede, as Final CPI dropped to 0.0%. This trend has also characterized inflation in the eurozone, which rose earlier in the year but has since retracted.
The eurozone economy received a passing grade on Thursday, as the European Commission released its Spring 2017 Economic Forecast. The report noted that the European economy is in its fifth year of recovery, and forecast eurozone GDP growth of 1.7% in 2017 and 1.8% in 2018. On the inflation front, the report stated that inflation had risen in recent months, but this was mainly due to an increase in oil prices. Still, inflation was expected to reach 1.6% in 2017 and 1.3% in 2018, compared to just 0.2% in 2016. Stronger growth has led to lower unemployment, and the report projected that eurozone unemployment rate would drop to 9.4% in 2017 and 8.9% in 2018. The report reiterated what ECB president Mario Draghi has long been saying, namely, that risks to the eurozone economy remain tilted to the downside. These risks include US economic and trade policy under President Trump, the banking sector in Europe and the UK's exit from the EU. This forecast is considerably more optimistic than the Winter 2017 forecast, as is apparent from the captions in the press releases for these two reports: The Winter forecast was entitled “Navigating through choppy waters”, while the caption for the Spring forecast reads “Steady growth ahead”.
ECB President Mario Draghi addressed a Dutch parliamentary committee on Wednesday, and reiterated that the ECB continues to monitor growth and inflation levels, but has no plans at present to modify its monetary policy. Draghi said that that central bank would tighten its policy once the “tail risks” of a drop in inflation receded and growth improved. Currently, the ECB is making monthly purchases of EUR 60 billion under its asset-purchase scheme, which is scheduled to expire in December. Inflation levels were higher in the first quarter, which led to calls for Draghi to tighten policy. However, the ECB was reluctant to make any moves during the French election campaign, and this aversion could continue, with Germany holding elections in September. Bottom line? We can expect the ECB to hold course, unless eurozone growth and inflation levels climb sharply.
President Donald Trump's firing of FBI director James Comey could have been viewed as yet another controversial move by the temperamental president , but the firing has set off a political firestorm in Washington. Trump has been accused of triggering a constitutional crisis and undermining the rule of law. Comey had been conducting an investigation into possible collusion between Trump and Russia during the presidential campaign, so predictably, Comey's dismissal has raised suspicions that Trump is trying to impede the investigation by firing Comey. The crisis could heat up further, with calls in Congress to appoint an independent investigator into Trump's connections with Russia. This latest political storm has yet to shake up the markets, but a prolonged crisis could paralyze Washington and delay Trump's agenda of tax reform and increased fiscal spending.
GOLD Short-Term Bearish, SILVER Short-Term Bounce At $16.00, CRUDE OIL Bullish Consolidation.
GOLD Short-term bearish.
Gold continues its decline after the yellow metal has faded near the hourly resistance at 1295 (18/04/2017 high). Hourly support is now located at 1195 (10/03/2017 low). The road is wide-open for further decline.
In the long-term, the technical structure suggests that there is a growing upside momentum. A break of 1392 (17/03/2014) is necessary ton confirm it, A major support can be found at 1045 (05/02/2010 low).
SILVER Short-term bounce at $16.00.
Silver's bearish pressures are still lively despite short-term consolidation. Strong support is given at 15.63 (20/12/2017 low). Closest support is given at 16.20 (04/05/2017 low). Key resistance is given at a distance at 19.00 (09/11/2017 high). Expected to see continued bearish pressures.
In the long-term, the death cross indicates that further downsides are very likely. Resistance is located at 25.11 (28/08/2013 high). Strong support can be found at 11.75 (20/04/2009).
CRUDE OIL Bullish consolidation.
Crude oil is bouncing back on short-squeeze move. The commodity has bounced from a level below $48. Support is given at 43.76 (05/05/2017 low). Expected to see renewed bearish pressures.
In the long-term, crude oil has recovered after its sharp decline last year. However, we consider that further weakness are very likely. Strong support lies at 24.82 (13/11/2002) while resistance can now be found at 55.24 (03/01/2017 high).
EUR/JPY Sideways Price Action, EUR/GBP Weakening, EUR/CHF Fading Below 1.1000.
EUR/JPY Sideways price action.
EUR/JPY's bullish run has stalled below range resistance at 124.59 (07/05/2017 high), Hourly support is given at 122.93 (05/05/2017 low). Major support is given at 114.90 (18/04/2017low). Expected to see further renewed buying pressures towards 125.00.
In the longer term, the technical structure validates a medium-term succession of lower highs and lower lows. As a result, the resistance at 149.78 (08/12/2014 high) has likely marked the end of the rise that started in July 2012. Strong support at 94.12 (24/07/2012 low) looks nonetheless far away.

EUR/GBP Weakening.
EUR/GBP is trading lower. The technical structure remains negative as long as the resistance at 0.8530 (25/04/2017 low) holds. Expected to show continued weakness until support given at 0.8304 (05/12/2017 low).
In the long-term, the pair has largely recovered from recent lows in 2015. The technical structure suggests a growing upside momentum. The pair is trading above from its 200 DMA. Strong resistance can be found at 0.9500 psychological level.

EUR/CHF Fading below 1.1000.
EUR/CHF's volatility is getting stronger. Resistance given is given at 1.0978 (09/05/2017 high). Despite the sharp increase and the recent bullish breakout which is very likely psychological, we believe that the medium-term pattern suggests us to see at some point renewed bearish pressures towards key support that can be found at 1.0623 (24/06/2016 low).
In the longer term, the technical structure is mixed. Resistance can be found at 1.1200 (04/02/2015 high). Yet,the ECB's QE programme is likely to cause persistent selling pressures on the euro, which should weigh on EUR/CHF. Supports can be found at 1.0184 (28/01/2015 low) and 1.0082 (27/01/2015 low).
Technical Outlook: Spot Gold Extends Recovery On Friday, US Data In Focus For Fresh Signals
Spot Gold is holding positive tone on Friday, following Thursday's bullish close and regained former strong support now reverted to resistance at $1229 (broken Fibo 38.2% of $1122/$1295 ascend).
The yellow metal was boosted by political turmoil in the US that pressured the dollar and increased demand for safe haven gold.
Additional support was provided by daily slow stochastic and RSI which reversed from oversold territory and show room for further upside on break above $1229 pivot.
However, recovery may be limited as overall structure is bearish and a cluster of resistances en-route is expected to cap rallies.
Falling 10SMA offers immediate resistance at $1232, followed by south-heading daily Tenkan-sen (currently at $1236) and daily cloud top at $1239 which is expected to cap extended upticks.
Gold is awaiting release of US data today for fresh signals. Better than expected US CPI and Retail Sales numbers would boost the dollar and push gold towards its near-term target at $1210.
On the other side, downbeat results would risk bullish acceleration above daily cloud top which would generated stronger signal for extended correction and expose next pivot at $1245 (Fibo 38.2% of $1295/$1214 fall).
Res: 1229, 1232, 1236, 1239
Sup: 1225, 1216, 1214, 1210
USDJPY Searching For Resistance, Temporary Corrections May Show Up
On the 4h chart of USDJPY we can see a strong recovery taking place from around the 108.12 level where a bigger three wave A)-B)-C) pattern was completed. That said current reversal is viewed as wave 1, the first wave of a possible bigger five wave development that may take weeks to unfold. As such, more upside will be expected after a pullback down in wave 2 that may show up, once wave 1 finds a top. Support for the upcoming wave 2 may be found around the region of support at 111.58/112.22. That said, once the lower channel line gets breached that is when wave 1 will be regarded as completed and wave 2 will be in play.
USDJPY 4H
EUR/JPY Elliott Wave Analysis
EUR/JPY - 123.58
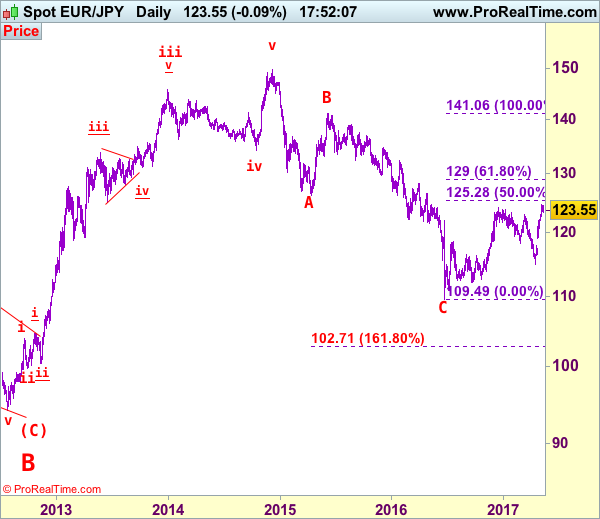
EUR/JPY: Wave v as well as larger degree wave (C) ended at 94.11 and first leg of larger degree wave C upmove has possibly ended at 149.79 and wave 2 correction has possibly ended at 109.49.
Last week’s breach of previous resistance at 124.10 confirms our bullish view that early erratic rise from 109.49 low has resumed and upside bias remains for this move to extend further gain to 124.65, then 125.25-30 (50% Fibonacci retracement of 141.06-109.49) but near term overbought condition should prevent sharp move beyond resistance at 126.47 and price should falter below 127.50-60, risk from there has increased for a retreat to take place later.
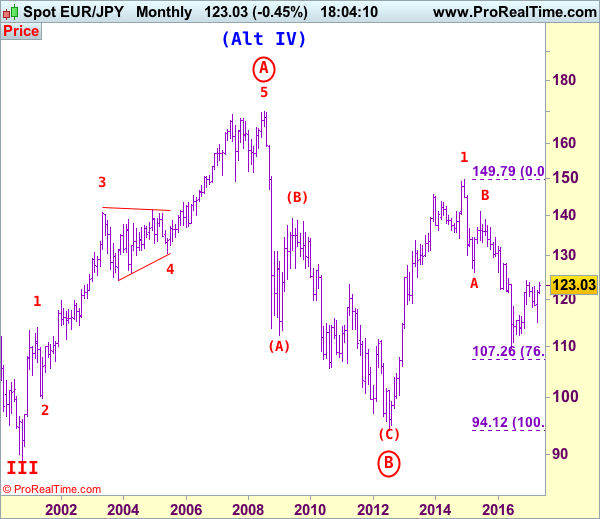
The daily chart is labeled as attached, early selloff from 169.97 (July 2008) to 112.08 is wave (A) of B instead of end of entire wave B and then the rebound from there to 139.26 is wave (B), hence, wave (C) has possibly ended at 94.12 with a diagonal triangle as labeled in the daily chart, hence upside bias is seen for further gain. Recent rally above indicated retracement level at 116.69 (50% Fibonacci retracement of the intermediate fall from 139.26-94.12) adds credence to this view and signal major reversal has commenced but first leg of this wave C has possibly ended at 149.79, hence wave 2 has commenced with wave A ended at 126.09, followed by wave B at 141.06, wave C commenced and could have ended at 109.49, above 125.00 would add credence to this view.
On the downside, whilst initial pullback to 123.00-10 cannot be ruled out, reckon downside would be limited to 122.00-10 and bring another rise to aforesaid upside targets. Only below indicated support at 120.60 would defer and risk deeper pullback to 120.00 but downside should be limited to 119.40-50 and support at 118.90-95 should remain intact, bring another rise later.
Recommendation: Buy at 122.00 for 124.50 with stop below 121.00.
To re-cap the corrective upmove from the record low of 88.93 (18 Oct 2000), the wave A from there is subdivided as: 1:88.93-113.72, 2:99.88 (1 Jun 2001), 3:140.91 (30 May 2003), 4:124.17 (10 Nov 2003) and 5 ended at record high of 169.97 (21 Jul 2008). The brief but sharp selloff to 112.08 is viewed as a-b-c x a-b-c wave (A) of B. The subsequent rebound to 139.26 is (B) of B and (C) of (B) has possibly ended at 94.12 and in any case price should stay well above previous chart support at 88.93, bring rally in larger degree wave C towards 150.00.
USD/CHF Monitoring Resistance At 1.0107, USD/CAD Range Bound, AUD/USD Continued Pause.
USD/CHF Monitoring resistance at 1.0107.
USD/CHF has paused after sharp reversal off 0.9864 low. The technical structure has invalidated the short-term negative momentum. Hourly resistance is given at 1.0107 (10/04/2017 high). Support can be located at 1.0049 (10/05/2017 low).
In the long-term, the pair is still trading in range since 2011 despite some turmoil when the SNB unpegged the CHF. Key support can be found 0.8986 (30/01/2015 low). The technical structure favours nonetheless a long term bullish bias since the unpeg in January 2015.
USD/CAD Range bound.
USD/CAD has declined after failing to reach 1.3800 before bouncing back. Hourly support can be found at 1.3411 (24/04/2017 high) then 1.3353 (20/01/2017 high). Expected to show renewed bullish pressures as long as the pair remains above 1.3530 (27/04/2017 low).
In the longer term, there is a golden cross with the 50 dma crossing the 200 dma indicating further upside pressures. Strong resistance is given at 1.4690 (22/01/2016 high). Long-term support can be found at 1.2461 (16/03/2015 low).
AUD/USD Continued pause.
AUD/USD has paused above key support at 0.7339 (intraday low). As long as prices remain below the resistance at 0.7608 (17/04/2017 high), the short-term technical structure is negative. Key resistance stands at 0.7681 (30/03/2017 high). Expected to show further weakness.
In the long-term, we are waiting for further signs that the current downtrend is ending. Key supports stand at 0.6009 (31/10/2008 low) . A break of the key resistance at 0.8295 (15/01/2015 high) is needed to invalidate our long-term bearish view.