
Sample Category Title
EUR/USD Mid-Day Outlook
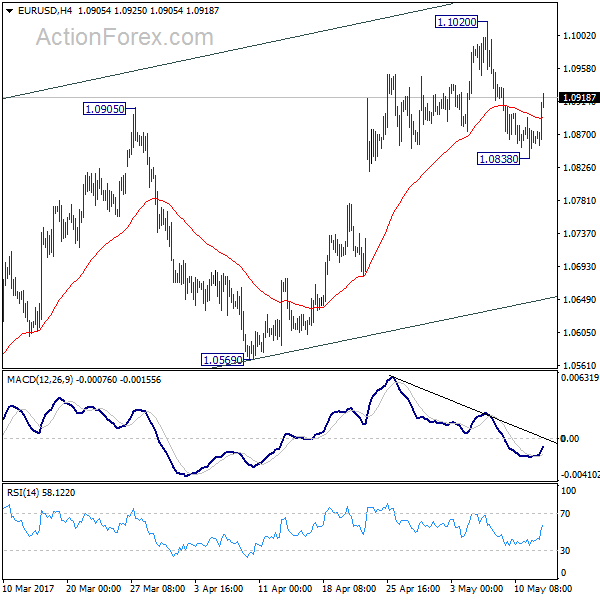
Daily Pivots: (S1) 1.0834; (P) 1.0864 (R1) 1.0889; More....
With a temporary low in place at 1.0838 in EUR/USD, intraday bias is turned neutral first. On the downside, below 1.0838 will target 55 day EMA first (now at 1.0760). As noted before, rise from 1.0339 is seen as a corrective move. Break of 55 day EMA will affirm the case that such correction is completed and bring deeper decline to 1.0569 for confirmation. However, above 1.1020 will extend such corrective rise instead.
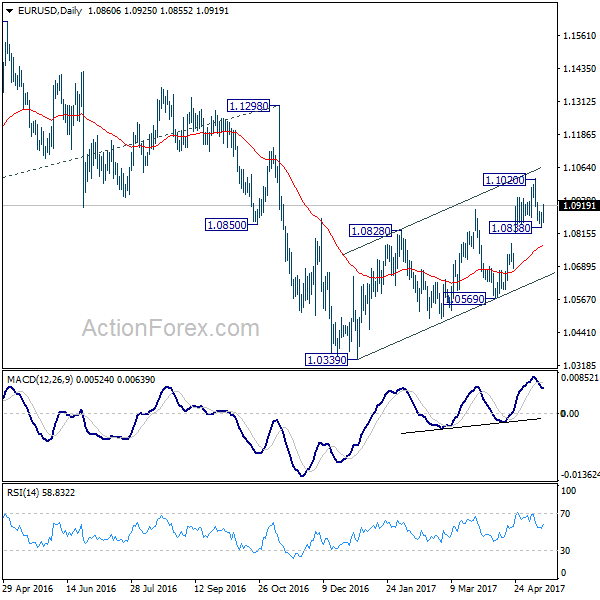
In the bigger picture, as long as 1.1298 key resistance holds, whole down trend from 1.6039 (2008 high) is still expected to continue. Break of 1.0339 low will send EUR/USD through parity to 61.8% projection of 1.3993 to 1.0461 from 1.1298 at 0.9115. However, considering bullish convergence condition in weekly MACD, break of 1.1298 will indicate long term reversal.
GBP/USD Mid-Day Outlook
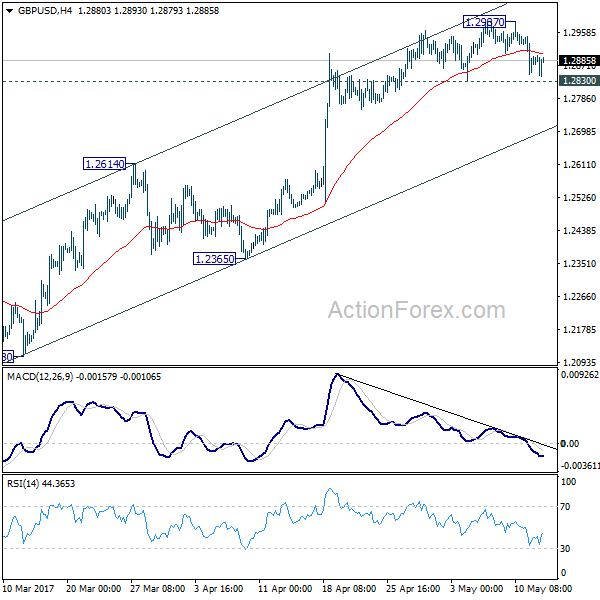
Daily Pivots: (S1) 1.2840; (P) 1.2894; (R1) 1.2940; More...
Intraday bias in GBP/USD remains neutral for the moment. Another rise cannot be ruled out, but upside momentum is clearly weak with bearish divergence condition in 4 hour MACD. Also, current rally is seen as part of the corrective pattern from 1.1946. Hence, even in case of another rally, we'll look for reverse signal above 1.2987. Meanwhile, break of 1.2830 support will indicate short term topping. In such case, intraday bias will be turned back to the downside for 1.2614 support.
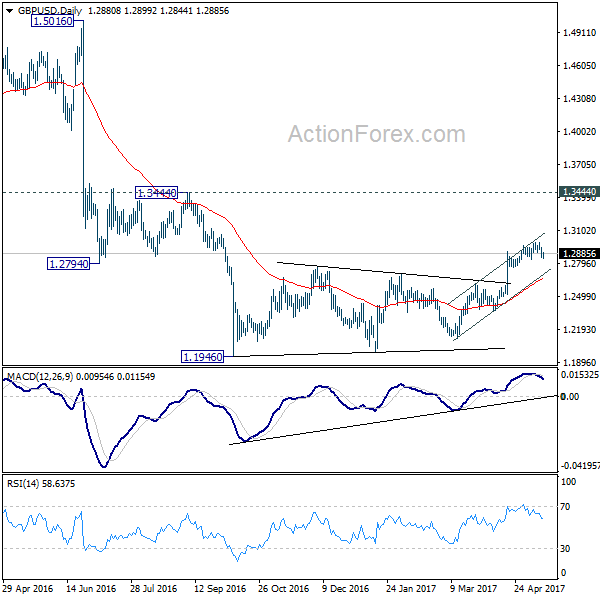
In the bigger picture, fall from 1.7190 is seen as part of the down trend from 2.1161. There is no sign of medium term reversal yet. Sustained trading below 61.8% projection of 2.1161 to 1.3503 from 1.7190 at 1.2457 will target 100% projection at 0.9532. Overall, break of 1.3444 resistance is needed to confirm medium term bottoming. Otherwise, outlook will remain bearish.
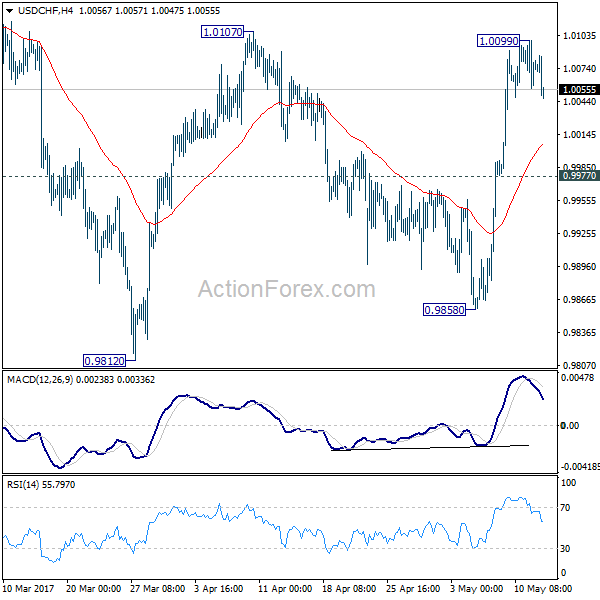
USD/CHF Mid-Day Outlook
Daily Pivots: (S1) 1.0056; (P) 1.0077; (R1) 1.0099; More.....
Intraday bias in USD/CHF remains neutral as consolidation from 1.0099 temporary top extends lower. Deeper pull back could be seen. But downside is expected to be contained by 0.9977 and bring another rise. As noted before, correction from 1.0342 should have completed at 0.9812. Break of 1.0107 should pave the way to retest 1.0342 high.
In the bigger picture, we're still maintaining that firm break of 1.0342 key resistance is needed to confirm underlying bullish momentum in the pair. However, the corrective nature of the fall from 1.0342 is starting to give the medium term outlook a bullish favor. Hence, in stead of looking for topping signal around 1.0342, we'd now pay closer attention to upside acceleration as USD/CHF approaches this level again.

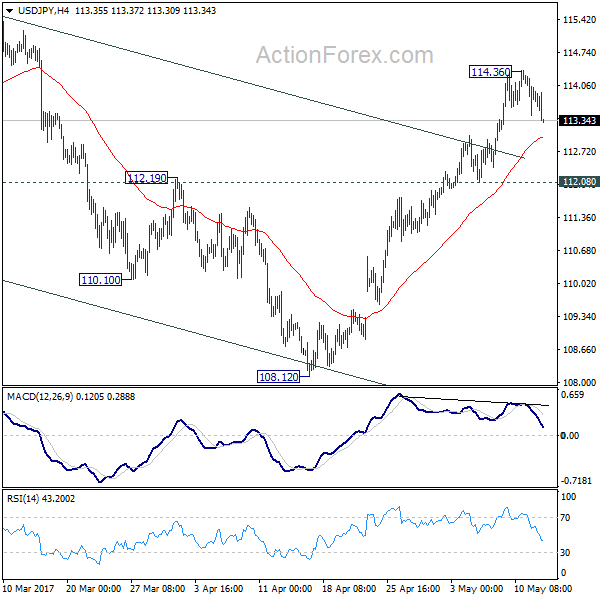
USD/JPY Mid-Day Outlook
Daily Pivots: (S1) 113.42; (P) 113.89; (R1) 114.33; More...
USD/JPY's retreat from 114.36 extends lower but it's staying above 112.08 support. Intraday bias remains neutral for more consolidation and outlook is unchanged. In case of deeper fall, downside should be contained by 112.08 support and bring another rally. Outlook remains unchanged that correction from 118.65 has completed with three waves down to 108.12. Above 114.36 will target 115.49 resistance first. Break will resume larger rally from 98.97 to 125.85 high.
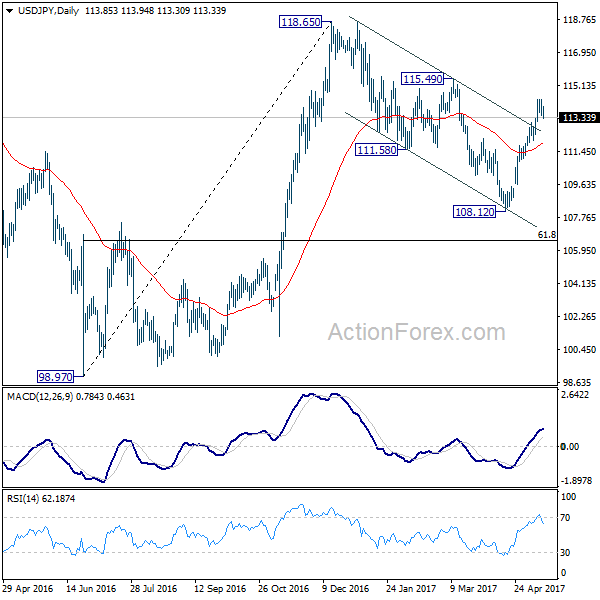
In the bigger picture, price actions from 125.85 high are seen as a corrective pattern. It's uncertain whether it's completed yet. But in case of another fall, downside should be contained by 61.8% retracement of 75.56 to 125.85 at 94.77 to bring rebound. Meanwhile, break of 115.49 resistance will extend the rise from 98.97 to retest 125.85. Overall, rise from 75.56 is still expected to resume later after the correction from 125.85 completes.
Dollar Reverses after CPI and Retail Sales Disappointment, Set to End the Week Mixed
Dollar weakens broadly in early US session after disappointment from economic data. While the greenback is still trading at the strongest major currency for the week at the time of writing, it could end the week mixed. Headline CPI slowed to 2.2% yoy in April, down from 2.4% yoy, and missed expectation of 2.3% yoy. Core CPI slowed to 1.9% yoy, down from 2.0% yoy and missed expectation of 2.0% yoy. Headline retail sales rose 0.4%, below consensus of 0.6%. Ex-auto sales rose 0.2%, also below consensus of 0.5%. Elsewhere, Eurozone industrial production dropped -0.1% mom in March. German GDP rose 0.6% qoq in Q1. CPI was finalized at 2.0% yoy in April. Japan M2 rose 4.3% yoy in April, New Zealand business NZ manufacturing index dropped to 56.8 in April.
ECB Lane: Risks moving towards balance
ECB Governing Council member Philip Lane said that risks in the Eurozone economy are "still below balance but moving towards balance." And he emphasized the "need to see evidence that wage inflation is actually on its way to a level consistent with the target." And, the core is that how much of the "reasonably good data on output and unemployment" would "map into sustainable inflation". Regarding future monetary policy path, Lane said that "something has to happen in the rest of this year given there needs to be a plan in 2018."
BoJ official very cautious about an exit now
In Japan, BoJ Executive Director Masayoshi Amamiya said that there are "sufficient methods and tools" for stimulus exit. And, "it's possible to normalize monetary conditions while maintaining market stability". Board member Yutaka Harada urged the central bank to be "very careful" regarding stimulus exit. Hara said that "there might be a cost of delaying an exit. At the same time, there is a cost for an urgent exit". And emphasized that "we have to be very cautious about an exit now".
G7 FM to meet in Italy
G7 finance chiefs will start a two day meeting in Italy today. It's reported that Europe, Japan and Canada are seeking to get a clearer picture of US President Donald Trump's policies, through Treasury Secretary Steven Mnuchin. According to a Treasury spokesman, Mnuchin will brief G7 on the still evolving tax and regulatory reforms. However, trade and protectionism seem to be off the meeting's agenda. In addition, there will be a discussion of Greece's debt ahead of the May 22 meeting of Eurozone finance ministers,. with presence of representatives of ECB and IMF. IMF is believed to be pushing for debt relief measures for Greece which is objected by Eurozone governments for the time being.
USD/JPY Mid-Day Outlook
Daily Pivots: (S1) 113.42; (P) 113.89; (R1) 114.33; More...
USD/JPY's retreat from 114.36 extends lower but it's staying above 112.08 support. Intraday bias remains neutral for more consolidation and outlook is unchanged. In case of deeper fall, downside should be contained by 112.08 support and bring another rally. Outlook remains unchanged that correction from 118.65 has completed with three waves down to 108.12. Above 114.36 will target 115.49 resistance first. Break will resume larger rally from 98.97 to 125.85 high.
In the bigger picture, price actions from 125.85 high are seen as a corrective pattern. It's uncertain whether it's completed yet. But in case of another fall, downside should be contained by 61.8% retracement of 75.56 to 125.85 at 94.77 to bring rebound. Meanwhile, break of 115.49 resistance will extend the rise from 98.97 to retest 125.85. Overall, rise from 75.56 is still expected to resume later after the correction from 125.85 completes.
Economic Indicators Update
| GMT | Ccy | Events | Actual | Forecast | Previous | Revised |
|---|---|---|---|---|---|---|
| 22:30 | NZD | Business NZ Manufacturing Index Apr | 56.8 | 57.8 | 58 | |
| 23:50 | JPY | Japan Money Stock M2+CD Y/Y Apr | 4.30% | 4.30% | 4.30% | 4.20% |
| 06:00 | EUR | German GDP Q/Q Q1 P | 0.60% | 0.60% | 0.40% | |
| 06:00 | EUR | German CPI M/M Apr F | 0.00% | 0.00% | 0.00% | |
| 06:00 | EUR | German CPI Y/Y Apr F | 2.00% | 2.00% | 2.00% | |
| 09:00 | EUR | Eurozone Industrial Production M/M Mar | -0.10% | 0.30% | -0.30% | |
| 12:30 | USD | CPI M/M Apr | 0.20% | 0.20% | -0.30% | |
| 12:30 | USD | CPI Y/Y Apr | 2.20% | 2.30% | 2.40% | |
| 12:30 | USD | CPI Core M/M Apr | 0.10% | 0.20% | -0.10% | |
| 12:30 | USD | CPI Core Y/Y Apr | 1.90% | 2.00% | 2.00% | |
| 12:30 | USD | Advance Retail Sales Apr | 0.40% | 0.60% | -0.20% | |
| 12:30 | USD | Retail Sales Less Autos Apr | 0.20% | 0.50% | 0.00% | |
| 14:00 | USD | U. of Michigan Confidence May P | 97 | 97 | ||
| 14:00 | USD | Business Inventories Mar | 0.10% | 0.30% |
Pound Remains Under Pressure Following BoE Growth Downgrade
If investors were looking for a reason to sell the Pound at its recent elevated levels, they found encouragement yesterday when the Bank of England (BoE) downgraded its growth forecast for the UK economy in 2017. Although a growth downgrade from 2% to 1.9% is hardly significantly material in the grand scheme of things, it has been used by traders as motivation to drag the Pound lower with the GBPUSD currently under pressure as trading concludes for the week.
The question to ask moving forward is which direction the Pound could take next. My personal opinion is that the BoE's negative views on inflation pressures should weigh on investor sentiment for a while. In addition, there is another major potential event risk for the Pound ahead with the General Election just a month away.
Just because Theresa May is seen as the most likely candidate to win the election next month, it doesn't mean that there won't be volatility in the Pound during the run up to the event. My view is also that investors have underpriced the risk of May not being victorious, meaning there could be some serious shuffling of positions if preliminary polls suggest that Theresa May does have a fight on her hands.
Another factor to consider in the future is how the prolonged Brexit negotiations with the European Union are likely to be, which is going to be quite a drag in the sand if I am honest with you. It shouldn't be misunderstood that the economic sentiment in Europe is gradually picking up decent momentum, and this could in fact provide the EU with some negotiating power when it comes to saying that it might be able to stand on its own feet with the United Kingdom as a fellow member.
Recent comments from Theresa May where she seemed to accuse the EU of influencing the upcoming elections are also not going to help secure the UK any leniency when it comes to a trade deal with Europe, if she ends up being the one to lead with negotiations that is.
EUR/USD Tests Support Ahead of US Retail Sales and CPI
EUR/USD has retraced around 1.15% post the second-round vote of the French presidential election.
The retracement was held above the support line at 1.0850 since yesterday.
On the 4-hourly chart, the 10 SMA is crossing over the 20 SMA, indicating the bearish momentum is waning.
The daily Stochastic Oscillator reading is below 20, suggesting a rebound.
However, if the support line at 1.0820 is broken, then we can expect an extended downtrend.
We will see the release of a set of crucial US data for April at 13:30 BST today; retail sales, retail sales excluding autos, CPI and core CPI. Please be aware that it will likely affect USD and USD crosses along with commodities.
With better-than-expected readings, it will likely weigh on EUR/USD, and tests supports.
With lower-than-expected readings, it will likely push EUR/USD up, and tests resistances.
The resistance level is at 1.0880, followed by 1.0900 and 1.0930.
The support line is at 1.0850, followed by 1.0835 and 1.0820.
The Correction on the “Black Gold” Market May Continue
Bears dominate on the oil market since April. I'd like to remind that earlier recommended selling oil to USD 50.00 and it has hit that mark. Futures for #CL have decreased by more that 16%. WTI has fount its support at 44.25 USD.
There was an abrupt turn of the quotes yesterday. Oil grew by more than 3% thanks to the support of the EIA. The US oil inventories have fallen by 5.247 million barrels during the previous week. Note, that the expectations were at the 1.786 million barrels mark. This decrease took place because of bad weather in the Gulf of Mexico.
Conclusions of the EIA Report:
- oil reserves: -5.247 million barrels;
- oil production: + 21 thousand barrels per day (=9.314 million)
- distillates stocks: -1.587 million barrels;
- gasoline stocks: -0.150 million barrels;
Everybody is waiting for the OPEC meeting at the moment to know about the outcome of the discussion of the production reduction. It will be help on May 25.
Trading recommendations:
Support levels: 47.00 USD, 44.25 USD
Resistance levels: 49.25 USD, 51.85 USD, 53.50 USD
Bulls dominate on the market now. The technical pattern shows a possibility of a correction. Here are the signals that indicate it:
1) the MACD indicator has reached the positive zone. It Is still rising now.
2) Bullish Engulfing, a strong reversal PA pattern, has emerged on the daily chart.
I'd recommend you buying oil after the price reaches the 48.15 USD local resistance level. 49.25 USD may be a goal for taking profit. I think that #CL may go to 50.00 and 51.50 USD marks in the medium term. These marks are the 61.8% and 78.6% correction levels. Use a trailing stop while working with this position.
USD/JPY Daily Confluence At Support
The USD/JPY is currently supported at POC zone 113.40-60 (Trend line, D L3, Order block, EMA89) and we might see a spike towards D L3 - 114.10. The pair is in uptrend on intraday (H1) and intra week (H4) charts. 1h or 4h candle close above 114.10 should provide additional strength in this pair, targeting 114.35 (ATR high) and 114.75 (D L5) if we see additional volatility. W H3 and ATR low should hold (113.15) if bulls want to remain in control. Bears would only have control below D L5 (112.90). If that happens during next days we might expect 112.15 as the target.
Pound Tumbles after BoE Downgrades its Inflation Forecasts
On its second "Super Thursday" of the year, the BoE kept its policy unchanged via a 7-1 vote, in line with the consensus. The lone dissenter was Forbes again, who voted for a hike, but considering that she is leaving the Committee in June, her dissent may have carried less importance for investors. There was speculation that we may have had another member, Saunders, dissenting this time. However, he preferred to stand pat, which may have come as a disappointment to those who were expecting a second vote for a rate increase. Turning to the Inflation Report, the BoE lowered its inflation projections for 2018 and 2019, which diminishes further the probability for a hike due to inflation overshooting in the foreseeable future. As a response to these, the pound tumbled.
The only point that appeared hawkish on a first glance was the final sentence of the minutes. The Bank noted that if the economy remains robust, policy could be tightened by a somewhat greater extent than the market yield curve currently implies. However, after digging into the Inflation Report, we noticed that both the market and the Bank have pushed back their expectations for a 25bps rate increase. The market just pushed it back further. According the market, such a move is fully priced in for Q4 2019, so even one quarter earlier is in line with the Bank's view, and is thus not as hawkish as it initially appears.
All these signals from the BoE confirm our view that the Bank is likely to remain on hold throughout this year, and even the next one if the data evolve more or less in line with expectations. As for the pound, we think that GBP traders are now likely to turn their attention back to developments surrounding the upcoming General Election. In our view, incoming opinion polls that show the Conservatives maintaining or extending their current lead could support sterling as we approach Election Day.
GBP/USD slid following the Bank's signals, falling below the (support now turned into resistance) barrier of 1.2900 (R1) to hit the key hurdle of 1.2850 (S1). Then the rate rebounded somewhat. The pair has been oscillating between that hurdle and the psychological zone of 1.3000 (R2) since the 27th of April, so given our proximity to the lower end of that range, we see the likelihood for further rebound in coming days. A break back above 1.2900 (R1) could confirm our view and is possible to set the stage for another test near the round figure of 1.3000 (R2).
Today's highlights:
During the European day, we get Germany's preliminary GDP data for Q1 and the forecast is for economic growth to have accelerated. We also get the nation's final CPI for April, as well as Eurozone's industrial production for March, though none of these indicators is usually a major market mover.
From the US, we get US CPI and retail sales data, all for April. Kicking off with the CPIs, the forecast is for the headline rate to have ticked down, and for the core rate to have remained unchanged. In case of an unchanged core print, we think that investors may focus primarily on retail sales, which come out at the same time. Both the headline and core retail sales rates are expected to have risen notably in monthly terms. Following two consecutive months of soft prints, we think that a rebound would be encouraging news for FOMC policymakers, who at their latest policy gathering noted they expect GDP growth to pick up speed in Q2. Strong retail sales could be a sign the US economy entered Q2 on a solid footing, and may thereby bring USD under renewed buying interest. We also get the nation's preliminary U of M consumer sentiment index for May.
USD/JPY traded lower yesterday after it hit again resistance at 114.35 (R1). Nevertheless, the setback was stopped by the short-term uptrend line drawn from the low of the 21st of April, near the 113.50 (S1) support area. Strong retail sales today may encourage the bulls to take advantage of yesterday's retreat and pull the trigger for another test at the 114.35 (R1) obstacle. If they manage to overcome it, they may set their sights on the next resistance of 114.90 (R2).
We have three speakers on the agenda: ECB Vice President Vitor Constancio, Chicago Fed President Charles Evans and Philadelphia Fed President Patrick Harker.