

Sample Category Title
Market Update – Asian Session: China Achieves Trade Deal With US After Trump-Xi Talks
Asia Mid-Session Market Update: China achieves trade deal with US after Trump-Xi talks; Investors await key US Retail Sales and CPI reports
US Session Highlights
(US) Fed’s Dudley (voter, dove): Trade protectionism is a dead-end and destructive to US economy; would hurt US exporters, productivity and workers - comments from India
OPEC Apr Monthly Report: Maintains 2017 global oil demand growth at 1.27M bpd; raises 2017 Non-OPEC oil supply growth from 580K bpd to 950K bpd
(US) INITIAL JOBLESS CLAIMS: 236K V 245KE; CONTINUING CLAIMS: 1.92M V 1.98ME
(US) APR IMPORT PRICE INDEX M/M: 0.5% V 0.1%E; Y/Y: 4.1% V 3.6%E; Ex-Food&Energy M/M: 0.4% v 0.2%e; Y/Y: 1.9% v 1.6%e
(US) APR PPI FINAL DEMAND M/M: 0.5% V 0.2%E; Y/Y: 2.5% V 2.2%E
Stocks felt the weight of drops in sales from two of the nation's largest retailers, Macy's and Kohl's. Concerns that consumers were staying away from stores sparked fears the lack of spending may spread to other industries. Financials and consumer discretionary were the laggards on the day, down 0.6% and 0.5% respectively.
US markets on close: Dow -0.1%, S&P500 -0.2%, Nasdaq -0.2%
Best Sector in S&P500: Consumer Staples
Worst Sector in S&P500: Consumer Discretionary
Biggest gainers: NVDA +4.3%; TXT +3.6%; MYL +3.2%
Biggest losers: M -17.0%; FTR -9.1%; KSS -7.8%
At the close: VIX 10.6 (+0.4pts); Treasuries: 2-yr 1.34% (-2bps), 10-yr 2.40% (-1bps), 30-yr 3.03% (-1bps)
US movers afterhours
TTD Reports Q1 $0.11 v $0.01e, R$53.4M v $43.4Me; Guides Q2 R$67M v $59.2Me, adj EBITDA 14.5M; +22.1% afterhours
JWN Reports Q1 $0.37 v $0.27e, R$3.28B v $3.36Be; Affirms FY17 guidance; -4.1% afterhours
VJET Reports Q1 -€0.65 v -€0.84 y/y, Rev €4.5M v €4.9M y/y; Affirms FY17 Gross margin above 40%, EBITDA "neutral to positive", and CAPEX €8-9M; -6.3% afterhours
CYBR Reports Q1 $0.28 v $0.23e, R$59M v $57.8Me; Cuts FY17 $1.18-1.22 v $1.23e; -6.4% afterhours
DAR Reports Q1 $0.04 v $0.07e, R$880.1M v $848Me; -9.1% afterhours
Key economic data
(JP) JAPAN APR M2 MONEY STOCK Y/Y: 4.3% V 4.3%E; M3 MONEY STOCK Y/Y: 3.6% V 3.6%E
(NZ) NEW ZEALAND APR BUSINESS MANUFACTURING PMI: 56.8 V 58.0 PRIOR; First sequential decline in 3 months
(NZ) New Zealand REINZ April House Sales Y/Y: -31% v -10.7% prior; -32% m/m
Asia Session Notable Observations, Speakers and Press
Asian indices mixed going into critical US CPI and Retail Sales data on Friday that could make or break the case for anticipated June Fed hike as US central bank grapples with "transitory" Q1 soft patch and better labor data last month. Political turbulence that followed yesterday's firing of FBI chief may take a back seat to news of a US-China trade agreement set to expand rade in beef/chicken and also boost access for financial firms. This could further reduce the anxiety over US-China trade war and serve as evidence of a fruitful Trump-Xi bilateral round of talks. China MOFCOM vice min also said the 2 sides will discuss the framework of 1-year economic cooperation plan with US.
Regionally, PBOC confirmed CNY459B MLF operation while also skipping daily OMO. Yuan fix was firmer for 2nd straight day and by a more sizeable margin. FX majors remained in narrow ranges.
China
(CN) China Vice Commerce Min Yu Jianhua: To discuss a 1-year economic cooperation plan with US; Looking to strengthen bilateral economic cooperation and hold further talks this summer - press
(CN) China Apr vehicle sales 2.1M units, -2.2% y/y v +4.0% in Mar; Biggest decline since Aug 2015 - China Association of Automobile Manufacturers (CAAM)
(CN) China Banking Regulator (CBRC) notes risks related to China banks' support to Belt and Road projects - Chinese press
(CN) US and China reportedly have reached broad agreement on expanding some US exports, including liquefied natural gas - press
Japan
(JP) BOJ exec director Amamiya : Reiterates it is too early to consider ways to withdraw monetary stimulus - press
Australia/New Zealand
(AU) Moody’s: Australia budget supports fiscal strength, but deficit likely wider than gov’t expects
Asian Equity Indices/Futures (01:00ET)
Nikkei -0.6%, Hang Seng +0.1%, Shanghai Composite +0.4%, ASX200 -0.8%, Kospi -0.5%
Equity Futures: S&P500 -0.1%; Nasdaq -0.2%, Dax -0.1%, FTSE100 -0.1%
FX ranges/Commodities/Fixed Income (01:00ET)
EUR 1.0860-1.0875; JPY 113.65-113.95; AUD 0.7370-0.7390; NZD 0.6825-0.6850
June Gold +0.2% at 1,227/oz; June Crude Oil +0.2% at $47.90/brl; July Copper +0.2% at $2.51/lb
(CN) PBOC SETS YUAN MID POINT AT 6.8948 V 6.9051 PRIOR; 2nd straight firmer setting; Biggest margin of strength in the fix since Apr 24th
(CN) PBoC: Confirms CNY459B MLF operation; Offers 6-month MLF at 3.05%; Offers 1-year MLF at 3.2%
(AU) Australia MoF (AOFM) sells A$800M in 3.25% 20 Bonds; avg yield: 2.8033%; bid-to-cover: 3.15x
(NZ) New Zealand sells NZ$100M in 2.50% 2035 inflation indexed bonds; bid to cover 4.71x
Asia equities notable movers
Australia
A2Milk (A2M) -4.9%; CEO share sale
Japan
Nissan (7201) +3.0%; FY result
Panasonic (6752) -2.2%; FY result
Sharp (6753) +3.0%; May apply for TSE 1 tier
Toshiba (6502) -1.8%; Chip unit sale may be delayed
Hong Kong
Hua Hong Semi (1347) +4.4%; Q1 result
Rusal (486) +4.0%; Q1 result
GBP/JPY Daily Outlook
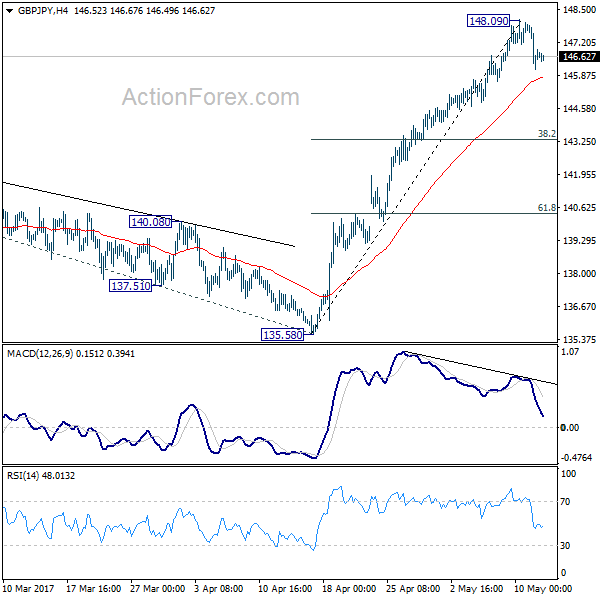
Daily Pivots: (S1) 145.92; (P) 146.93; (R1) 147.73; More....
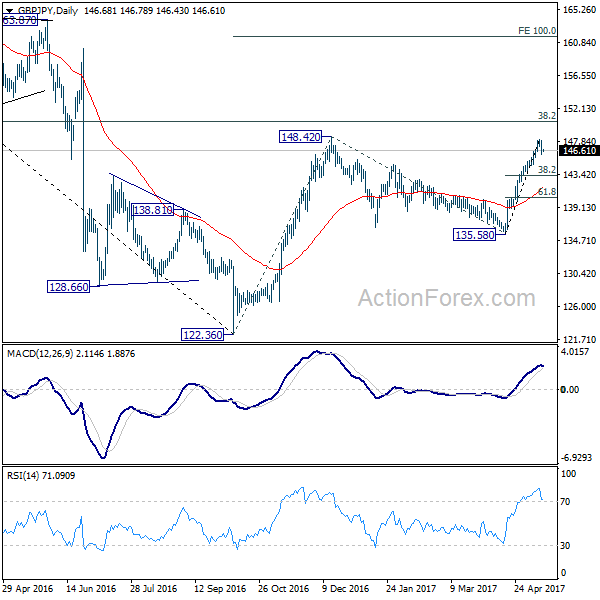
A temporary top is in place at 148.09 in GBP/JPY, ahead of 148.42 resistance. Intraday bias is turned neutral for consolidation. Downside of retreat should be contained by 38.2% retracement of 135.58 to 148.09 at 143.31 and bring rise resumption. Break of 148.42 will target 150.42 long term fibonacci level first. Break there will pave the way to 100% projection of 122.36 to 148.42 from 135.58 at 161.64.
In the bigger picture, based on current momentum, rise from 122.36 bottom should be developing into a medium term move. Break of 38.2% retracement of 195.86 to 122.36 at 150.42 should pave the way to 61.8% retracement at 167.78. This will now be the favored case as long as 135.58 support holds.
EUR/JPY Daily Outlook
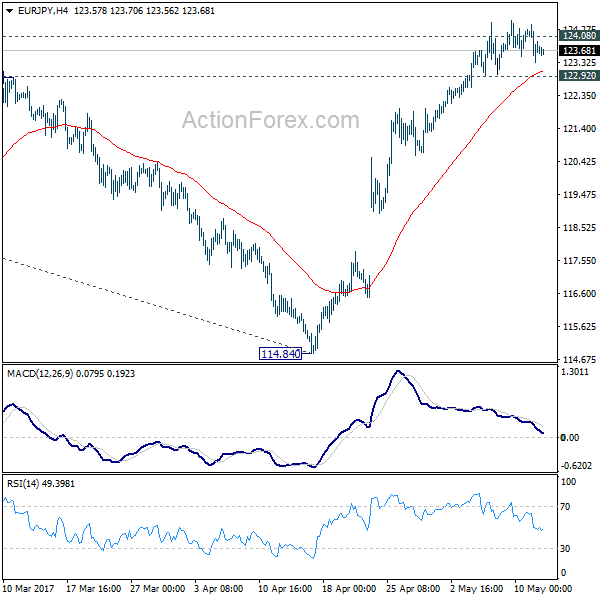
Daily Pivots: (S1) 123.17; (P) 123.79; (R1) 124.28; More...
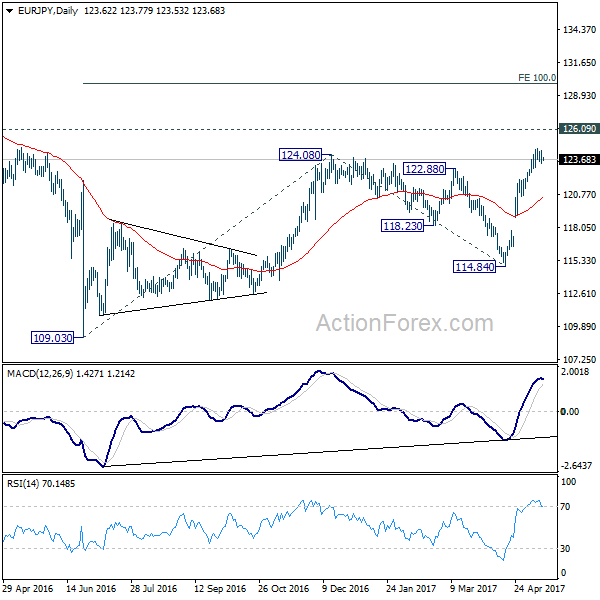
No change in EUR/JPY's outlook despite diminishing upside moment as seen in 4 hour MACD. Further rally is expected with 122.92 minor support intact. Firm break of 124.08 resistance will confirm resumption of whole rise from 109.20. In that case, EUR/JPY would target 126.09 resistance first. Break there will pave the way to 100% projection of 109.03 to 124.08 from 114.84 at 129.89. On the downside, below 122.92 minor support will turn bias to the downside and bring pull back.
In the bigger picture, focus is back on 126.09 support turned resistance. Decisive break there will confirm completion of the down trend from 149.76. And in such case, rise from 109.20 is at the same degree and should target 141.04 resistance and above. Meanwhile, rejection from 126.09 and break of 114.84 will extend the fall from 149.76 through 109.20 low.
EUR/AUD Daily Outlook
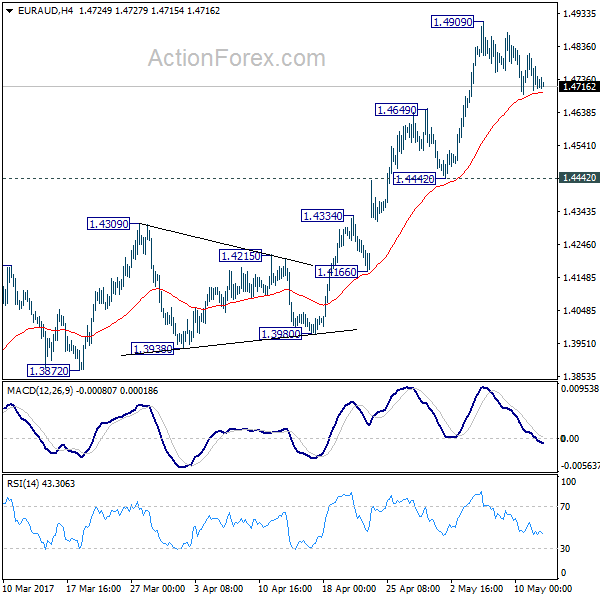
Daily Pivots: (S1) 1.4674; (P) 1.4745; (R1) 1.4786; More...
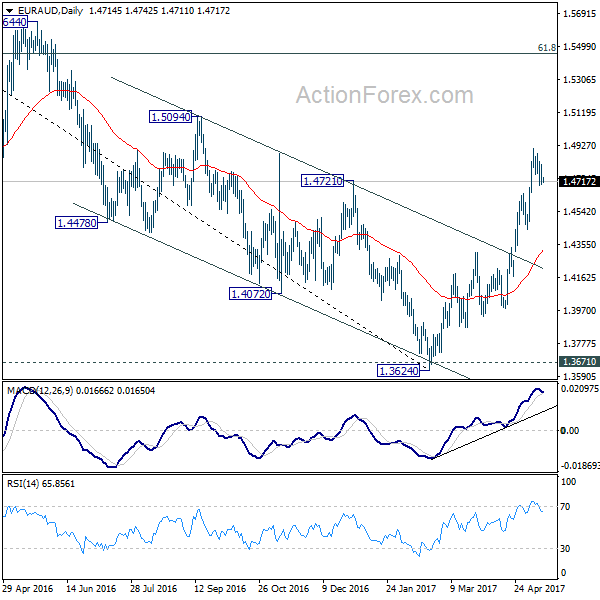
Intraday bias in EUR/AUD remains neutral as the consolidation from 1.4909 continues. Deeper retreat cannot be ruled out. But downside should be contained by 1.4442 support and bring another rise. Break of 1.4909 will extend whole rise from 1.3624 to next medium term fibonacci level at 1.5455.
In the bigger picture, price actions from 1.6587 medium term top are viewed as a corrective pattern. Such correction should be completed after defending 1.3671 key support. Rise from 1.3642 is now expected to target 61.8% retracement of 1.6587 to 1.3624 at 1.5455 and above. In any case, outlook will now stay cautiously bullish as long as 1.4309 resistance turned support holds.
EUR/GBP Daily Outlook
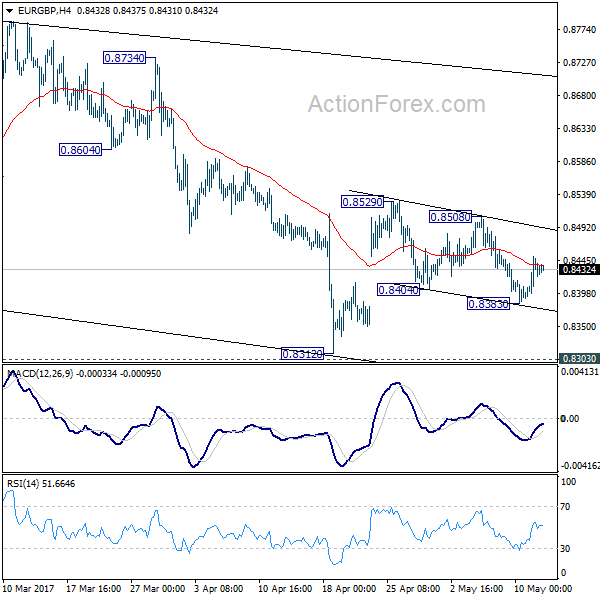
Daily Pivots: (S1) 0.8396; (P) 0.8423; (R1) 0.8454; More...
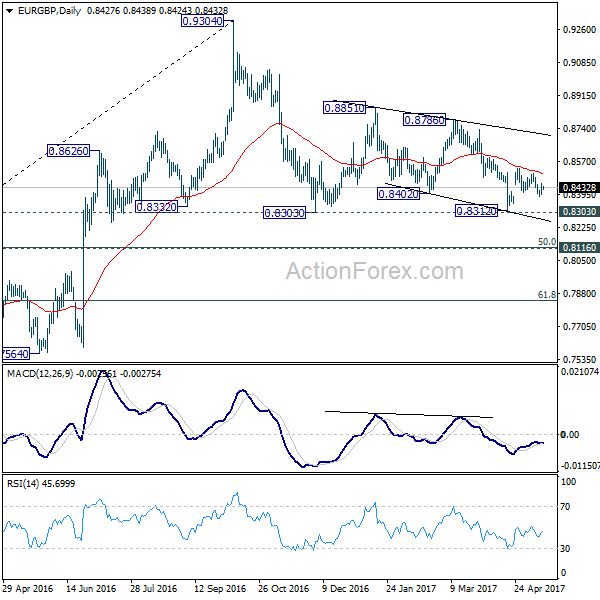
Intraday bias in EUR/GBP is turned neutral with a temporary low formed at 0.8383. The corrective structure of price actions from 0.8529 is favoring more upside in the cross. Break of 0.8508 will extend the rebound from 0.8312 to 0.8786 resistance next. On the downside, below 0.8383 will turn bias to the downside for 0.8303/8312 support zone instead. Overall, EUR/GBP is staying in the corrective pattern from 0.9304 which will extend for a while.
In the bigger picture, price actions from 0.9304 are viewed as a medium term corrective pattern. In case of deeper fall, we'd expect strong support from 0.8116 cluster support (50% retracement of 0.6935 to 0.9304 at 0.8120) to contain downside. Rise from 0.6935 (2015 low) will resume at a later stage to 0.9799 (2008 high). However, sustained break of 0.8116 could bring deeper decline to next key support level at 0.7564 before the correction completes.
EUR/CHF Daily Outlook
Daily Pivots: (S1) 1.0925; (P) 1.0949; (R1) 1.0969; More...
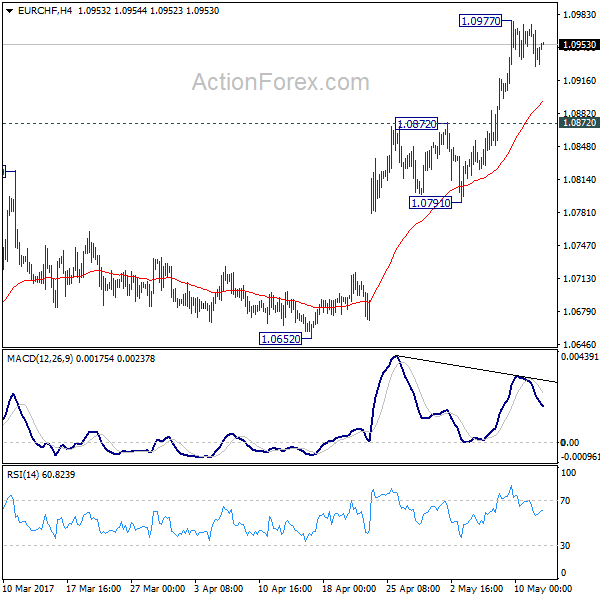
A temporary top is in place at 1.0977 in EUR/CHF and intraday bias is turned neutral for the moment. Some consolidations could be seen but downside of retreat should be contained by 1.0791/0872 support zone to bring rise resumption. As noted before, the consolidative pattern from 1.1198 should be completed. Firm break of 1.0999 resistance will pave the way for a retest on 1.1198 high.
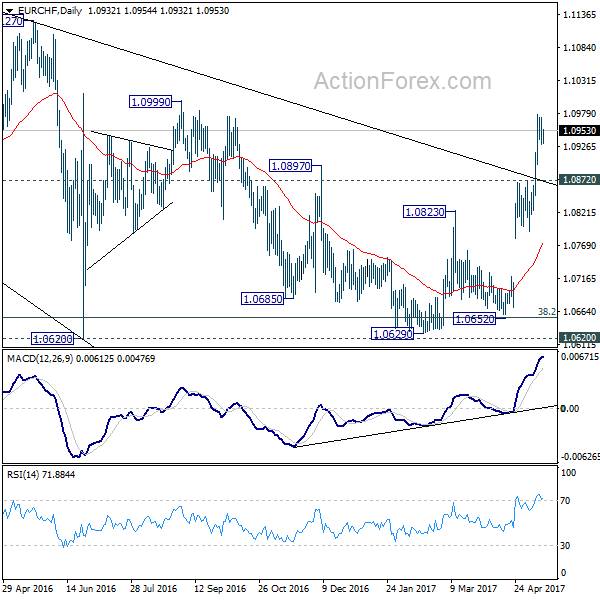
In the bigger picture, the price actions from 1.1198 are seen as a corrective move. Current strong rebound is raising the chance that it's completed after defending 38.2% retracement of 0.9771 to 1.1198 at 1.0653. Decisive break of 1.0999 resistance will target a test on 1.1198 high. For now, this will be the preferred case as long as 1.0791 support holds.
Kiwi Dollar May Have Found This Year’s Low
Key Points:
- Two key patterns are nearing their ends.
- Near-term consolidation looks likely.
- A breakout could be on the horizon.
A number of chart patterns are all nearing their endgame for the Kiwi Dollar which could mean that we have some interesting trading ahead. Notably, we could see both some decent buying and selling pressure before the month is done and, following this, we could even have a change in the long-term trend.
First and foremost, the two key patterns influencing the NZD at the moment are the long-term ABC wave the more recent falling wedge structure. Combined, they indicate that we can expect to see the pair move higher in the immediate future before reversing once again to retest the bottom of the wedge and the long-term declining trend line. Importantly, such a movement would be in line with a number of other technical readings, including the Parabolic SAR and EMA bias.
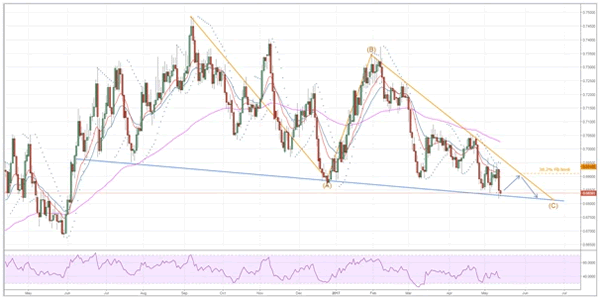
Nevertheless, this narrowing price action could really just be the start of our story and the real trading opportunity looks as though it is going to come in the wake of the wedge's completion. Specifically, the ending of both an ABC wave and a falling wedge around the same time should mean that we have a bullish breakout on our hands which could reverse the long-term trend and usher in another tranche of gains for the embattled Kiwi Dollar.
If this occurs, gains are likely to be substantial, potentially extending all the way back to last year's highs. Of course, this would largely be in line with much of the fundamental bias which is becoming bullish given the general recovery of dairy prices and the plunging unemployment rate in NZ. Both of these factors are likely to see inflation rise moving forward which could put pressure on the RBNZ to re-evaluate its historically low interest rates.
Regardless, in the near-term, we are forecasting a modest uptick in buying pressure that should be capped around the 0.6910 mark by the 38.2% Fibonacci level and the ABC wave. The following rebound is also worth taking into consideration as it could be this year's low should the aforementioned breakout take place.
Dollar’s Next Hurdles
A bull market is like a great trader. The good days are solid and consistent, while the bad days are rare and the losses minimal. We explore the USD below. In response to rising questions about metals from Premium subscribers with regards to our gold and silver trades, a special charts alert has just been posted and sent to members about Ashraf's view on gold, backed by 7 technical arguments.
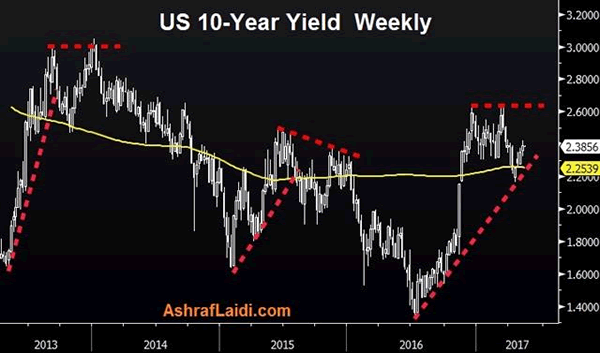
That's how the US dollar and S&P 500 are performing at the moment. A shudder hit both early in US trading, but it came after days of gains and by late trading, the dip was minimized.
On the day, the yen was the top performer while the New Zealand dollar lagged. The Asia-Pacific calendar winds down with a quiet calendar but US CPI and retail sales are out later.
The Fed is helping to keep a constant bid under the dollar. Comments from NY Fed's Dudley didn't get much attention because he was speaking in Mumbai but he provided the clearest evidence yet that the Fed is committed to a June hike. He said the recovery continues apace, which is seemingly innocuous but in the context of the Fed fund futures market pricing in a greater-than 90% chance of a hike, it's a tacit endorsement, particularly from one of the FOMC's more cautious members.
As has been shown over the last 6 months, everything can change and the swiftest means for that is via economic data. As we noted earlier in the week, the quiet calendar helped the US dollar drift. That changes Friday when CPI and retail sales are released at the same time.
At some point the market (and the Fed) will lose patience with the inability of hard data to catch up with soft numbers. The retail sales control group is expected to rise 0.4% and it will need to at least come close or some second thoughts will creep in.
There is likely more leeway on inflation but beyond the June FOMC, Yellen will need to see a sustained upturn if gradual hikes are to continue.
But even if the numbers are soft, it's proven tough to hold US dollar shorts. The slump on last week's non-farm payrolls was wiped out by Monday and given the strength of the USD market, we can't rule out a repeat.
Aussie Trading Higher In The Morning Session
For the 24 hours to 23:00 GMT, the AUD rose 0.22% against the USD and closed at 0.7371.
LME Copper prices rose 1.2% or $68.5/MT to $5580.5/MT. Aluminium prices rose 0.9% or $17.0/MT to $1887.0/MT.
In the Asian session, at GMT0300, the pair is trading at 0.7379, with the AUD trading 0.11% higher against the USD from yesterday’s close.
The pair is expected to find support at 0.7347, and a fall through could take it to the next support level of 0.7314. The pair is expected to find its first resistance at 0.7400, and a rise through could take it to the next resistance level of 0.7420.
Moving ahead, Reserve Bank of Australia’s (RBA) May meeting minutes along with Australia’s unemployment rate and Westpac consumer confidence data, slated to release next week, will be on investors’ radar.
The currency pair is trading above its 20 Hr and 50 Hr moving averages.

European Commission Lifted Euro-Zone’s Growth Forecast For 2017
For the 24 hours to 23:00 GMT, the EUR marginally declined against the USD and closed at 1.0862.
Yesterday, the European Commission (EU), in its quarterly economic forecasts report, slightly upgraded Euro-zone's economic growth forecast to 1.7% for 2017, from 1.6% estimated earlier in February. However, the Commission left the region's growth predictions for 2018 unchanged.
On the data front, Germany's wholesale price index climbed 0.3% on a monthly basis in April. In the prior month, the index had registered a flat reading.
In the US, data indicated that the number of Americans filing for fresh jobless claims unexpectedly dropped to a level of 236.0K in the week ended 06 May 2017, pointing to a tightening in the labour market. Market participants were anticipating initial jobless claims to rise to a level of 245.0K, compared to a level of 238.0K in the previous week. Additionally, the nation's producer prices climbed more-than-anticipated by 0.5% on a monthly basis in April, compared to a fall of 0.1% in the prior month. Markets were anticipating producer price to rise 0.2%.
In the Asian session, at GMT0300, the pair is trading at 1.0871, with the EUR trading 0.08% higher against the USD from yesterday's close.
The pair is expected to find support at 1.0842, and a fall through could take it to the next support level of 1.0812. The pair is expected to find its first resistance at 1.0897, and a rise through could take it to the next resistance level of 1.0922.
Trading trends in the Euro today is expected to be determined by the release of the Euro-zone's industrial production for March and Germany's flash 1Q GDP data, due in a few hours. Moreover, in the US, consumer price index and advance retail sales, both for April coupled with Michigan consumer sentiment index for May, will garner significant amount of market attention.
The currency pair is showing convergence with its 20 Hr and 50 Hr moving averages.
