Sample Category Title
Bank Of England Left Interest Rates Unchanged, Lowered 2017 Growth Forecast
For the 24 hours to 23:00 GMT, the GBP declined 0.32% against the USD and closed at 1.2888, after the Bank of England (BoE) trimmed Britain’s 2017 economic growth outlook.
The BoE, at its latest monetary policy meeting, opted to keep its interest rates steady at a record low level of 0.25%, with one member, Kristen Forbes, again voting in favour of an immediate rate hike. Further, the BoE lowered its growth forecast for this year to 1.9% from 2.0%, while raised it for 2018 to 1.7% from 1.6%. Moreover, the bank revised up its inflation forecast, expecting inflation to peak at just below 3.0% in the fourth quarter. In a post meeting statement, the BoE Governor, Mark Carney, warned of a sharper-than-expected squeeze on household income, while also suggested that the central bank could raise rates more sharply than expected if Brexit talks go smoothly and the economy remains stable.
Prior to the monetary policy meeting, the Pound fell against the USD after the latest economic data indicated that the UK economy slowed sharply in the first quarter.
Britain’s industrial production dropped more-than-expected by 0.5% on a monthly basis in March, dropping for a third consecutive month and compared to market expectations for a drop of 0.4%. Industrial production had fallen by a revised 0.8% in the prior month. Further, the nation’s manufacturing production eased 0.6% MoM in March, more than market expectations for a drop of 0.2%. In the prior month, manufacturing production had dropped by a revised 0.3%. Also, construction output unexpectedly eased 0.7% MoM in March, defying market expectations for an advance of 0.4%. In the previous month, construction output had registered a revised drop of 1.3%. Moreover, the nation’s total trade deficit widened more-than-expected to a level of £4.9 billion in March, compared to a revised deficit of £2.7 billion in the previous month.
In other economic news, leading think tanker, NIESR estimated that UK’s gross domestic product (GDP) advanced 0.2% in the three months to April 2017, whereas investors had envisaged for a rise of 0.4%. In the January-March 2017 period, NIESR estimated GDP had climbed by a revised 0.3%.
In the Asian session, at GMT0300, the pair is trading at 1.2884, with the GBP trading slightly lower against the USD from yesterday’s close.
The pair is expected to find support at 1.2838, and a fall through could take it to the next support level of 1.2792. The pair is expected to find its first resistance at 1.2939, and a rise through could take it to the next resistance level of 1.2994.
The currency pair is showing convergence with its 20 Hr moving average and trading below its 50 Hr moving average.

Japanese Yen Trading Higher This Morning
For the 24 hours to 23:00 GMT, the USD declined 0.48% against the JPY and closed at 113.76.
In economic news, data revealed that Japan’s Eco-Watchers survey for the current situation index rose to a level of 48.1 in April, higher than market expectations for an advance to a level of 47.8. The index had registered a reading of 47.4 in the prior month. Further, the nation’s Eco-Watchers survey for the future outlook index climbed more-than-estimated to a level of 48.8 in April, compared to market expectations of a rise to a level of 48.2. In the previous month, the index had recorded a reading of 48.1.
In the Asian session, at GMT0300, the pair is trading at 113.65, with the USD trading 0.1% lower against the JPY from yesterday’s close.
The pair is expected to find support at 113.30, and a fall through could take it to the next support level of 112.96. The pair is expected to find its first resistance at 114.13, and a rise through could take it to the next resistance level of 114.62.
Next week, market participants focus on Japan’s GDP 1Q data, industrial production and tertiary industry index data, will be eyed by investors.
The currency pair is trading below its 20 Hr and 50 Hr moving averages.

Switzerland’s Consumer Price Inflation Advanced As Expected In April
For the 24 hours to 23:00 GMT, the USD declined 0.13% against the CHF and closed at 1.0077.
Macroeconomic data showed that Switzerland's consumer price index advanced 0.2% MoM in April, meeting market expectations and compared to a similar rise in the prior month.
In the Asian session, at GMT0300, the pair is trading at 1.0074, with the USD trading a tad lower against the CHF from yesterday's close.
The pair is expected to find support at 1.0052, and a fall through could take it to the next support level of 1.0031. The pair is expected to find its first resistance at 1.0097, and a rise through could take it to the next resistance level of 1.0121.
The currency pair is showing convergence with its 20 Hr and 50 Hr moving averages.

Canada’s New House Price Index Climbed In March
For the 24 hours to 23:00 GMT, the USD rose 0.2% against the CAD and closed at 1.3703.
On the macro front, Canada's new housing price index registered a rise of 0.2% on a monthly basis in March, in line with market expectations. In the previous month, the index had advanced 0.4%.
In the Asian session, at GMT0300, the pair is trading at 1.3698, with the USD trading marginally lower against the CAD from yesterday's close.
The pair is expected to find support at 1.3659, and a fall through could take it to the next support level of 1.3621. The pair is expected to find its first resistance at 1.3753, and a rise through could take it to the next resistance level of 1.3809.
The currency pair is showing convergence with its 20 Hr and 50 Hr moving averages.

EUR/USD Daily Outlook
Daily Pivots: (S1) 1.0834; (P) 1.0864 (R1) 1.0889; More....
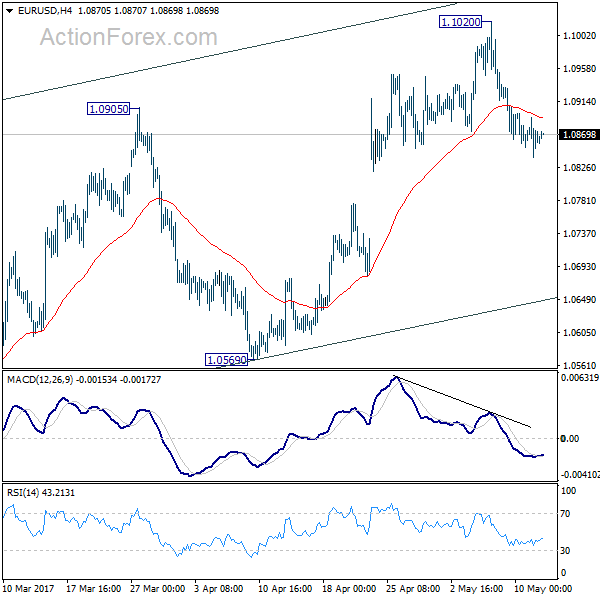
Intraday bias in EUR/USD stays mildly on the downside for the moment. The decline from 1.1020 short term top would extend to 55 day EMA (now at 1.0760) first. As noted before, rise from 1.0339 is seen as a corrective move. Break of 55 day EMA will affirm the case that such correction is completed and bring deeper decline to 1.0569 for confirmation. However, above 1.1020 will extend such corrective rise instead.
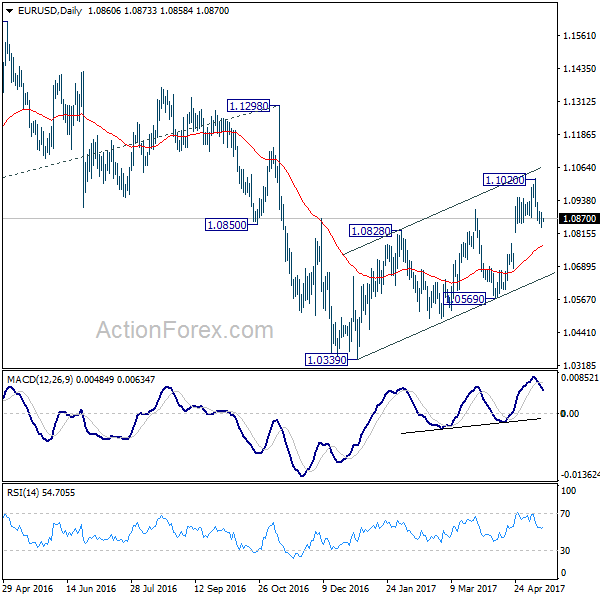
In the bigger picture, as long as 1.1298 key resistance holds, whole down trend from 1.6039 (2008 high) is still expected to continue. Break of 1.0339 low will send EUR/USD through parity to 61.8% projection of 1.3993 to 1.0461 from 1.1298 at 0.9115. However, considering bullish convergence condition in weekly MACD, break of 1.1298 will indicate long term reversal.
GBP/USD Daily Outlook
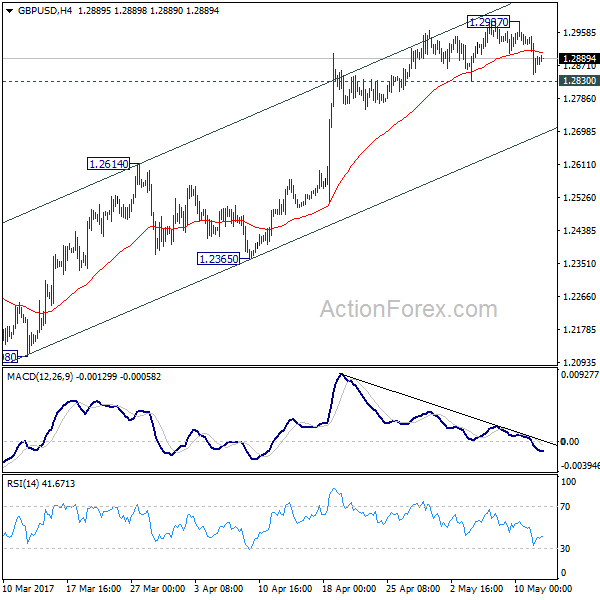
Daily Pivots: (S1) 1.2840; (P) 1.2894; (R1) 1.2940; More...
Intraday bias in GBP/USD remains neutral for the moment. Another rise cannot be ruled out, but upside momentum is clearly weak with bearish divergence condition in 4 hour MACD. Also, current rally is seen as part of the corrective pattern from 1.1946. Hence, even in case of another rally, we'll look for reverse signal above 1.2987. Meanwhile, break of 1.2830 support will indicate short term topping. In such case, intraday bias will be turned back to the downside for 1.2614 support.
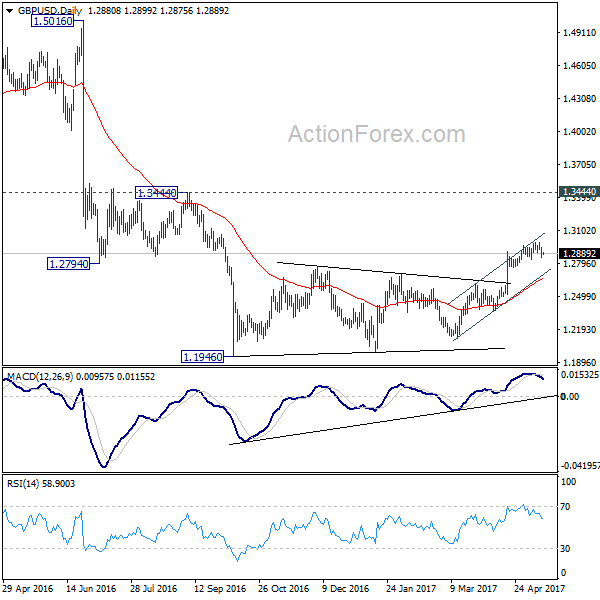
In the bigger picture, fall from 1.7190 is seen as part of the down trend from 2.1161. There is no sign of medium term reversal yet. Sustained trading below 61.8% projection of 2.1161 to 1.3503 from 1.7190 at 1.2457 will target 100% projection at 0.9532. Overall, break of 1.3444 resistance is needed to confirm medium term bottoming. Otherwise, outlook will remain bearish.
Elliott Wave View: SPX Pull Back Started
Short Term Elliott Wave view in SPX suggests the rally from 3/27 low (2322.2) ended at 2403 as a leading diagonal Elliott Wave structure where Minute wave ((i)) ended at 2378.3, Minute wave ((ii)) ended at 2328.95, Minute wave ((iii)) ended at 2398.16, Minute wave ((iv)) ended at 2379.75, and Minute wave ((v)) of A ended at 2403. Near term, while bounces remain below there expect the Index to pull back in larger degree 3, 7, or 11 swings to correct cycle from 3/27 low before the rally resumes again. We don’t like selling the Index and expect buyers to appear after 7 or 11 swings pull back for extension higher. This view remains valid as far as pivot at 3/27 (2322.2) low remains intact.
SPX 1 Hour Elliott Wave Chart
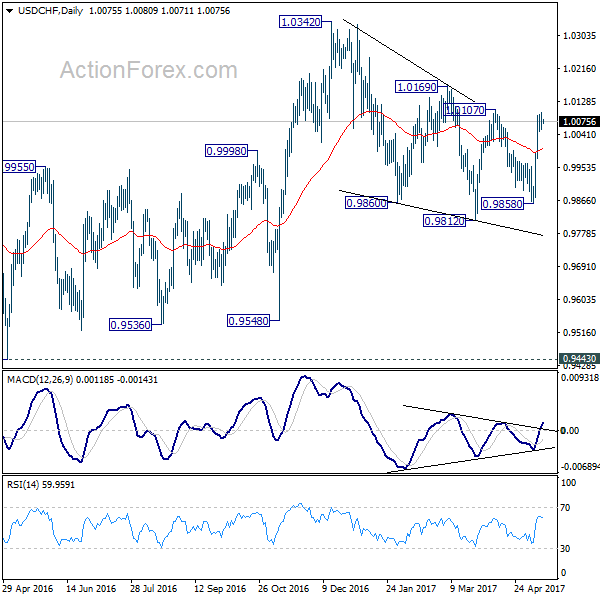
USD/CHF Daily Outlook
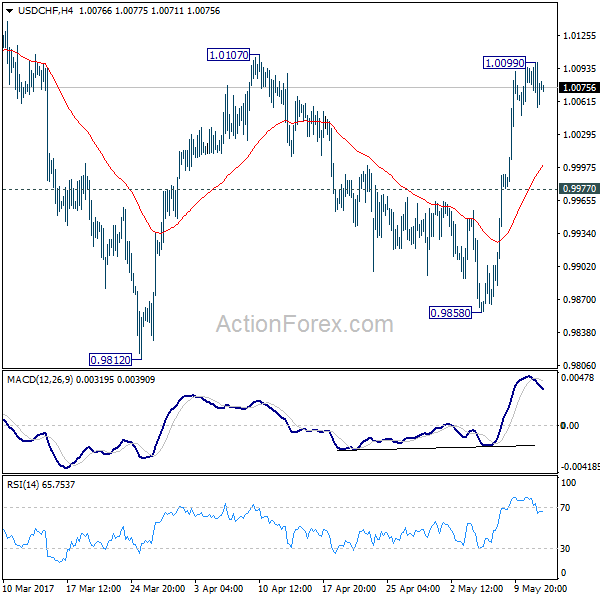
Daily Pivots: (S1) 1.0056; (P) 1.0077; (R1) 1.0099; More.....
A temporary top is in place at 1.0099, ahead of 1.0107 resistance. Intraday bias in USD/CHF is turned neutral first. Some consolidations would be seen but downside of retreat is expected to be contained by 0.9977 and bring another rise. As noted before, correction from 1.0342 should have completed at 0.9812. Break of 1.0107 should pave the way to retest 1.0342 high.
In the bigger picture, we're still maintaining that firm break of 1.0342 key resistance is needed to confirm underlying bullish momentum in the pair. However, the corrective nature of the fall from 1.0342 is starting to give the medium term outlook a bullish favor. Hence, in stead of looking for topping signal around 1.0342, we'd now pay closer attention to upside acceleration as USD/CHF approaches this level again.
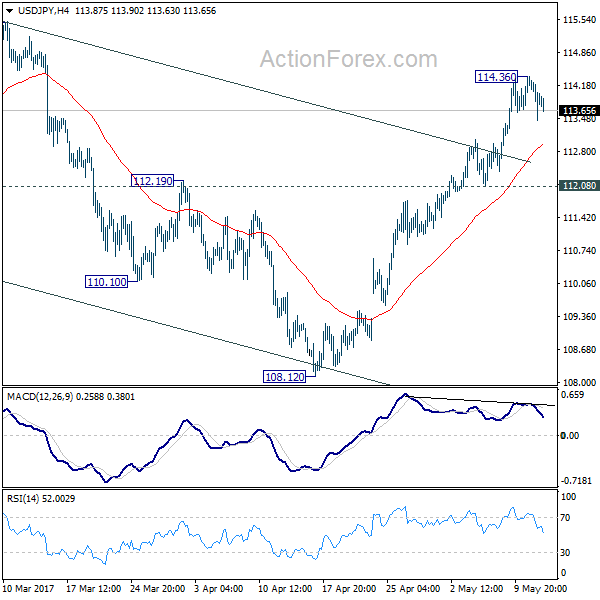
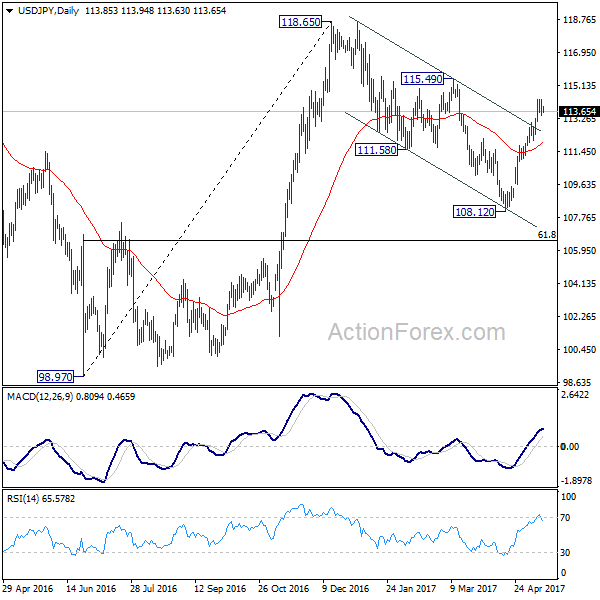
USD/JPY Daily Outlook
Daily Pivots: (S1) 113.42; (P) 113.89; (R1) 114.33; More...
Intraday bias in USD/JPY remains neutral for consolidation below 114.36 temporary top. Some more consolidations would be seen. In case of deeper retreat, downside should be contained by 112.08 support and bring another rally. Outlook remains unchanged that correction from 118.65 has completed with three waves down to 108.12. Above 114.36 will target 115.49 resistance first. Break will resume larger rally from 98.97 to 125.85 high.
In the bigger picture, price actions from 125.85 high are seen as a corrective pattern. It's uncertain whether it's completed yet. But in case of another fall, downside should be contained by 61.8% retracement of 75.56 to 125.85 at 94.77 to bring rebound. Meanwhile, break of 115.49 resistance will extend the rise from 98.97 to retest 125.85. Overall, rise from 75.56 is still expected to resume later after the correction from 125.85 completes.
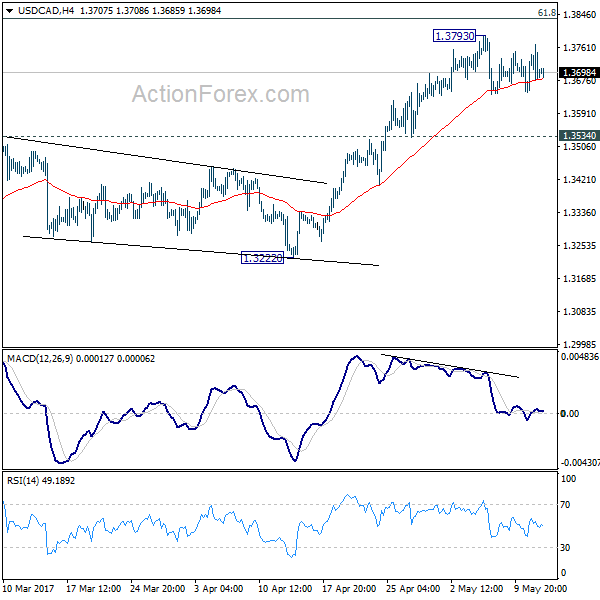
USD/CAD Daily Outlook
Daily Pivots: (S1) 1.3637; (P) 1.3704; (R1) 1.3762; More....
Intraday bias in USD/CAD remains neutral for the moment. With 1.3534 support intact, further rise cannot be ruled out. However, the choppy rally from 1.2450 is seen as a corrective pattern. Hence, in case of another rally, we'll be cautious on topping at around 1.3838 fibonacci level. Meanwhile, consider bearish divergence condition in 4 hour MACD, break of 1.3534 support will argue that rise from 1.2968 is already completed. In such case, intraday bias will be turned back to the downside for 1.3222 support.
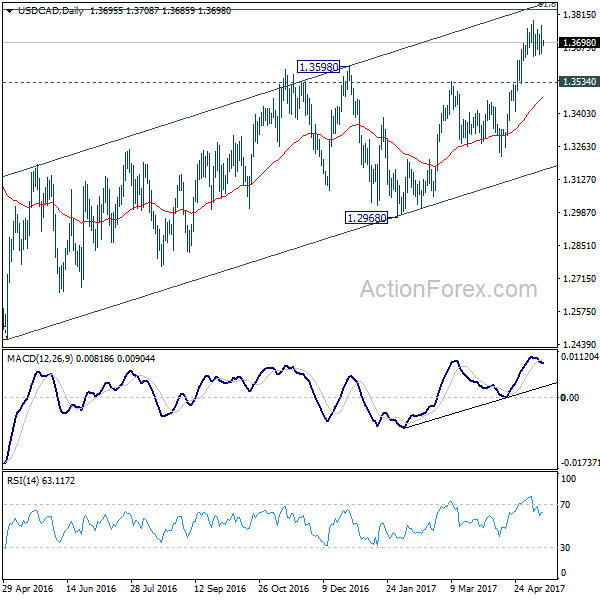
In the bigger picture, price actions from 1.4689 medium term top are seen as a correction pattern. The first leg has completed at 1.2460. Rise from 1.2460 is seen as the second leg and would end at around 61.8% retracement of 1.4689 to 1.2460 at 1.3838. Break of 1.3222 should indicate the start of the third leg while further break of 1.2968 should confirm. Nonetheless, sustained trading above 1.3838 would pave the way to retest 1.4689 high.