

Sample Category Title
Technical Outlook: Spot Gold Consolidating above Fresh Eight-Week Low
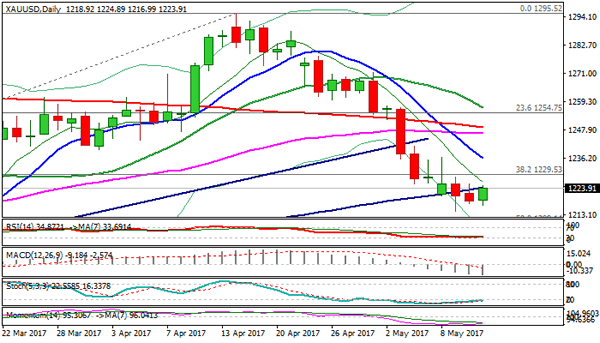
Spot Gold is consolidating above fresh eight-week low at $1214, posted on Tuesday, but recovery action was so far limited and unable to stronger penetrate daily cloud and clear 100SMA to signal stronger rally (daily cloud base lies at $1222 and 100SMA at $1224). Gold received support from political situation in the USA after president Trump dismissed FBI chief, but rising hopes of Fed's interest rate hike in June keep gold's gains limited. However, stronger bounce could be expected on bullish signal from daily RSI/slow stochastic which are reversing from oversold territory. Close above 100SMA will be seen as bullish signal for extended recovery towards strong barriers at $1239/42 (daily cloud top / Tenkan-sen). Overall bearish structure keeps focus at the downside and looks for test of next target at $1210 (weekly cloud base), after current corrective phase is completed.
Res: 1225; 1228; 1236; 1242
Sup: 1222; 1216; 1214; 1210
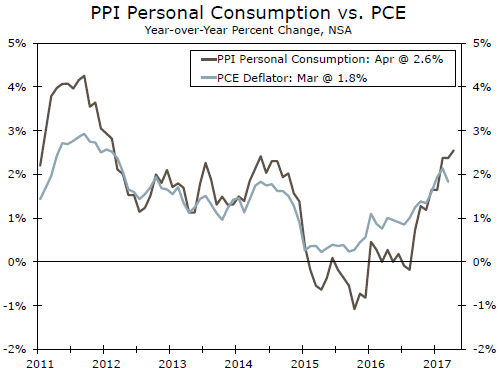
Producer Prices Start Q2 on an Accelerating Note
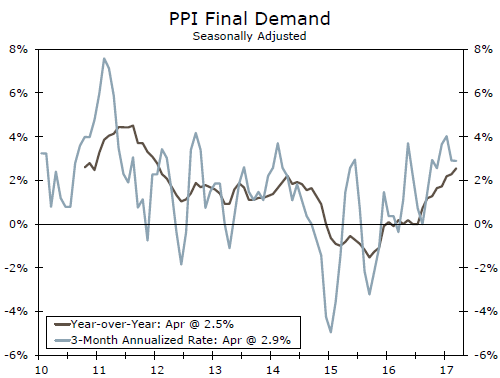
Led by a rebound in services prices, the PPI for final demand increased 0.5 percent in April. Excluding food, energy and trade services, producer inflation is running at its fastest annual pace on record.
March Weakness "Transitory"
Proving March's modest decline was short-lived, PPI for final demand increased at a stronger-than-expected 0.5 percent in April. Price gains were broad based with solid increases in food (0.9 percent), energy (0.8 percent) and services (0.4 percent).
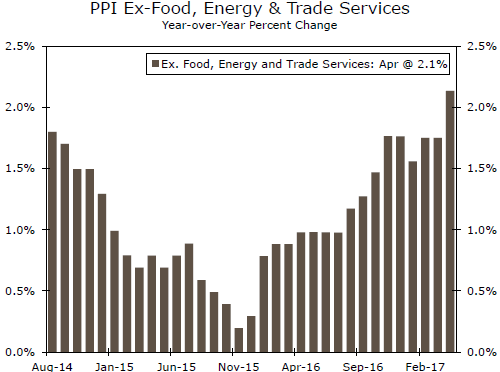
Ex-food, energy and trade services - our preferred measure of PPI - jumped 0.7 percent on the month and is rising at its fastest annual pace on record at 2.1 percent.
Pipeline Pressures Also Building
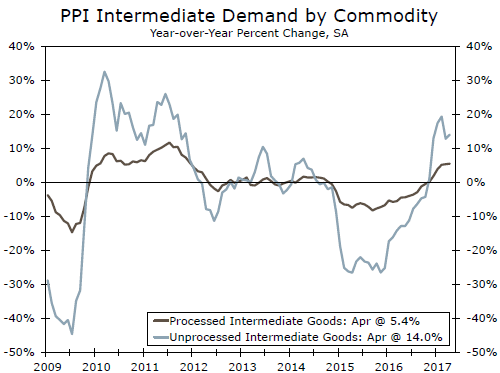
Prices for intermediate goods increased for the eighth consecutive month, up 0.5 percent, while unprocessed goods partially retraced March's decline, increasing 3.3 percent.
With gains broad based and annual rates in the headline and core measures standing at a series high, today's PPI report signals stronger inflation pressures at the start of Q2 and also keeps the Fed on track for a June interest rate hike.
Technical Outlook: US Oil Maintains Firm Near-Term Tone
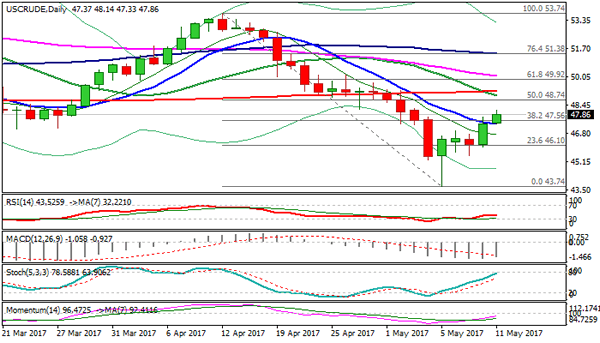
US oil maintains firm near-term tone and probes above $48.00 barrier on extension of strong rally from Wednesday, sparked by stronger than expected fall in US crude inventories. Also, Saudi Arabia is going to reduce supplies to Asia for 7 million barrels in June, which additionally supported oil price recovery.
Today's break above important barrier at $47.56 (Fibo 38.2% of $53.74/$43.74 fall) generated additional bullish signal.
Fresh rally approached barrier at $48.33 (broken Fibo 23.6% of larger $26.04/$55.22 recovery leg) and may extend gains towards $48.74 (daily Kijun-sen) on renewed bullish sentiment.
However, recovery may face strong headwinds on bearish daily studies and 20/200SMA Death-cross that was formed at $49.26 and produces significant pressure.
In addition, slow stochastic is approaching overbought territory on daily chart and may signal limited upside.
To neutralize bearish threats, price needs to clear 200SMA ($49.26) and psychological $50.00 barrier, which lies near Fibo 61.8% of $53.74/$43.74 descend and is reinforced by falling 55SMA.
Broken 10SMA offers initial support at $47.32 (daily low) and near-term action is expected to remain bullishly aligned while the latter holds.
Res: 48.33; 48.74; 49.00; 49.26
Sup: 47.32; 46.96; 46.76; 46.00
Gold Consolidates Following a Substantial Retracement
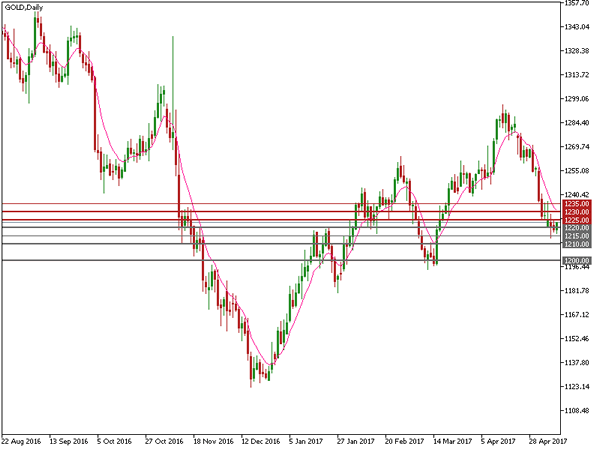
Spot gold has seen a substantial 5% retracement since mid-April as it neared a significant resistance level at $1300.
The French election outcome has lifted markets' "risk-on" sentiment and resulted in safe heavens retreating which has weighed on gold prices.
The dollar has been strengthening over the past three days adding further downward pressure on the price of gold.
Spot gold hit a low of $1214.15 on Tuesday May 9th; a level last seen on March 15.
After reaching this low, gold prices rebounded and have consolidated; in part to the significant support zone between $1200 and $1210. The markets are looking for further upward movement from this zone.
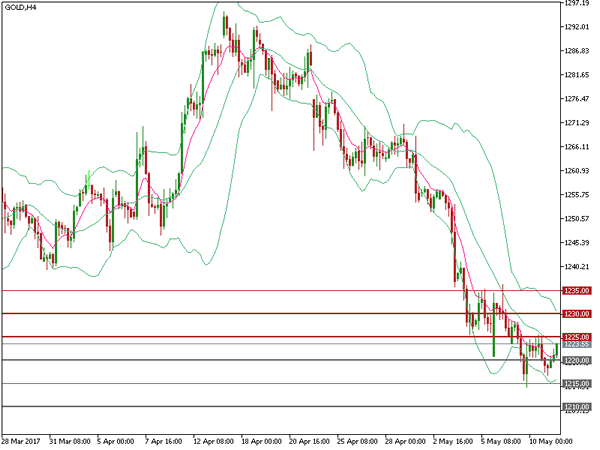
On the 4-hourly chart, the price has been moving from the lower band to the middle band of the Bollinger Band indicator which suggests bearish momentum has been waning.
Be aware that the upside pressure is still heavy.
The resistance level is at 1225, followed by 1230 and 1235.
The support line is at 1220, followed by 1215 and 1210.
Keep an eye on the crucial US data for April, to be released at 13:30 BST on Friday May 12, including retail sales, core retail sales, CPI and core CPI. It will likely affect gold prices.
EUR/USD Mid-Day Outlook
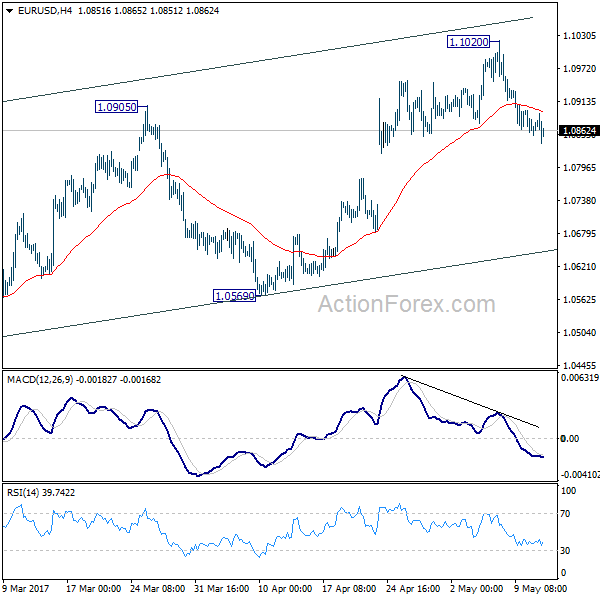
Daily Pivots: (S1) 1.0847; (P) 1.0873 (R1) 1.0892; More....
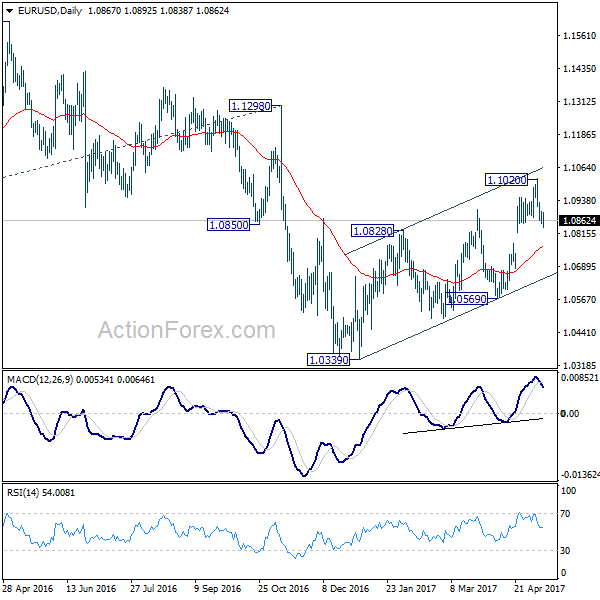
Intraday bias in EUR/USD stays on the downside at this point. With a short term top formed at 1.1020 on bearish divergence condition in 4 hour MACD, deeper decline should be seen to 55 day EMA (now at 1.0760) first. As noted before, rise from 1.0339 is seen as a corrective move. Break of 55 day EMA will affirm the case that such correction is completed and bring deeper decline to 1.0569 for confirmation. Above 1.1020 will extend such corrective rise instead.
In the bigger picture, as long as 1.1298 key resistance holds, whole down trend from 1.6039 (2008 high) is still expected to continue. Break of 1.0339 low will send EUR/USD through parity to 61.8% projection of 1.3993 to 1.0461 from 1.1298 at 0.9115. However, considering bullish convergence condition in weekly MACD, break of 1.1298 will indicate long term reversal.
USD/CHF Mid-Day Outlook
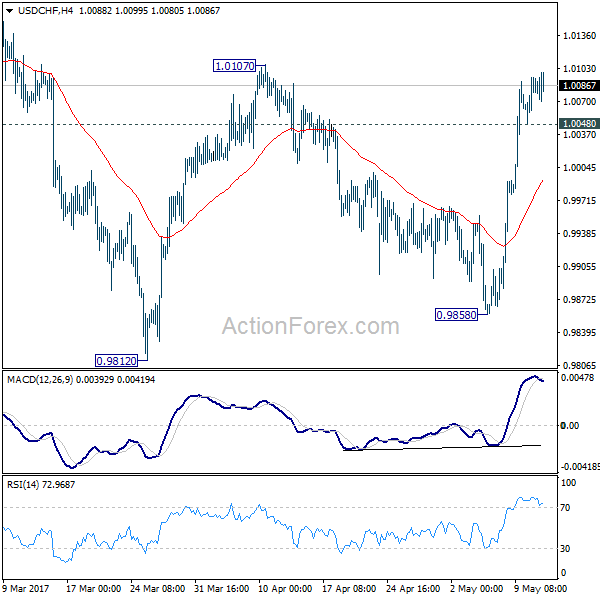
Daily Pivots: (S1) 1.0059; (P) 1.0077; (R1) 1.0105; More.....
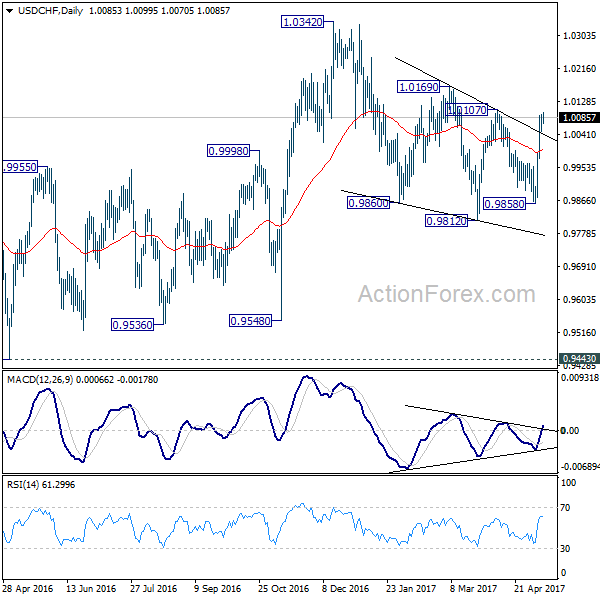
With 1.0048 minor support intact, intraday bias in USD/CHF remains on the upside for 1.0107 resistance next. As noted before, correction from 1.0342 should have completed at 0.9812. Break of 1.0107 should pave the way to retest 1.0342 high. On the downside, below 1.0048 minor support will turn bias neutral and bring consolidation first before staging another rise.
In the bigger picture, we're still maintaining that firm break of 1.0342 key resistance is needed to confirm underlying bullish momentum in the pair. However, the corrective nature of the fall from 1.0342 is starting to give the medium term outlook a bullish favor. Hence, in stead of looking for topping signal around 1.0342, we'd now pay closer attention to upside acceleration as USD/CHF approaches this level again.
USD/JPY Mid-Day Outlook
Daily Pivots: (S1) 113.81; (P) 114.09; (R1) 114.56; More...
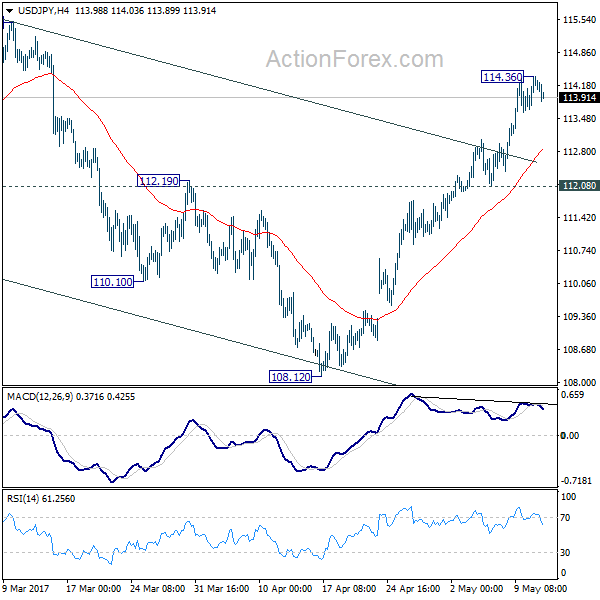
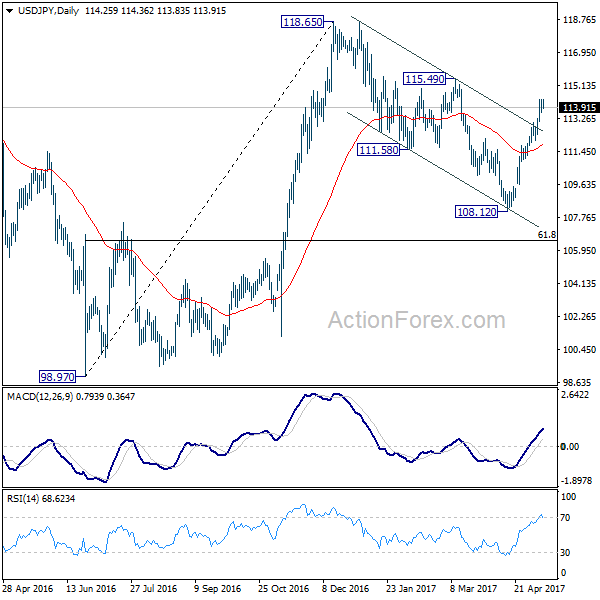
A temporary top is in place at 114.36 in USD/JPY and intraday bias is turned neutral. Some consolidations could be seen but downside of retreat should be contained by 112.08 support and bring another rally. Outlook remains unchanged that correction from 118.65 has completed with three waves down to 108.12. Above 114.36 will target 115.49 resistance first. Break will resume larger rally from 98.97 to 125.85 high.
In the bigger picture, price actions from 125.85 high are seen as a corrective pattern. It's uncertain whether it's completed yet. But in case of another fall, downside should be contained by 61.8% retracement of 75.56 to 125.85 at 94.77 to bring rebound. Meanwhile, break of 115.49 resistance will extend the rise from 98.97 to retest 125.85. Overall, rise from 75.56 is still expected to resume later after the correction from 125.85 completes.
Bank of England Downgrades UK Growth Forecast
The Bank of England (BoE) has lowered its economic growth forecast for the UK to 1.9 percent, lower than February's prediction of 2.0 percent. The BoE says that the downgrade follows a slowing in consumer spending. Rising inflation and poor income growth were cited as the main reasons for consumers feeling the squeeze; reflected in disappointing retail sales data and a surprisingly steep drop in new car sales.
As was widely anticipated, interest rates remain at 0.25 percent.
David Johnson, Director at Halo Financial, comments, "While the latest Consumer Spending and Gross Domestic Product (GDP) data disappointed, recent Purchasing Managers' Index (PMI) results have, in contrast, looked very positive, providing some extra momentum for the Pound and balancing sentiment to some degree."
"In advance of today's "Super Thursday" announcements, Sterling was on the rise again, reaching rates against its major currency partners not seen for months and even years. The Pound was testing the EUR 1.20 level and the USD 1.30 level. However, immediately following today's release of BoE Monetary Policy Committee meeting minutes, Sterling fell against both the Euro and US Dollar from the highs seen early this morning; falling by 0.40 percent and 0.43 percent respectively."
He continues, "Despite all these key economic figures being released and the jumpiness of the Pound in response, we believe markets will continue to focus on the UK general election and the ongoing Brexit negotiations, which are likely to have a greater impact on Sterling than snapshot economic data and forecasts. Volatility and uncertainty will continue for the Pound in its major currency pairings. We are seeing that in movement across the Euro, US Dollar, and Australian Dollars, in particular."
GBP/USD Mid-Day Outlook
Daily Pivots: (S1) 1.2913; (P) 1.2950; (R1) 1.2974; More...
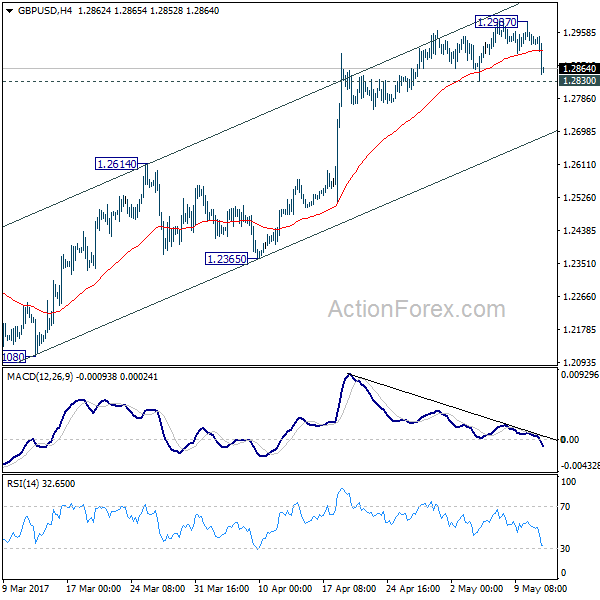
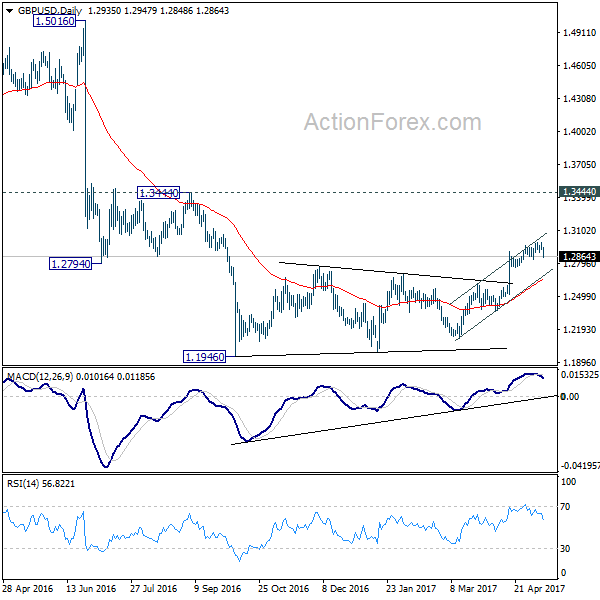
GBP/USD drops sharply today but stays above 1.2830 minor support so far. Intraday bias is neutral first. Another rise cannot be ruled out, but upside momentum is clearly weak with bearish divergence condition in 4 hour MACD. Also, current rally is seen as part of the corrective pattern from 1.1946. Hence, even in case of another rally, we'll look for reverse signal above 1.2987. Meanwhile, break of 1.2830 support will indicate short term topping. In such case, intraday bias will be turned back to the downside for 1.2614 support.
In the bigger picture, fall from 1.7190 is seen as part of the down trend from 2.1161. There is no sign of medium term reversal yet. Sustained trading below 61.8% projection of 2.1161 to 1.3503 from 1.7190 at 1.2457 will target 100% projection at 0.9532. Overall, break of 1.3444 resistance is needed to confirm medium term bottoming. Otherwise, outlook will remain bearish.
British Pound Sold Off after Mixed BoE Projections, Threatening Reversal
Sterling drops sharply after BoE left monetary policies unchanged as widely expected. The updated projections are mixed at best. And more importantly, they were based on the assumption of a "smooth" Brexit, which isn't clearly defined by the central bank. Markets are clearly unhappy with the announcement and the pound suffers steep selloff. Focus will now be on 1.2830 in GBP/USD and a firm break there will indicate near term reversal. On the other hand, the greenback is trying to extend this week's rebound against Euro after solid economic data including PPI and jobless claims. But momentum in Dollar is unconvincing so far. New Zealand Dollar remains the weakest one after RBNZ disappointment.
BoE delivered mixed economic projections
BoE left key interest rate unchanged at 0.25% with 7-1 vote. Kristin Forbes remained the only one voting for a hike. Meanwhile, Charlotte Hogg did not participate. Asset purchase target was held at GBP 435b by 8-0 vote. In the quarterly Inflation Report, UK growth is projected to be at 1.9% in 2017, revised down from prior 2.0%. Growth projections for 2018 and 2019 were revised up, to 1.7% and 1.8% respectively, from 1.6% and 1.7%.
For inflation, BoE raised 2017 CPI projections to 2.7%, up from prior 2.4%. However, for 2018 and 2019, inflation is projected to be 2.6% and 2.2%, down from prior 2.8% and 2.5%. It also noted that "through its effects on costs, the fall in sterling is likely to keep inflation above the 2% target throughout the next three years."
The central bank also noted that "if the economy follows a path broadly consistent with the May central projection, then monetary policy could need to be tightened by a somewhat greater extent over the forecast period than the very gently rising path implied by the market yield curve underlying the May projections." However, BoE also emphasize that "this is conditioned on the assumptions that the adjustment to the United Kingdom's new relationship with the European Union is smooth, and that Bank Rate follows the market-implied path for interest rates."
Released from UK, industrial production dropped -0.5% mom, rose 1.4% yoy in March. Manufacturing production dropped -0.5% mom, rose 2.3% yoy in March. Construction output dropped -0.7% mom in March. Visible trade deficit widened to GBP -13.4b in March. RISC house price balance was unchanged at 22 in April.
US continuing claims dropped to 28 year low
Initial jobless claims dropped -2k to 236k in the week ended May 6, below expectation of 245k. Initial claims now stayed below 300k threshold for 114 straight weeks. Continuing claims dropped -61k to 1.91m in the week ended April 29. That's the lowest level since November 1988. PPI rose 0.5% mom, 2.5% yoy in April, above expectation of 0.2% mom, 2.2% yoy. Core PPI rose 0.4% mom, 1.9% yoy, above expectation of 0.2% mom, 1.7% yoy.
New York Fed Dudley: Protectionism is a dead end
New York Fed President William Dudley said that "protectionism can have a siren-like appeal". And, "viewed narrowly, it may be potentially rewarding to particular segments of the economy in the short term." But he warned that "viewed more broadly, it would almost certainly be destructive to the economy overall in the long term." He further said that "there are many approaches to dealing with the costs of globalization, but protectionism is a dead end." Also, "trying to achieve a high standard of living by following a policy of economic isolationism will fail." Nonetheless, Dudley didn't mention US President Donald Trump and administration in his speech.
Boston Fed Rosegren: Three more hikes this year
Yesterday, Boston Fed President Eric Rosengren mapped out a more hawkish policy path for Fed this year. He noted that Fed should hike three more times this year. In parallel, Fed should also start shrinking the balance sheet. That is, he doesn't advocate a "brief pause". Rosengren said that "along with a gradual reduction in the level of the balance sheet, it would still be reasonable to have three rate increases over the remainder of this year." And "I do not regard the weakness in first quarter data as a harbinger of softness in the underlying economy, and the strength of the labor market report on Friday provides some strong confirmation of that view."
Kiwi tumbled after RBNZ
RBNZ left the OCR unchanged at 1.75% in May. Policymakers shrugged off the recent NZD depreciation and the rise in inflation, indicating that the monetary policy would likely stay unchanged for the rest of the year and probably until 2020 before tightening. The market was disappointed by the lack of hawkish comments and the unchanged forward guidance. Down -1.85, NZDUSD slumped to an 11-month low of 0.6816 after the announcement. More in RBNZ To Leave Rates Unchanged Until 2020, Downplayed Rising CPI And NZD Weakness
ECB Draghi: Too early to declare success
ECB President Mario Draghi said at a Dutch Parliament hearing yesterday that "the economic recovery has evolved from being fragile and uneven into a firming, broad-based upswing. However, he emphasized that "it is too early declare success". Draghi said that incoming data "confirm that cyclical recovery of the euro area economy is becoming increasing solid and that downside risks have further diminished. But, "underlying inflation pressures continue to remain subdued and have yet to show a convincing upward trend." And, the "time to exit or to time to think about exit or not" hasn't come yet. Draghi said "this will happen when inflation" is durable, "self-sustained, and it's for the whole of the euro area."
Also from Europe, Germany WPI rose 0.3% mom in April. Swiss CPI rose 0.2% mom, 0.7% yoy in April.
GBP/USD Mid-Day Outlook
Daily Pivots: (S1) 1.2913; (P) 1.2950; (R1) 1.2974; More...
GBP/USD drops sharply today but stays above 1.2830 minor support so far. Intraday bias is neutral first. Another rise cannot be ruled out, but upside momentum is clearly weak with bearish divergence condition in 4 hour MACD. Also, current rally is seen as part of the corrective pattern from 1.1946. Hence, even in case of another rally, we'll look for reverse signal above 1.2987. Meanwhile, break of 1.2830 support will indicate short term topping. In such case, intraday bias will be turned back to the downside for 1.2614 support.
In the bigger picture, fall from 1.7190 is seen as part of the down trend from 2.1161. There is no sign of medium term reversal yet. Sustained trading below 61.8% projection of 2.1161 to 1.3503 from 1.7190 at 1.2457 will target 100% projection at 0.9532. Overall, break of 1.3444 resistance is needed to confirm medium term bottoming. Otherwise, outlook will remain bearish.
Economic Indicators Update
| GMT | Ccy | Events | Actual | Forecast | Previous | Revised |
|---|---|---|---|---|---|---|
| 21:00 | NZD | RBNZ Rate Decision | 1.75% | 1.75% | 1.75% | |
| 23:01 | GBP | RICS House Price Balance Apr | 22% | 20% | 22% | |
| 05:00 | JPY | Eco Watchers Survey Current Apr | 48.1 | 47.8 | 47.4 | |
| 06:00 | EUR | German Wholesale Price Index M/M Apr | 0.30% | 0.10% | 0.00% | |
| 07:15 | CHF | CPI M/M Apr | 0.20% | 0.20% | 0.20% | |
| 07:15 | CHF | CPI Y/Y Apr | 0.70% | 0.50% | 0.60% | |
| 08:00 | EUR | ECB Economic Bulletin | ||||
| 08:30 | GBP | Industrial Production M/M Mar | -0.50% | -0.40% | -0.70% | -0.80% |
| 08:30 | GBP | Industrial Production Y/Y Mar | 1.40% | 1.90% | 2.80% | 2.50% |
| 08:30 | GBP | Manufacturing Production M/M Mar | -0.60% | -0.20% | -0.10% | -0.30% |
| 08:30 | GBP | Manufacturing Production Y/Y Mar | 2.30% | 3.00% | 3.30% | 3.00% |
| 08:30 | GBP | Construction Output M/M Mar | -0.70% | 0.30% | -1.70% | |
| 08:30 | GBP | Visible Trade Balance (GBP) Mar | -13.4B | -11.6B | -12.5B | -11.4B |
| 09:00 | EUR | European Commission Economic Forecasts | ||||
| 11:00 | GBP | BoE Rate Decision | 0.25% | 0.25% | 0.25% | |
| 11:00 | GBP | BoE Asset Purchase Target May | 435B | 435B | 435B | |
| 11:00 | GBP | MPC Official Bank Rate Votes | 1--0--7 | 1--0--8 | 1--0--8 | |
| 11:00 | GBP | MPC Asset Purchase Facility Votes | 0--0--8 | 0--0--9 | 0--0--9 | |
| 11:00 | GBP | BoE Inflation Report | ||||
| 12:00 | GBP | NIESR GDP Estimate Apr | 0.20% | 0.40% | 0.50% | |
| 12:30 | CAD | New Housing Price Index M/M Mar | 0.20% | 0.30% | 0.40% | |
| 12:30 | USD | PPI M/M Apr | 0.50% | 0.20% | -0.10% | |
| 12:30 | USD | PPI Y/Y Apr | 2.50% | 2.20% | 2.30% | |
| 12:30 | USD | PPI Core M/M Apr | 0.40% | 0.20% | 0.00% | |
| 12:30 | USD | PPI Core Y/Y Apr | 1.90% | 1.70% | 1.60% | |
| 12:30 | USD | Initial Jobless Claims (MAY 06) | 236K | 245K | 238K | |
| 14:30 | USD | Natural Gas Storage | 67B |